From: Terry Reilly
Sent: Thursday, April 09, 2020 5:36:48 PM (UTC-06:00) Central Time (US & Canada)
Subject: FI Evening Grain Comments 04/09/20

PDF attached


USDA
reported US ending stocks for soybeans, corn and wheat above trade expectations.  SA soybean production was revised lower but corn for Argentina and Brazil were unchanged. 


Statistics
Canada will delay its April 24 planting intentions report due to the COVID-19 pandemic.


Conab
reported a 1.8MMT upward revision to its Brazil corn production and lowered soybeans by 2.1 million tons from March.  China CASDE showed projected 2019-20 China corn imports higher but industrial use down from last month.  USDA export sales were good for grains
but not so great for the soybean complex and wheat.  USD traded sharply lower. 

US
Initial Jobless Claims Apr 4: 6606K (exp 5500K; prevR 6867K; prev 6648K).  Fed also announced a new 2.3 trillion program to support economy.


USDA
April supply and demand

Initial
reaction:

Bearish
for all three commodities but bulls waiting on the sideline added to positions.  One supportive feature was a combined downward revision to Argentina and Brazil soybean production by 3.5 million tons. 


USDA
NASS and OCE executive summaries

https://www.nass.usda.gov/Newsroom/Executive_Briefings/index.php

https://www.usda.gov/oce/commodity/wasde/Secretary_Briefing/index.htm


  • US
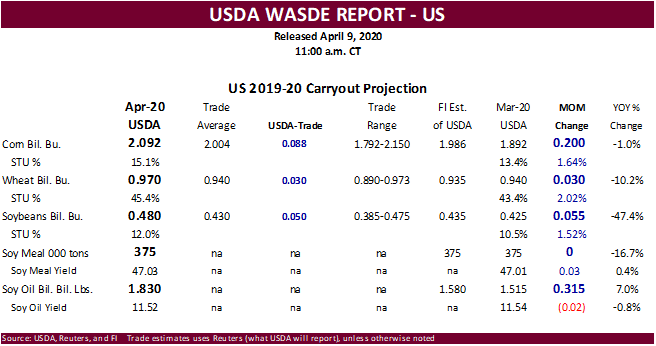
    stocks for soybeans, corn and wheat came in above expectations. 
  • USDA
    took a pessimistic view on corn for ethanol demand, as they should, but cut soybean oil for biodiesel as well, by a large amount, which we thought was unwarranted. 
  • US
    corn for ethanol demand was lowered 375 million bushels to 5.050 billion bushels, well below 5.378 billion in 2018-19.  Corn exports were unchanged at 1.725 billion bushels.  Imports were decreased 5 million to 45 million.  USDA took corn feed and residual
    up 150 million bushels to 5.675 billion bushels compared to 5.430 billion for 2018-19.  Food use  saw a small increase. US ending stocks were lifted higher by 200 million bushels to 2.092 billion, 88 million above a Reuters trade guess.  The high US stocks
    suggest 2020-21 US carryout could reach over 2.4 billion bushels. 
  • US
    soybean exports were revised down 50 million bushels to 1.775 billion, still above 1.748 billion for 2018-191.  USDA lowered the soybean residual by 24 million and raised the crush by 20 million to a record 2.125 billion bushels.  Seed use was lowered 2 million. 
    US 2019-20 ending stocks ended up 55 million bushels to 480 million bushels, 50 million above an average trade guess, and 47 percent below 2018-19. 
  • US
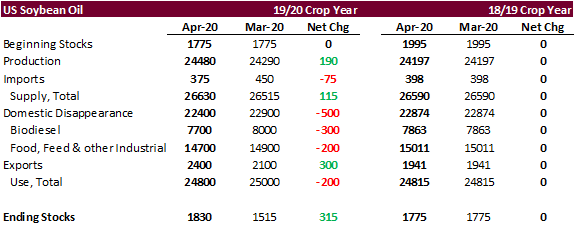
    soybean oil for biodiesel production was revised down 300 million pounds, and exports up 300 million, but food use was lowered 200 million pounds.  With the higher product year crush, soybean oil production was lifted higher by 190 million pounds, and imports
    lowered 75 million.  The 2019-20 soybean oil yield was lowered two tenths to 11.52 pounds per bushel, which matches our estimate. 
  • Our
    US soybean balance sheet looks very different from USDA.  We are under the assumption US biodiesel plants are not seeing the slowdown in output like corn for ethanol plants.  In fact, there is good coverage for this quarter and next quarter, and there are
    ideas soybean oil for biodiesel feedstock will be in more demand as other feedstocks will be able to source over the short-term, like restaurant grease and corn oil. 
  • US
    soybean meal exports were up 250,000 short tons from the previous month to 13.450 million short tons.  Domestic use was increased 300,000 short tons to 37.1 million short tons.  USDA increased production for soybean meal by 500,000 short tons, in large part
    to higher crush. The yield was slightly increased. 
  • US
    all-wheat feed was revised down 15 million bushels to 135 million bushels, a surprise in our opinion.  Exports were lowered 15 million bushels to 985 million bushels.  
  • All-wheat
    wheat stocks were revised 30 million bushels higher to 970 million bushels.  By class, Hard Red Winter and Soft Red Winter were reduced 10 million and 5 million bushels, respectively.
  • Note
    the USDA will resurvey producer corn & soybean area and supply for Michigan, Minnesota, South Dakota and Wisconsin and publish adjustments in its May 12 crop production report, if warranted.   North Dakota will be done at a later date.
    https://www.nass.usda.gov/Newsroom/Notices/2020/04-07-2020.php
  • USDA
    made no changes to Brazil and Argentina corn production but lowered soybean production.
  • Brazil’s
    soybean crop was revised down 1.5 million tons to 124.5 million tons and Argentina soybeans taken down 2.0 million to 52.0 million tons. 
  • China
    soybean imports were taken up 1.0 million tons.  Brazil exports were raised 1.5 million tons. 
  • Global
    soybean stocks were projected down 2.0 million tons from the previous month to 338.1 million tons, 5.7 percent below 2018-19.
  • World
    corn and wheat ending stocks were taken up 5.8 and 5.6 million tons, respectively. 
  • Russian
    wheat exports were reduced by 1.5 million tons, which was partially offset by a slight upward revision to EU wheat exports. 


Weather

MARKET
WEATHER MENTALITY FOR CORN AND SOYBEANS:
 

Some
temporary relief from dryness occurred in some Safrinha crop areas in Brazil earlier this week and the region will continue to be closely monitored over the next few weeks for signs of dryness and crop stress. World Weather, Inc. anticipates at least a part
of the production region will struggle with dryness in May during reproduction, but it is unclear how widespread that will be. Some new production forecasts will be released from Brazil today and the impact of drought in Rio Grande do Sul will be further enlightened.

            Argentina
crop areas will experience net drying for a while, but crops will be fine during much of the period. A few areas may become a little dry, but it is late enough in the growing season to limit the impact on production.

            South
Africa late season crop development will remain favorable and recent rain in eastern Australia along with that expected late this week will maintain better pre-planting soil conditions for canola. More rain will be needed throughout all of southern Australia
this month to more favorably moisten the soil for aggressive early season planting.

            India
weather remains very good for late season crop maturation and early harvest progress.

            Europe’s
recent cold has not seriously hurt rapeseed. Warming under way now will accelerate a decrease in soil moisture and raise the need for rain. However, aggressive spring planting will begin while soil moisture is still marginally favorable and rain is absent.
Soil temperatures are rising quickly.

            U.S.
planting conditions may improve for another day in areas that are not bothered with wet soil or rainfall, but cooling is under way and a weekend storm system promises precipitation for nearly all areas. Field progress will advance most significantly from the
lower Delta to northern Florida, Georgia and South Carolina today and into Friday and then rain this weekend will shut everything down again. South Texas rainfall recently has improved sorghum and corn conditions, but more is needed especially in the far south
of Texas. Precipitation periodically in the eastern Midwest and developing cool weather this weekend into next week will limit fieldwork.

            China
is cooling down briefly which may slow the prospects for spring planting, but rapeseed development in key production areas will advance favorably.

            Oilseeds
in Philippines are still struggling with dryness and significant rain is needed for its coconut and oil palm crops.

            Overall,
weather today may have a mixed influence on market mentality.

Source:
World Weather Inc. and FI


MARKET
WEATHER MENTALITY FOR WHEAT:

Concern
in the market place may continue today over a broad based drying trend in Europe and limited soil moisture in Romania, southwestern Ukraine, Kazakhstan and eastern parts of Russia’s Southern Region. However, a burst in spring planting is expected in Europe
because of warm and dry conditions. It will not be long before complaints about poor emergence conditions will evolve because of dryness.

China
wheat development will advance a little faster briefly because of warmer weather, but expected cooling will slow things down a bit for a while. India’s harvest will begin to increase. Australia’s recent rain in New South Wales and that expected through Thursday
will be good for lifting topsoil moisture, but follow up rain must occur prior to the planting season late this month. All of the remaining crop areas in southern Australia still need a general soaking of rain before planting begins in late April and May.

            U.S.
weather will trend cooler today, but will cool down more significantly during the late week and weekend and early next week with frost and freezes likely next week deep into the Plains and eventually across the Midwest. Permanent crop damaging conditions are
unlikely, but some vegetative development in the Plains may get burned back by frost and freezes.

            North
Africa wheat is still rated favorably in Tunisia and northeastern Algeria and the same is true in Spain. Morocco crop production is still expected to be down for the year because of persistent dryness.

            Wheat
in the Middle East will be frequent in eastern Turkey in much of Iran and parts of Afghanistan. Some of these areas need to start drying out to protect grain quality.

            Overall,
weather today is expected to have a mixed influence on market mentality with a bullish bias.

Source:
World Weather Inc. and FI


Seven-day
outlook:


Bloomberg
Ag Calendar

THURSDAY,
April 9:

  • USDA’s
    monthly World Agricultural Supply and Demand (Wasde) report, noon
  • China
    agriculture outlook committee (CASDE) to publish monthly supply/demand forecast for soybean, corn, cotton and sugar
  • USDA
    weekly crop net-export sales for corn, soybeans, wheat, cotton, 8:30am
  • Port
    of Rouen data on French grain exports
  • Brazil
    crop agency Conab posts 7th report on 2019-20 soy, grains output

FRIDAY,
April 10:

  • ICE
    Futures Europe weekly commitments of traders report on coffee, cocoa, sugar positions
  • CFTC
    commitments of traders weekly report on positions for various U.S. futures and options, 3:30pm
  • FranceAgriMer
    weekly update on crop conditions
  • Malaysian
    Palm Oil Board to release stockpiles, export and production data
  • Cargo
    surveyors AmSpec and Interetk to release Malaysia’s April 1-10 palm oil export numbers

MONDAY,
April 13:

  • USDA
    weekly corn, soybean, wheat export inspections, 11am
  • Ivory
    Coast cocoa arrivals
  • U.S.
    crop progress – corn, soybeans, cotton; winter wheat condition, 4pm
  • Easter
    Monday holiday in many countries, including Australia, U.K. and Germany

TUESDAY,
April 14:

  • China
    soybean import data
  • Vietnam
    trade data for rice, rubber and coffee
  • HOLIDAY:
    India, Bangladesh

WEDNESDAY,
April 15:

  • EIA
    U.S. weekly ethanol inventories, production, 10:30am
  • AmSpec,
    Intertek palm oil export data for April 1-15
  • FranceAgriMer
    monthly cereals balance sheet
  • New
    Zealand food prices
  • Malaysia
    CPO export tax
  • India
    monsoon forecast (tentative)

THURSDAY,
April 16:

  • USDA
    weekly crop net-export sales for corn, soybeans, wheat, cotton, 8:30am
  • Port
    of Rouen data on French grain exports
  • EARNINGS:
    Barry Callebaut half-yearly results

FRIDAY,
April 17:

  • ICE
    Futures Europe weekly commitments of traders report on coffee, cocoa, sugar positions
  • CFTC
    commitments of traders weekly report on positions for various U.S. futures and options, 3:30pm
  • FranceAgriMer
    weekly update on crop conditions

Source:
Bloomberg and FI


China
CASDE

  • China’s
    corn imports in 2019/20 were seen at 4 million tons, up 1 million from the forecast
  • China
    lowered industrial consumption of corn in 2019/20 to 82.5 million tons, down 2 million tone from the previous month
  • Revised
    an estimate for edible oils consumption in 2019/20 down by 960,000 tons, at 32.43 million tons.
  • Forecasts
    for production, consumption, and imports of soybeans remained the same as last month.
  • No
    table was provided by the newswire

Source:
Reuters and FI


Actually,
due out 4/10 (wrong date in table above)


USDA
export sales

  • US
    pork sales surged to 55,900 tons; a marketing year high. 
  • US
    sorghum export sales were also robust at 373,800 that included 186,600 tons for China.
  • US
    corn export sales were excellent at 1.849 million tons for 2019-20 and new-crop came in at 608,800 tons. 
  • All-wheat
    sales of 258,700 were again disappointing.
  • US
    2019-20 soybean export sales of 270,400 were very poor, well below expectations, and down from 957,400 tons last year.
  • Soybean
    meal sales for 2019-20 slipped below 200,000 tons to 193,300 tons but improved from the previous week.  Soybean meal shipments were ok at 273,100 tons.
  • US
    soybean oil export sales current crop-year were 24,100 tons.  Shipments were poor at 5,400 tons.


Macros

·        
USD was down 60 points by 1 pm CT. 

·        
OPEC+ agrees to historic 10 million barrel per day production cut
https://www.cnbc.com/2020/04/09/oil-jumps-ahead-of-make-or-break-opec-meeting.html?__source=iosappshare%7Ccom.apple.UIKit.activity.CopyToPasteboard

·        
US Crude Oil Futures Settle At $22.76/Bbl, Down $2.23 Or 9.29%

·        
US Initial Jobless Claims Apr 4: 6606K (exp 5500K; prevR 6867K; prev 6648K)

o  
US Continuing Claims Mar 28: 7455K (exp 8236K; prevR 3059K; prev 3029K)

·        
Covid-19 cases are about peaking around now across the US


Corn.

·        
Corn ended 1.25-2.25 cents higher in a two-sided trade.  USDA’s April report was interpreted as bearish bu bull traders returned to the market anyway.  The USD was sharply lower.  WTI closed lower in nearby
contracts after a volatile trade.  Corn found strength during the trade from their energy prices after Russia and Saudi Arabia was said to be ending a price war.  Prior to the USDA report, corn saw a two-sided trade in part to
robust USDA export sales, slowing US corn plantings and strong import demand by South Korea so far this week.

·        
After the close the USDA confirmed a case of H7N3 bird flu at a commercial farm in South Carolina. This is the first case of any bird flu kind for the US since 2017 (HAI and LPAI H7N8), and not the same strain
that killed 50 million birds in 2014 and 2015 (H5N1, H5N2 and H5N8).  The H7N3 does not infect humans that we know of. 

·        
Conab estimated the Brazil corn production at 101.9 million tons, 400,000 above a Bloomberg trade guess and 1.8 million tons above March projection. 

  • US
    pork sales surged to 55,900 tons; a marketing year high. 
  • US
    sorghum export sales were also robust at 373,800 that included 186,600 tons for China.
  • US
    corn export sales were excellent at 1.849 million tons for 2019-20 and new-crop came in at 608,800 tons. 
  • Columbia
    suspended corn, sorghum and soybean import tariffs until June 30. 

·        
Parana, Mato Grosso do Sul, Sao Paulo and Mato Grosso’s south may not see rain until April 14. 

  • Brazil
    farm lobby CAN mentioned Q1 Brazil corn exports fell 51 percent due to strong domestic demand. 

·        
Goldman Roll – third day. 


Ethanol. 
Irwin,
S. "The Competitiveness of Ethanol in E10 Gasoline Blends during the Coronavirus Crisis."
farmdoc daily (10):65,  Department of Agricultural and Consumer Economics, University of Illinois at Urbana-Champaign, April 8, 2020.
https://farmdocdaily.illinois.edu/2020/04/the-competitiveness-of-ethanol-in-e10-gasoline-blends-during-the-coronavirus-crisis.html?utm_source=farmdoc+daily+and+Farm+Policy+News+Updates&utm_campaign=6eb0e8cd21-FDD_RSS_EMAIL_CAMPAIGN&utm_medium=email&utm_term=0_2caf2f9764-6eb0e8cd21-173649469


Corn
Export Developments

  • Algeria
    bought 40,000 tons of corn from Argentina for FH May shipment at near $194 to $195/ton c&f. 
  • South
    Korea’s KOCOPIA bought about 60,000 tons of corn from Brazil at an estimated $196.50 a ton c&f for arrival in South Korea in August.
  • Syria
    seeks 50,000 tons of soybean meal in a combo with 50,000 tons of corn on May 12.


Updated
4/9/
20


Soybean
complex

·        
The Board crush ended 6.25 and 7.00 cents lower at 82.50 and 89.25 cents, May and July positions, respectively. 

·        
Conab estimated the Brazil soybean production at 122.1 million tons, 1.0 million tons below a Bloomberg trade guess and down 2.1 million tons from its March projection. 

·        
Safras & Mercado estimated Brazil April soybean exports at 13.5 million tons, above 13.3 million tons during March. 

  • US
    2019-20 soybean export sales of 270,400 were very poor, well below expectations, and down from 957,400 tons last year.
  • US
    soybean meal export sales for 2019-20 slipped below 200,000 tons to 193,300 tons but improved from the previous week.  Soybean meal shipments were ok at 273,100 tons.
  • US
    soybean oil export sales current crop-year were 24,100 tons.  Shipments were poor at 5,400 tons.

·        
China was back in buying Brazilian soybeans. We heard 4-5 cargoes traded on Wednesday.  We heard they were in for 6-8 US PNW cargoes, and again maybe today, but didn’t see any confirmation in 24-hour announcements. 

·        
China cash crush margins as of this morning, using our calculation, were 211 cents per bushel (207 previous session) and compares to 207 cents a week ago and negative 62 cents around this time last year. 

·        
Argentina truck arrivals to crush plants and ports are back to normal near 6,000 per day. 

  • Water
    levels for Argentina’s Parana River are at a 11-year low, limiting the amount of grain and oilseed shipments. 

·        
Analysts James Fry sees another leg down in Malaysian palm prices due to slow demand and will remain very weak during 2020.


Oilseeds
Export Developments

  • Syria
    seeks 50,000 tons of soybean meal in a combo with 50,000 tons of corn on May 12.


Updated
4/9/20


Wheat

  • US
    HRW wheat growing areas will see well below average temperatures late this weekend through nearly a week.  Frosts, freezes and snow will occur.  It could get as low as the 20’s in the southern areas and teens in the north.  Snow in the north will help protect
    the crop but the southern areas may see burn back. 

Source:
World Weather Inc. and FI

  • All-wheat
    US export sales of 258,700 were again disappointing.
  • Romania
    will ban wheat and grain exports to non-EU countries until mid-May. 
  • Egypt
    plans to buy 3.6 million tons of local wheat, enough to cover 4.5 months of local needs.  That should increase wheat reserves to over 10 months after they secure another 800,000 tons of wheat imports during their harvest season, which was announced Thursday. 
    Egypt harvests wheat from early May to early June.
  • Paris
    May milling wheat futures settled 0.75 euros higher at 197.75 euros a ton.
  • Indonesia
    consumed 1.71 million tons of wheat flour in the first quarter of 2020, up 2.2% from a year earlier (Indonesian Flour Mills Association via Reuters).  This is the equivalent to 2.19 million tons of wheat grain.  In 2019 they consumed 6.63 million tons of wheat
    flour or 8.5 million tons of grain.
  • The
    Russian Agriculture Ministry left its 2020 grain production estimate unchanged at 125.3 million tons compared to 121.2 million tons in 2019.
  • Ukraine’s
    government asked the parliament to remove existing import duties for rice, rye, oats, buckwheat and millet to ensure domestic market with sufficient supplies.  Ukraine’s grain exports reached 47 million tons so far in 2019-20, up 21 percent from the previous
    year.  This includes 18.1 million tons of wheat and 24 million tons of corn. 


Export
Developments.

  • Saudi
    Arabia is in for another 600,000 tons of barley on April 10 for July-August shipment. 
  • Japan
    bought 128,760 tons of food wheat from the US and Australia.  Original details of the tender:

  • Lebanon
    maybe in soon for wheat.
  • Turkey
    seeks 250,000 tons of wheat on April 10 for April 20 and May 15 shipment, optional origin. 
  • Ethiopia
    postponed their import tender for 400,000 tons of wheat until April 23.  They are in for 200,000 tons on April 15 in a separate tender. 


Rice/Other


Updated 4/9/20

  • May Chicago $5.25 and $5.70 range.  July (new-crop) $5.00-$5.75. 
  • May KC $4.65 and $5.05 range.  July $4.50-$5.80
  • May MN $5.20 and $5.45 range.  July $5.25-$5.55. 


U.S. EXPORT SALES FOR WEEK ENDING 4/2/2020


CURRENT MARKETING YEAR

NEXT MARKETING YEAR

COMMODITY

NET SALES

OUTSTANDING SALES

WEEKLY EXPORTS

ACCUMULATED EXPORTS

NET SALES

OUTSTANDING SALES

CURRENT YEAR

YEAR
AGO

CURRENT YEAR

YEAR
AGO


THOUSAND METRIC TONS

WHEAT


   HRW    

113.6

1,702.9

2,432.9

222.8

7,715.0

6,271.4

38.9

561.3

   SRW    

20.0

288.4

893.6

10.7

2,070.9

2,404.4

11.1

189.5

   HRS     

103.9

1,566.6

1,342.1

74.8

5,785.0

5,475.5

12.9

253.8

   WHITE   

32.2

1,112.2

1,043.6

68.5

3,898.8

4,251.0

54.5

113.5

   DURUM  

-11.1

216.3

83.5

3.0

685.3

398.6

0.0

151.0

     TOTAL

258.6

4,886.3

5,795.8

380.0

20,155.1

18,800.9

117.4

1,269.1

BARLEY

0.2

10.8

23.5

0.1

38.8

35.9

0.0

31.0

CORN

1,848.9

14,159.5

12,719.3

1,290.3

19,596.9

31,024.0

608.8

2,369.8

SORGHUM

373.8

1,621.3

258.1

8.2

1,425.3

777.3

0.0

33.0

SOYBEANS

523.5

5,263.4

13,016.5

362.0

32,121.5

30,830.4

353.4

882.3

SOY MEAL

193.3

2,771.8

3,200.4

273.1

6,208.4

6,272.3

0.0

101.0

SOY OIL

25.1

306.0

174.8

5.4

618.0

443.7

0.0

4.9

RICE


   L G RGH

25.0

300.8

304.6

52.5

1,031.5

816.4

0.0

0.0

   M S RGH

0.0

43.7

47.4

0.7

25.6

38.7

0.0

0.0

   L G BRN

0.1

16.4

6.0

4.4

41.1

29.6

0.0

0.0

   M&S BR

0.1

61.5

57.3

1.7

46.9

84.2

0.0

0.0

   L G MLD

1.6

70.6

111.9

24.9

685.8

592.0

0.0

0.0

   M S MLD

16.9

267.3

201.5

4.6

409.9

358.2

0.0

0.0

     TOTAL

43.7

760.2

728.7

88.9

2,240.8

1,919.1

0.0

0.0

COTTON


THOUSAND RUNNING BALES      

   UPLAND

-5.2

6,173.3

5,656.4

486.6

9,113.9

7,520.3

107.4

2,113.9

   PIMA

1.8

179.8

258.3

33.4

361.8

403.1

0.0

35.3


Export Sales Highlights 

This summary is based on reports from exporters for the period March 27-April 2, 2020.

Wheat:  Net sales of 258,600 metric tons for 2019/2020 were up noticeably from the previous week, but down 36 percent from the prior 4-week average. 
Increases primarily for Taiwan (98,300 MT), Mexico (84,300 MT, including decreases of 1,600 MT), Nigeria (66,000 MT, including 74,500 MT switched from unknown destinations and decreases of 11,000 MT), Italy (48,300 MT, including 21,000 MT switched from unknown
destinations), and Guatemala (38,300 MT, including 36,100 MT switched from unknown destinations and decreases of 700 MT), were offset by reductions primarily for unknown destinations (163,800 MT).  For 2020/2021, net sales of 117,400 MT were primarily for
the Philippines (54,500 MT), Chile (35,000 MT), and unknown destinations (16,500 MT).  Exports of 380,000 MT were up 39 percent from the previous week and 1 percent from the prior 4-week average.  The destinations were primarily to Nigeria (77,000 MT), Japan
(70,000 MT), Indonesia (55,200 MT), Mexico (51,200 MT), and Guatemala (40,600 MT). 

Corn:  Net sales of 1,848,900 MT for 2019/2020–a marketing-year high–were up 72 percent from the previous week and 41 percent
from the prior 4-week average.  Increases primarily for Japan (702,600 MT, including 130,800 MT switched from unknown destinations and decreases of 6,500 MT), South Korea (331,900 MT, including 86,000 MT switched from unknown destinations and decreases of
4,300 MT), Mexico (179,600 MT, including decreases of 1,700 MT), Saudi Arabia (139,100 MT, including 135,000 MT switched from unknown destinations), and Israel (65,000 MT), were offset by reductions for Nicaragua (200 MT).  For 2020/2021, net sales of 608,800
MT were for China (504,000 MT), Mexico (99,5000 MT), unknown destinations (4,000 MT), and Guatemala (1,300 MT).  Exports of 1,290,300 MT–a marketing-year high–were up 3 percent from the previous week and 31 percent from the prior 4-week average.  The destinations
were primarily to Japan (377,800 MT), Mexico (315,300 MT), South Korea (154,000 MT), Saudi Arabia (139,100 MT), and Taiwan (77,900 MT). 

Optional Origin Sales:  For 2019/2020, the current outstanding balance of 581,000 MT is for South Korea (521,000 MT) and Israel (60,000 MT).

Barley: Net sales of 200 MT for 2019/2020 were reported for South Korea.  Exports of 100 MT–a marketing-year low–were down 86 percent from the previous week and 90 percent from the prior 4-week
average.  The destination was Taiwan.

Sorghum:  Net sales of 373,800 MT for 2019/2020 were primarily for unknown destinations (187,000 MT) and China (186,000 MT).  Exports of 8,200 MT were primarily to Japan (7,600 MT). 

Rice:  Net sales of 43,700 MT for 2019/2020 were down 36 percent from the previous week and 25 percent from the prior 4-week average.  Increases primarily
for Honduras (25,600 MT, including 500 switched from Guatemala and decreases of 500 MT), Japan (12,300 MT), Jordan (3,000 MT), Canada (1,400 MT), and Mexico (1,300 MT, including decreases of 100 MT), were offset by reductions for Guatemala (1,500 MT) and Colombia
(1,400 MT). 
Exports of 88,900 MT were up 57 percent from the previous week and 68 percent from the prior 4-week average.  The destinations were primarily to Mexico (33,700 MT), Honduras (17,100 MT), Haiti (15,200
MT), Guatemala (7,800 MT), and Saudi Arabia (5,300 MT).

Soybeans:  Net sales of 523,500 MT for 2019/2020 were down 45 percent from the previous week and 25 percent from the prior 4-week average.  Increases primarily
for China (143,500 MT), Mexico (102,700 MT, including decreases of 1,500 MT), Egypt (91,800 MT, including 40,000 MT switched from unknown destinations and decreases of 200 MT), Japan (61,900 MT, including 17,800 MT switched from unknown destinations and decreases
of 100 MT), and South Korea (26,300 MT, including 25,000 MT switched from unknown destinations), were offset by reductions for the Dominican Republic (400 MT).  For 2020/2021, net sales of 353,400 MT were for Mexico (285,000 MT), China (66,000 MT), and Japan
(2,400 MT).  Exports of 362,000 MT–a marketing-year low–were down 23 percent from the previous week and 32 percent from the prior 4-week average.  The destinations were primarily to Egypt (108,800 MT), Mexico (90,000 MT), Japan (39,100 MT), South Korea (27,000
MT), and Indonesia (26,100 MT). 

Exports for Own Account:  For 2019/2020, the current exports for own account outstanding balance is 2,100 MT, all Canada.

Soybean Cake and Meal:  Net sales of 193,300 MT for 2019/2020 were up 55 percent from the previous week and 23 percent from the prior 4-week average.  Increases primarily for Canada (54,300 MT),
Guatemala (52,100 MT, including 5,000 MT switched from El Salvador and decreases of 1,000 MT), Mexico (20,700 MT), Morocco (17,000 MT), and the Dominican Republic (16,700 MT), were offset by reductions for El Salvador (5,000 MT), Colombia (2,200 MT), and Ecuador
(1,300 MT).  Exports of 273,100 MT were down 16 percent from the previous week, and 9 percent from the prior 4-week average.  The destinations were primarily to Mexico (49,100 MT), the Philippines (44,600 MT), Canada (42,300 MT), Colombia (36,900 MT), and
Ecuador (21,800 MT).

Soybean Oil:  Net sales of 25,100 MT for 2019/2020 were primarily for Venezuela (7,000 MT), the Dominican Republic (6,500 MT, including decreases of 500 MT), Guatemala (5,000 MT), South Korea
(3,000 MT), and Colombia (2,300 MT).  Exports of 5,400 MT were primarily to Mexico (4,300 MT) and Canada (600 MT). 

Cotton:  Net sales reductions of 5,200 RB for 2019/2020–a marketing-year low–were down
noticeably from the previous week and from the prior 4-week average.  Increases for Bangladesh (90,800 RB, including decreases of 11,700 RB), Vietnam (38,100 RB, including 4,500 RB switched from Indonesia, 3,800 RB switched from South Korea, 400 RB switched
from Taiwan, and decreases of 7,200 RB), Turkey (7,700 RB, including decreases of 100 RB), Taiwan (3,500 RB, including 900 RB switched from Vietnam), and Ethiopia (800 RB), were more than offset by reductions primarily for China (101,000 RB), Indonesia (19,400
RB), Pakistan (11,300 RB), South Korea (7,400 RB), and Thailand (3,800 RB).  For 2020/2021, net sales of 107,400 RB were primarily for Indonesia (23,100 RB), China (21,100 RB), Turkey (17,200 RB), El Salvador (14,900 RB), and Bangladesh (11,600 RB).  Exports
of 486,600 RB–a marketing-year high–were up 21 percent from the previous week and 23 percent from the prior 4-week average.  Exports were primarily to Vietnam (116,000 RB), Turkey (88,400 RB), Pakistan (72,700 RB), China (64,600 RB), and Indonesia (52,400
RB).  Net sales of Pima totaling 1,800 RB were up noticeably from the previous week, but down 87 percent from the prior 4-week average.  Increases for China (2,800 RB, including 2,600 RB switched from Hong Kong) and Turkey (1,700 RB), were offset by reductions
primarily for Hong Kong (2,600 RB).  Exports of 33,400 RB–a marketing-year high–were up 40 percent from the previous week and 86 percent from the prior 4-week average.  The primary destinations were primarily to China (13,900 RB), India (7,300 RB), Vietnam
(3,000 RB), Pakistan (2,900 RB), and Bangladesh (2,000 RB).   

Exports for Own Account:  For 2019/2020, new exports for own account totaling 100 RB were to Vietnam.  Exports for own
account totaling 2,200 RB to Indonesia (2,100 RB) and Vietnam (100 RB) were applied to new or outstanding sales.  Decreases were reported for Indonesia (100 RB).  The current exports for own account outstanding balance of 28,800 RB is for Indonesia (17,200
RB), Bangladesh (6,500 RB), China (2,500 RB), India (1,700 RB), Malaysia (400 RB), Vietnam (300 RB), and Pakistan (200 RB).

Export Adjustment: Accumulated exports of pima cotton to Turkey were adjusted down 170 MT for week ending December 26th.  The exports were reported
in error.

Hides and Skins:
Net sales of 858,800 pieces for 2020 were up 39 percent from the previous week and 86 percent from the prior 4-week average.  Increases primarily for China (773,600 whole cattle hides, including decreases of 9,400 pieces), Mexico (43,000 whole cattle hides,
including decreases of 500 pieces), Thailand (16,800 whole cattle hides, including decreases of 700 pieces), Taiwan (8,100 whole cattle hides, including 7,200 pieces switched from China and decreases of 1,700 pieces), and Japan (7,200 whole cattle hides, including
decreases of 100 pieces), were offset by reductions for Indonesia (1,300 whole cattle hides).  Additionally, there were net sales reductions reported for Belgium (100 kip skins).  Exports of 402,100 pieces reported for 2020 were up 9 percent from the previous
week and 13 percent from the prior 4-week average.  Whole cattle hide exports were primarily to China (245,300 pieces), Thailand (45,400 pieces), South Korea (37,200 pieces), Mexico (21,600 pieces), and Indonesia (18,100 pieces).  In addition, there were exports
to Belgium (5,500 kip skins). 

Net sales of 129,300 wet blues
for 2020 were up noticeably from the previous week and up 46 percent from the prior 4-week average, all wet blues for Italy (117,900 unsplit), Vietnam (8,700 unsplit), China (6,600 unsplit), and Thailand (900 unsplit), were offset by reductions for Taiwan
(4,800 unsplit).  Exports of 118,700 wet blues for 2020 were down 23 percent from the previous week and 16 percent from the prior 4-week average.  The destinations were primarily to Italy (63,200 unsplit), China (30,500 unsplit and 4,400 grain splits), Thailand
(11,500 unsplit), Brazil (4,400 grain splits), and India (2,400 unsplit).  Net sales of 185,100 splits were for Vietnam (174,300 pounds) and China (10,800 pounds).  Exports of 447,300 pounds were to Vietnam.


Beef:
Net sales of 15,800 MT reported for 2020 were down 13 percent from the previous week and 12 percent from the prior 4-week average.  Increases were primarily for South Korea (5,500 MT, including
decreases of 300 MT), Japan (4,100 MT, including decreases of 600 MT), Hong Kong (3,300 MT, including decreases of 200 MT), Taiwan (1,200 MT, including decreases of 100 MT), and Canada (600 MT, including decreases of 300 MT).  Exports of 17,700 MT were up
4 percent from the previous week and 6 percent from the prior 4-week average.  The destinations were primarily to Japan (7,100 MT), South Korea (4,600 MT), Canada (1,300 MT), Taiwan (1,300 MT), and Mexico (1,200 MT).

Pork:
Net sales of 55,900 MT reported for 2020–a marketing-year high–were up 47 percent from the previous week and up noticeably from the prior 4-week average.  Increases primarily for China (38,700 MT), Mexico (6,600 MT), Japan (3,900
MT), South Korea (2,300 MT), and Australia (2,300 MT), were offset by reductions for Canada (900 MT) and Nicaragua (400 MT).  Exports of 38,300 MT were down 5 percent from the previous week and 13 percent from the prior 4-week average.  The destinations were
primarily to China (16,300 MT), Mexico (8,500 MT), Japan (4,900 MT), South Korea (2,700 MT), and Canada (2,200 MT).

April 9, 2020                                                      1                                       FOREIGN AGRICULTURAL SERVICE/USDA


                                                                                                SUMMARY OF EXPORT TRANSACTIONS
                                                                                 REPORTED UNDER THE DAILY SALES REPORTING SYSTEM
                                                                                                FOR PERIOD ENDING APRIL 2, 2020 

COMMODITY                                            
DESTINATION                                            QUANITY (MT) 
                          MARKETING YEAR

CORN                                                           CHINA                                                            63,000 MT 1/                               2019/2020

CORN                                                           CHINA                                                          504,000 MT 1/                               2020/2021

CORN                                                           JAPAN                                                           113,000 MT 1/                              2019/2020

SOYBEANS                                                  MEXICO                                                       285,000 MT 1/                              2020/2021


1/ Export sales.


Terry Reilly

Senior Commodity Analyst – Grain and Oilseeds

Futures International │190 S LaSalle St., Suite 410│Chicago, IL  60603

W: 312.604.1366

treilly@futures-int.com

AIM: fi_treilly

ICE IM: 
treilly1

Skype: fi.treilly


Description: Description: Description: Description: FImail


Trading of futures, options, swaps and other derivatives is risky and is not suitable for all persons.  All of these investment products are leveraged, and you can lose more than your initial deposit.  Each investment product is offered
only to and from jurisdictions where solicitation and sale are lawful, and in accordance with applicable laws and regulations in such jurisdiction.  The information provided here should not be relied upon as a substitute for independent research before making
your investment decisions.  Futures International, LLC is merely providing this information for your general information and the information does not take into account any particular individual’s investment objectives, financial situation, or needs.  All investors
should obtain advice based on their unique situation before making any investment decision.  The contents of this communication and any attachments are for informational purposes only and under no circumstances should they be construed as an offer to buy or
sell, or a solicitation to buy or sell any future, option, swap or other derivative.  The sources for the information and any opinions in this communication are believed to be reliable, but Futures International, LLC does not warrant or guarantee the accuracy
of such information or opinions.  Futures International, LLC and its principals and employees may take positions different from any positions described in this communication.  Past results are not necessarily indicative of future results.


This email, any information contained herein and any files transmitted with it (collectively, the Material) are the sole property of OTC Global Holdings LP and its affiliates (OTCGH); are confidential, may be legally privileged and are intended solely for
the use of the individual or entity to whom they are addressed. Unauthorized disclosure, copying or distribution of the Material, is strictly prohibited and the recipient shall not redistribute the Material in any form to a third party. Please notify the sender
immediately by email if you have received this email by mistake, delete this email from your system and destroy any hard copies. OTCGH waives no privilege or confidentiality due to any mistaken transmission of this email.