From: Terry Reilly
Sent: Saturday, June 23, 2018 9:38:01 AM (UTC-06:00) Central Time (US & Canada)
Subject: FI Evening Grain Comments 06/22/18
PDF attached
- Flooding across the central US is underpinning grain/oilseed basis by affecting transportation. Heavier rain is on the way for the central Great Plains. SEE PDF for map
- US corn and soybean conditions may end up near unchanged when updated Monday. Spring wheat unchanged to down 2 and winter wheat unchanged.
- US ridge for later next week may be short in time and pose no threat to the US crops. Ample soil moisture may generate precipitation when is shifts west.
- The central U.S. Plains hard red winter wheat areas will receive more heavy rainfall today and again Sunday into Monday. Too much rain across US hard red winter wheat country is starting to raise concern for unharvested winter wheat. This is also starting to raise concerns for the summer crops across the Midwest.
- A high-pressure ridge will develop across Western Europe this weekend into next week, resulting in net drying for the UK and Germany.
- The western CIS will see an improvement in rainfall. Note hot temperatures will occur in the lower Volga River Basin and areas east into Kazakhstan during much of the next week to ten days.
- Parts of China will see hot temperatures.
- Australia’s weather will improve slightly in the west bias south. Queensland and northern New South Wales will remain mostly dry through the end of the month but coastal areas should get rain sometime through June 29.
Source: World Weather Inc. and FI

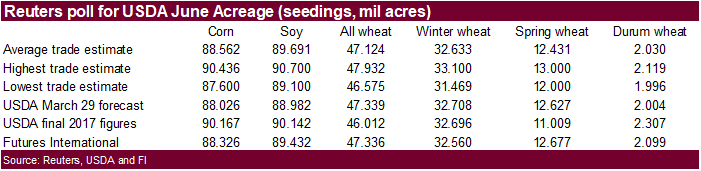
*ALL WHEAT TRADE AVERAGE LIKELY REVISED LOWER AFTER 3 ERRORS WERE DISCOVERED
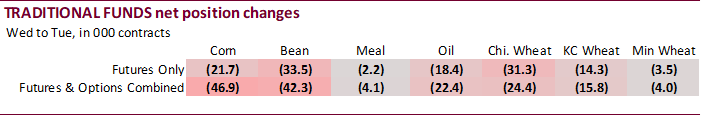
· Funds in corn futures only were net long 264,900 contracts, only off 21,700 contracts from the previous week.
· Corn open interest increased 28,900 for futures and a large 69,600 for futures and options combined.
· Funds futures only in soybeans sold off 33,500 contracts and in meal they sold only 2,200 contracts.
· The largest changes this week were money managers reducing their net long positions in corn.
· A new record was established for managed money futures and option combined in soybean oil with a net short position of 93,139 contracts (last week was the previous record. The futures only managed money net short position was also a record at 91,640 contracts, topping the previous record of 72,465 contracts as of 5/1/18.
· The funds position is perceived as bullish corn as large specs hung onto long positions even after soybean futures fell sharply.


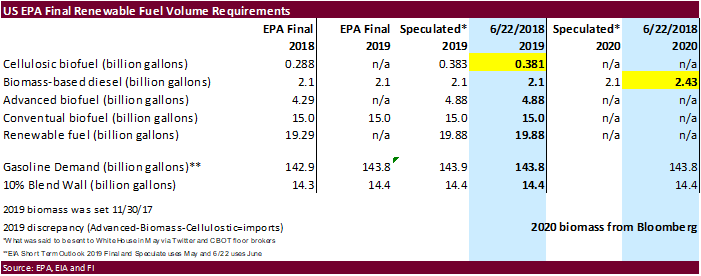
EPA 2019 proposed targets set: 19.88 billion gallons. 4.88 billion advanced, 15-billion conventional and 381 cellulosic. Formal announcement may be out later today.
· OPEC Ministers Agree In Principle On 1 Mln BPD Nominal Output Increase For OPEC, Non-OPEC – RTRS Source
· OPEC Agreement In Principle Is Said For 600k BPD Real Increase
· Saudi Energy Minister Khalid Al-Falih over the weekend said it will be closer to 1 million barrels per day.
· Canada CPI May NSA M/M: 0.1% (est 0.4% prev 0.3%)
· Canada CPI May Y/Y: 2.2% (est 2.6% prev 2.2%)
· Canada Retail Sales April M/M: -1.2% (est 0.0% prev R 0.8%)
· Canada Retail Sales Ex Auto April M/M: -0.1% (est 0.5% prev -0.2%)
· Canada CPI Index: 133.4 (est 133.9 prev 133.3)
– -CPI Core; Common Y/Y%: 1.9% (est 1.9% prev 1.9%)
– -CPI Core; Median Y.Y%: 1.9% (est 2.1% prev R 1.9%)
– -CPI Core; Trim Y/Y: % 1.9 (est 2.1% prev 2.1%)
Corn.
- July corn fell for the fourth consecutive week, in large part to large US corn crop prospects and China/US trade tensions.
- Corn ended mixed on Friday. Wheat was lower and soybeans ended higher. WTI crude oil ended more than $3.00 higher.
- The latest CFTC report and surprisingly high May China import figure for corn, sorghum and pork imports may provide some support to CBOT corn Sunday evening.
- Funds sold an estimated net 4,000 corn contracts, according to Reuters.
- USDA reported a combined 248.3 thousand of corn to Mexico and Panama.
- We are picking up the Trump administration plans to push aside a plan to require large refiners to use more biofuel from waivers granted to smaller refiners. It was proposed about 1.5 billion gallons of additional biofuel requirements were to be shifted into 2019.
- EPA 2019 proposed targets set: 19.88 billion gallons. 4.88 billion advanced, 15-billion conventional and 381 cellulosic. We are awaiting the formal announcement.
- We look for USDA on Friday to report the June US corn planted area at 88.326 million acres (300,000 acres above USDA March), below an average trade guess of 88.562 million (536,000 acres above USDA).
- Combining the average trade guesses for US corn, soybean, wheat, cotton, sorghum, barley, oats and rice area, the trade looks for 1.426 million acre increase from March (subject to revision). We are looking for this combined area to increase 0.869 million. We are looking for USDA to decrease the all-wheat area by 3,000 acres, and the trade looks for all-wheat to decrease 215,000 acres (trade average for all-wheat subject for revision).
- FI looks for the June 1 US corn stocks to end up at 5.220 billion bushels, 48 million below a Reuters trade guess and 9 million below a year ago.
- French corn conditions as of June 18 were down 2 points to 72 percent from the previous week.
- China updated their May trade data.
- Corn imports +1684% y/y to 760,000 tons
- Sorghum imports +59% y/y to 470,000 tons and down from 640,000 tons in April.
- The China sorghum imports of 470,000 tons were a surprise after the country increase import tariffs to 178.6 percent, only to lift them May 18, and several US cargos were thought to be already diverted.
- China also imported 115,322 tons of pork in May, down 3.6 percent from the previous year, despite a 25 percent tariff placed on April 2.
- Reuters noted Brazil grain handles have been out of the market for three weeks. This could temporally boost US corn exports if importers switch to US origin.
- South Africa’s CEC will update its corn crop estimate on Wednesday and traders are looking for 12.991 million tons, slightly above 12.909 million reported in May and compares to 16.82 million tons in 2017. Breakdown of a Reuters survey put white corn at 6.768 million tons and yellow at 6.223 million tons.
- Some rivers are flooding in IA, SD and MN due to heavy rainfall.
- The November/December soybean/corn ratio was sitting near a contract low on Thursday.
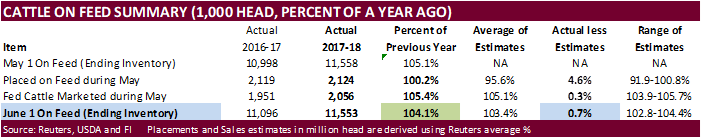
The USDA Cattle on Feed report showed June 1 COF at 104.1 percent, seven tenths of a percent above traders’ expectations. Placements were much higher than expected and marketing were in line with a Reuters trade average.
The USDA Chicken and Eggs report showed May egg production up 2 percent, egg-type chicks hatched up 12 percent and chicks hatched up 2 percent.
- USDA 24-hour announcements:
- Export sales of 131,300 metric tons of corn for delivery to Mexico. Of the total 30,000 metric tons is for delivery during the 2017/2018 marketing year and 101,300 metric tons is for delivery during the 2018/2019 marketing year; and
- Export sales of 117,000 metric tons of corn for delivery to Panama during the 2018/2019 marketing year.
- China sold 739.9 thousand tons of corn from state reserves or 18.6 percent of what was offered at an average price of 1403 yuan per ton ($215.78/ton). China sold an estimated 46.9 million tons of corn out of reserves since April 12.
- Brazil looks to sell corn out of reserves soon.
· The soybean complex ended higher on Friday from bottom picking. Soybeans ended the week lower, for the fourth consecutive week. July was up 14.0 cents, August up 14.50 cents, and November up 14.75 cents. Soybean meal ended $6.40-$7.30 higher. Soybean oil finished only 3-16 points higher. Old/new-crop spreads were active (bear spreading). The moderately higher close in soybean oil disappointed some traders after WTI ended more than $3.00/barrel higher on Friday. If meal and soybeans continue to rebound, we like owning soybean oil.
· Funds bought 12,000 soybeans, bought 7,000 soybean meal, and bought 3,000 soybean oil.
- We look for USDA on Friday to report the June US soybean planted area at 89.432 million acres (450,000 acres above USDA March), below an average trade guess of 89.691 million (709,000 acres above USDA).
- FI looks for the June 1 US soybean stocks to end up at 1.280 billion bushels, 55 million above a Reuters trade guess and 314 million above a year ago.
- CBOT prices tend to have a strong reaction from the stocks and Acreage reports. Post reports, look for traders to shift their focus back on weather and July 6 tariff increases.
- Brazil soybean premiums finally eased on Friday, but not by much. Brazil soybeans are still more than $30/ton higher than US. Brazil August soybeans for export at the end of the workweek were down 5 cents to 155/170 over, and September down 5/unchanged to 165/180 over. October was 160/200.
- US Gulf soybeans were up 3-4 cents. August was quoted at 55/60 over and September 46/50 over. Flooding across the Midwest are raising concerns.
- Safras looks for Brazil soybean exports to reach 76 million tons.
- Argentina’s two main crushing unions are planning a strike on June 25, in part to speculation the government will increase grain & oilseed export taxes.
- China updated their May trade data and palm oil imports were up 45 percent from a year ago to 260,000 tons.
Export Developments
· China sold 40% of soybean oil offered out of auction. 19,816 tons were sold out of 60,000 tons offered. Average price was 5001 yuan per ton. Base price was 5,000 yuan per ton.
· China plans to offer to sell 500,000 tons of soybeans and 50,000 tons of soybean oil from state reserves on June 27. China sold 270,106 tons of soybeans out of reserves so far this season.
- Iran seeks 30,000 tons of sunflower oil on July 10.
- Iran seeks 30,000 tons of palm olein oils on July 10.
- Iran seeks 30,000 tons of soybean oil on August 1.
- US wheat futures ended lower on light profit taking from the 2-day mid-week rally.
- Funds in Chicago were sellers of an estimated net 2,000 SRW wheat futures, according to Reuters.
- On June 29, we look for USDA to increase the spring wheat planted area by 50 million acres but the trade is looking for a 196,000 acre decrease. Our winter wheat planted area is 148,000 below USDA and we see durum seedings increasing 95,000 acres. The trade is looking for winter wheat to decline 75,000 acre and durum to increase 26,000 acres. Our all-wheat planted area of 47.336 million acres is 3,000 acres below USDA March.
- June 1 US all-wheat stocks are estimated at 1.087 million acres, 4 million below an average trade guess, and 94 million below a year ago.
- Plains Grains Inc., who conducts yearly surveys of the US HRW wheat crop across TX, OK, and southern KS, said the first 105 samples average 12.6 percent for protein, up from 12.4 percent a week earlier and well above the 2017 average of 11.4 percent. The average test weight was 60.9 pounds per bushel, compared with the 2017 average of 60.8 pounds. Full report, see: https://bit.ly/2JZZz8J (Reuters)
- French soft wheat conditions as of June 18 were down 1 point to 75 percent from the previous week. Winter barley was down one to 73 and spring down unchanged at 77.
- Russia’s AgMin sees the 2018 grain crop at 100 million tons. SovEcon and IKAR are at 119.6 million tons and 114.7 million tons, respectively. 2017 grain production according to USDA was 134.9 million tons. This year the Russia AgMin noted some regions started harvesting 20 days earlier than a year ago due to dry weather.
- Ukraine’s AgMin forecast the 2018 harvest between 23 and 26 million tons for wheat with an exportable surplus at about 17.2 million tons in the 2018/19 season. Ukraine consumption was estimated at 4.7 million tons of milling wheat in the 2018/19 season. Ukraine harvested 26.2 million tons of wheat in 2017 and exported 17.3 million tons in the 2017/18 July-June season. (Reuters)
- Ukraine harvested 1.1 million tons of grain so far with an average yield of 3.16 tons/hectare.
- Ukraine will produce enough good quality wheat for domestic consumption this year.
- China updated their May trade data.
- Wheat imports +24.8% y/y to 630,000 tons
- Rice imports -2.7% y/y to 480,000 tons
- Barley imports +23.3% y/y to 770,000 tons
- Sugar imports +7.9% y/y to 200,000 tons
- Cotton imports +54.2% y/y to 130,000 tons
See the PDF for more commentary and graphs
Terry Reilly
Senior Commodity Analyst – Grain and Oilseeds
Futures International │190 S LaSalle St., Suite 410│Chicago, IL 60603
W: 312.604.1366
AIM: fi_treilly
ICE IM: treilly1
Skype: fi.treilly

Trading of futures, options, swaps and other derivatives is risky and is not suitable for all persons. All of these investment products are leveraged, and you can lose more than your initial deposit. Each investment product is offered only to and from jurisdictions where solicitation and sale are lawful, and in accordance with applicable laws and regulations in such jurisdiction. The information provided here should not be relied upon as a substitute for independent research before making your investment decisions. Futures International, LLC is merely providing this information for your general information and the information does not take into account any particular individual’s investment objectives, financial situation, or needs. All investors should obtain advice based on their unique situation before making any investment decision. The contents of this communication and any attachments are for informational purposes only and under no circumstances should they be construed as an offer to buy or sell, or a solicitation to buy or sell any future, option, swap or other derivative. The sources for the information and any opinions in this communication are believed to be reliable, but Futures International, LLC does not warrant or guarantee the accuracy of such information or opinions. Futures International, LLC and its principals and employees may take positions different from any positions described in this communication. Past results are not necessarily indicative of future results.