From: Terry Reilly
Sent: Monday, July 02, 2018 4:22:20 PM (UTC-06:00) Central Time (US & Canada)
Subject: FI Evening Grain Comments 07/02/18
PDF attached includes revised yields and production estimate for US corn, soybeans, winter and spring wheat.
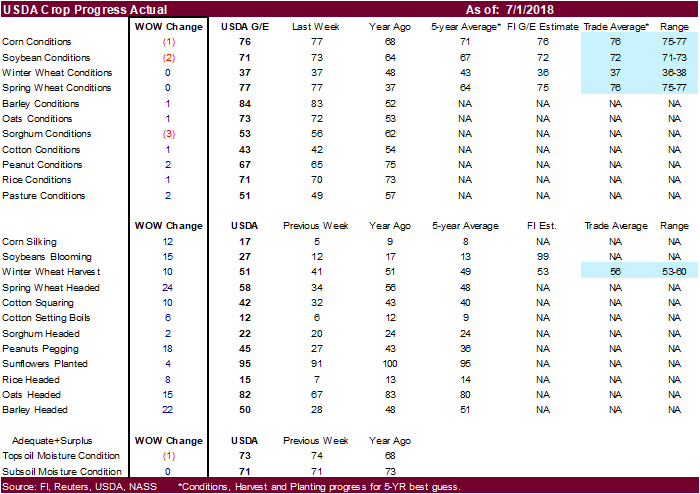
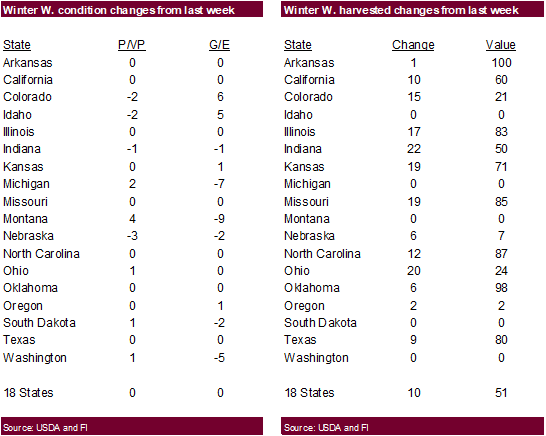
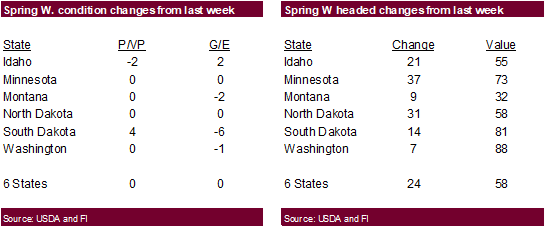
US corn conditions were down one, soybeans down two, and both winter & spring wheat unchanged. Traders were looking for a one-point decline in G/E for corn, soybeans, and spring wheat, and unchanged for winter wheat. US winter wheat harvesting progress increased 10 points from the previous week. Traders were looking for a 15-point increase for winter wheat harvesting progress.
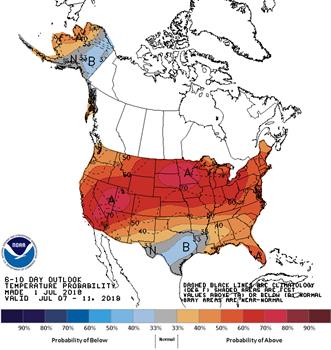
- Weekend weather for the US was mostly as expected and the hot temperatures across the Midwest posed little threat to the summer crops.
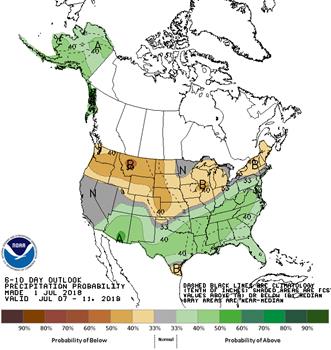
- The US Midwest eastern crop areas will be drier than the western areas. The high pressure aloft will build up across the Plains and Midwest this workweek before shifting to the High Plains region and Rocky Mountain region by Friday. The Midwest in general will see warm temperatures and restricted rainfall during this period. Rainfall will range from 0.25 to 0.75 inch with local totals to 1.00 inch by early next week. Then the ridge of high pressure will shift to the east Friday and then flatten out during the coming weekend and early in the week of July 9. New ridge development will evolve in the western United States later in the week of July 9.
- U.S. Delta and much of the southeastern United States will see a favorable mix of rain and sunshine.
- U.S. hard red winter wheat production areas will see a good mix of weather with net drying most dominant favoring crop maturation and harvest progress.
- The U.S. southern Plains drought will change little over the next 30 days.
- The U.S northern U.S. Plains will receive showers and thunderstorms through mid-week this week and then trend drier for a while.
- Canadian Prairies will see rain in the west, north and far east. The south-central and southwestern areas will be drier than usual.
- China weather improves for the dry areas of Liaoning, Hebei, and Shanxi over the next week.
- Western Australia will get some rain Monday and Tuesday. Victoria and South Australia has an opportunity for rain during mid-week this week.
- Northern Europe will continue to see net drying through at least July 11.
- The southern portions of Russia’s Southern Region will see 0.50” to 1.50” this week.
- Eastern Ukraine to western Kazakhstan will see some showers mid- to late-week.
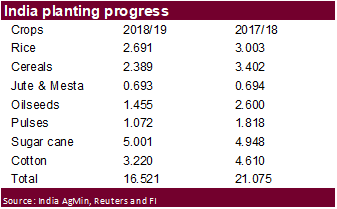
- India could use rain across the central and western growing regions. Low rainfall has delayed planting progress. As of July 1, 15.5 million hectares of summer crops had been planted, down from 21.1 million at this time last year.
Source: World Weather Inc. and FI
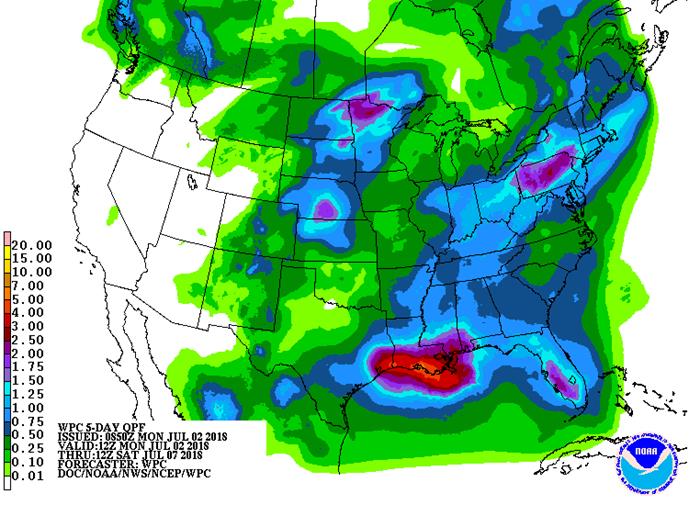
SIGNIFICANT CORN AND SOYBEAN BELT PRECIPITATION EVENTS
WEST CORN BELT EAST CORN BELT
-Tue 20% cvg of up to 0.75” 30-60% daily cvg of
and local amts to 1.50” up to 0.60” and locally
with some 1.50-3.50” more each day
amts from east N.D. to
NW Mn.
Wed-Thu 75% cvg of up to 0.75”
and local amts to 2.0”;
wettest north
Wed-Fri 85% cvg of up to 0.70”
and local amts to 1.40”
Fri-Sun 5-20% daily cvg of up
to 0.30” and locally
more each day
Sat-Jul 9 Up to 20% daily cvg of
up to 0.25” and locally
more each day; some
days may be dry
Jul 9-10 40% cvg of up to 0.40”
and local amts to 1.0”;
wettest north
Jul 10-11 40% cvg of up to 0.30”
and local amts to 0.60”
Jul 11-13 35% cvg of up to 0.50”
and locally more;
wettest north
Jul 12-16 5-20% daily cvg of up
to 0.25” and locally
more each day
Jul 14-16 5-20% daily cvg of up
to 0.25” and locally
more each day
DELTA SOUTHEAST
Tdy-Tue 85% cvg of up to 0.75”
and local amts to 1.75”;
wettest south
Tue 20% cvg of up to 0.40”
and locally more;
driest NE
Wed 30% cvg of up to 0.30” 65% cvg of up to 0.40”
and locally more and local amts to 1.0”
Thu 60% cvg of up to 0.40” 25% cvg of up to 0.50”
and locally more; and locally more;
driest north wettest north
Fri-Sat 80% cvg of up to 0.60” 80% cvg of up to 0.75”
and local amts to 1.30” and local amts to 1.75”
Sun-Jul 9 20-40% daily cvg of 25-50% daily cvg of
up to 0.60” and locally up to 0.75” and locally
more each day; more each day
driest north
Jul 10-11 15-35% daily cvg of 15-35% daily cvg of
up to 0.50” and locally up to 0.50” and locally
more each day more each day
Jul 12-13 60% cvg of up to 0.50” 55% cvg of up to 0.50”
and locally more and locally more
Jul 14-16 5-20% daily cvg of up 5-20% daily cvg of up
to 0.30” and locally to 0.35” and locally
more each day more each day
Source: World Weather Inc. and FI
- Canada on holiday
- International Grains Council publishes its monthly forecasts for grains supply and markets, 8:30am ET (1:30pm London)
- ICE Futures U.S. releases delivery notice for July raw-sugar contract, ~9am
- USDA weekly corn, soybean, wheat export inspections, 11am
- Costa Rican Coffee Institute releases exports for June, 2pm
- USDA soybean crush data for May, 3pm
- USDA weekly crop progress report, 4pm
- International Cotton Advisory Committee releases monthly report on world cotton production, demand and stockpiles, 4pm
- Cargo surveyors Intertek and SGS release their respective data on Malaysia’s June palm oil exports
- Ivory Coast weekly cocoa arrivals
TUESDAY, JULY 3:
- New Zealand dairy auction on Global Dairy Trade online market starts ~7am ET Tuesday (~noon London Tuesday, ~11pm Wellington Tuesday)
- OECD-FAO annual report on agriculture outlook, 9am ET (2pm London)
WEDNESDAY, JULY 4:
- U.S. Independence Day holiday; CBOT grains trading closed
THURSDAY, JULY 5:
- Guatemala coffee exports for June
- AB Foods trading updates, 2am ET (7am London)
- FAO Food Price Index, 4am ET (9am London)
- EIA U.S. weekly ethanol inventories, output, 11am (delayed from Wednesday due to U.S. holiday)
- Andre Pessoa, head of Agroconsult, and executives from Brazil’s grain exporter group Anec speak on nation’s 2018-19 soybean and corn crops
- EU weekly grain, oilseed import and export data
- Port of Rouen data on French grain exports
- Bloomberg weekly survey of analysts’ expectations on grain, sugar prices
FRIDAY, JULY 6:
- China is set to start levying tariffs on agriculture products, in retaliation for U.S. tariffs on imports from China
- USDA weekly crop net-export sales for corn, wheat, soy, cotton, 8:30am (delayed from Thursday due to U.S. holiday)
- ICE Futures Europe commitments of traders weekly report on coffee, cocoa, sugar positions, ~1:30pm ET (~6:30pm London)
- CFTC commitments of traders report will be delayed until Monday July 9
- FranceAgriMer weekly updates on French crop conditions
Source: Bloomberg and FI
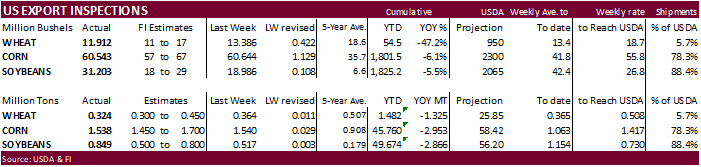
USDA inspections versus Reuters trade range
Wheat 324,181 versus 300,000-500,000 range
Corn 1,537,871 versus 900,000-1,600,000 range
Soybeans 849,204 versus 400,000-800,000 range
GRAINS INSPECTED AND/OR WEIGHED FOR EXPORT
REPORTED IN WEEK ENDING JUN 28, 2018
— METRIC TONS —
CURRENT PREVIOUS
———– WEEK ENDING ———- MARKET YEAR MARKET YEAR
GRAIN 06/28/2018 06/21/2018 06/29/2017 TO DATE TO DATE
BARLEY 709 0 0 807 2,926
CORN 1,537,871 1,540,434 1,127,210 45,759,861 48,713,138
FLAXSEED 0 0 1,028 24 1,713
MIXED 0 0 0 24 0
OATS 0 0 599 599 898
RYE 0 0 0 0 0
SORGHUM 9,416 336 16,183 4,771,093 5,024,940
SOYBEANS 849,204 516,711 281,945 49,673,709 52,539,547
SUNFLOWER 0 0 0 0 383
WHEAT 324,181 364,312 519,098 1,482,422 2,807,551
Total 2,721,381 2,421,793 1,946,063 101,688,539 109,091,096
CROP MARKETING YEARS BEGIN JUNE 1 FOR WHEAT, RYE, OATS, BARLEY AND FLAXSEED; SEPTEMBER 1 FOR CORN, SORGHUM, SOYBEANS AND SUNFLOWER SEEDS. INCLUDES WATERWAY SHIPMENTS TO CANADA.
Due to the Federal holiday on Wednesday, July 4, the weekly Commitments of Traders market report will be released on Monday, July 9 at 3:30pm.
· China said Jan-Jun exports to the US (all products) were up 5.4% from a year ago. June was 3.8% higher.
· US jobs report is due out Friday.
· ICE: Winner Of Mexican Presidential Election Lopez Obrador: Majority Of Cabinet Designated During Campaign Will Take Their Posts
– Will Seek To Continue NAFTA Trade Pact With United States, Canada
· US Markit Manufacturing PMI Jun F: 55.4 (est 54.7; prev 54.6)
· US ISM Manufacturing Jun: 60.2 (est 58.5; prev 58.7)
– – ISM Employment Jun: 56.0 (prev 56.3)
– – ISM Prices Paid Jun: 76.8 (est 74.8; prev 79.5)
– – ISM New Orders Jun: 63.5 (prev 63.7)
· US Construction Spending (M/M) May: 0.4% (est 0.5%; prev R 0.9%)
· WTI Futures Settle At $73.94/Bbl, Down $0.21
Corn.
- CBOT corn ended sharply lower despite the month. Volume was above average. The US weather over the weekend was about as expected, and the forecast this week does not look threatening for US summer crops. Crop downgrades for summer crops in the Eastern EU and Black Sea regions should limit losses this week, if any, in CBOT grains.
- Funds were estimated heavy net sellers of 28,000 corn contracts, according to Reuters.
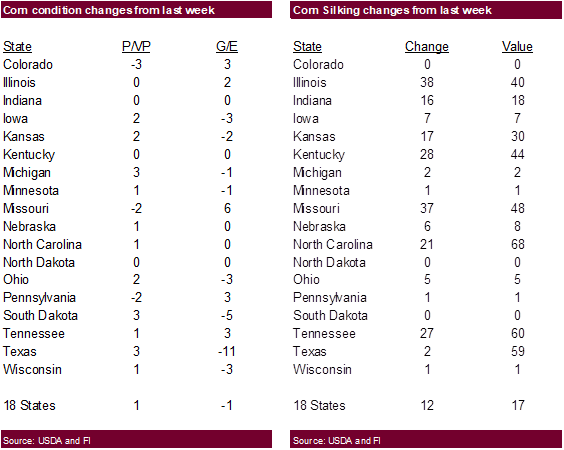
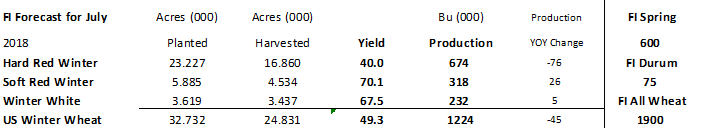
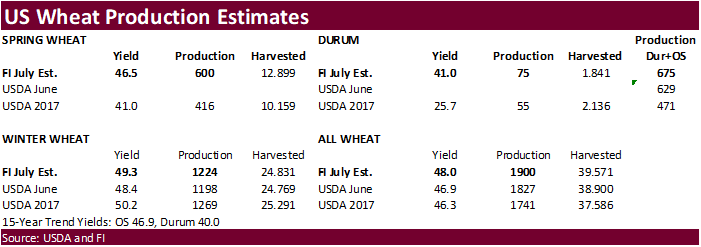
- US corn conditions fell 1 point, as expected. We lowered our yield by 0.5 to 180.5 bu/ac.

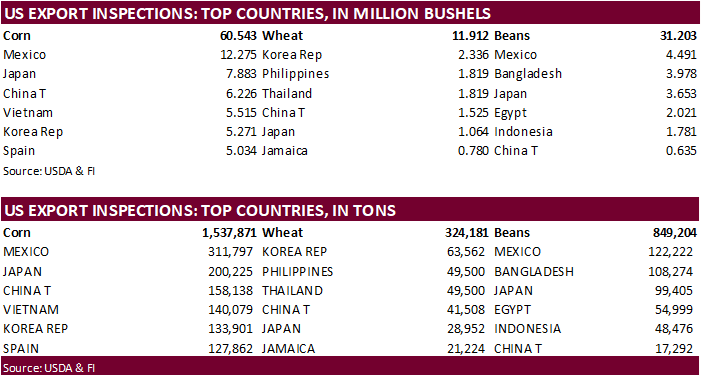
· USDA US corn export inspections as of June 28, 2018 were 1,537,871 tons, within a range of trade expectations, below 1,540,434 tons previous week and compares to 1,127,210 tons year ago. Major countries included Mexico for 311,797 tons, Japan for 200,225 tons, and China T for 158,138 tons.
· Romania reported a case African swine fever.
· China plans to auction off 8 million tons of corn on July 5 and 6.
6/29/18. September corn may trade in a large $3.30-$3.75 range. December corn is seen in a $3.15-4.15 range. If the US good/excellent US corn condition hold over through July, look for December corn to possibly test the $3.00 level.
· US soybeans ended 10 cents lower basis the nearby positions, meal down $2.20-3.30 and soybean oil off 34-35 points.
· Funds sold 6,000 soybeans, sold 4,000 soybean meal, and sold 3,000 soybean oil.
· US soybean acres are higher than corn for the first time since 1983.
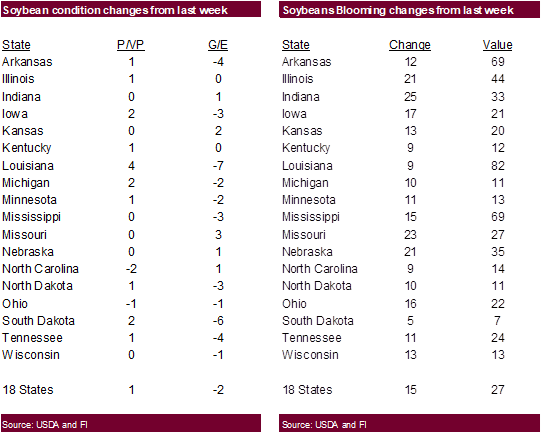
· US soybean conditions fell two points from the previous week. Trade was looking for a one-point decrease. We lowered our US yield by 0.2 to 49.4 bu/ac.

· USDA US soybean export inspections as of June 28, 2018 were 849,204 tons, above a range of trade expectations, above 516,711 tons previous week and compares to 281,945 tons year ago. Major countries included Mexico for 122,222 tons, Bangladesh for 108,274 tons, and Japan for 99,405 tons.
· Canada announced a new set of import tariffs against the US over the weekend.
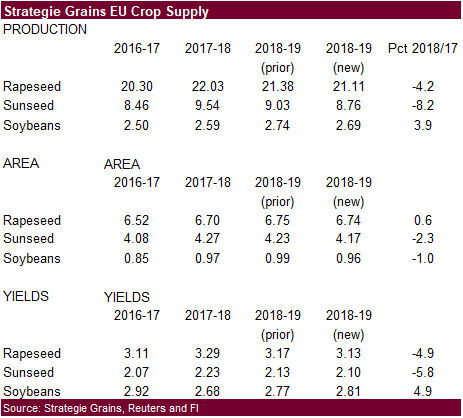
· Strategie Grains further lowered its 2018 EU rapeseed production to 21.1 million ton from 21.4 million tons. They were at 22.2 million two months earlier.
· Brazil will release trade data early this week. We are looking for 10 million tons for soybean exports.
· China September soybean meal futures hit a two-month high and soybeans are near a one-month high.
· China’s CNGOIC reported cash crush margins in China have improved on higher product values, and the crush last week amounted to 1.91 million tons, up 120,000 tons from the previous week.
· Cargo surveyor SGS reported June Malaysian palm exports at 1,058,832 tons, down 141,044 tons or 12% from the same period a month ago and down 151,527 tons from the same period a year ago (12.5% decrease). SGS June palm exports were lowest since 2007. AmSpec reported June palm oil exports for Malaysia at 1.073 million tons, a ten percent decrease from 1.197 million tons in May.
- India could use rain across the central and western growing regions. Low rainfall has delayed planting progress. As of July 1, 15.5 million hectares of summer crops had been planted, down from 21.1 million at this time last year.
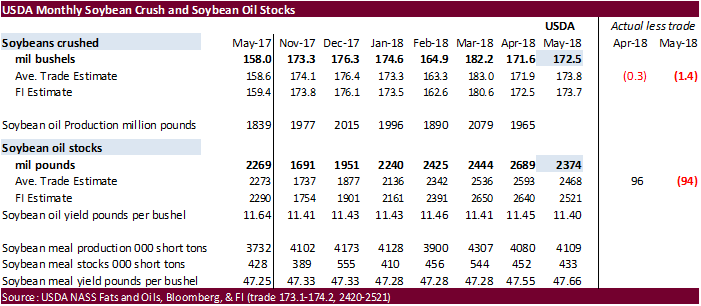
- The US May soybean crush was reported at 172.5 bushels per acre, 1.4 bu below a Bloomberg trade average. Soybean oil stocks were reported at 2.374 billion pounds, 94 million below a trade average. Soybean meal stocks fell to 433,000 short tons from 452,000 short tons last month and compare to 428,000 short tons a year ago. We through the report was bullish soybean oil, slightly bearish soybeans, touch friendly soybean meal.
· China plans to sell another 500,000 tons of soybeans and 50,000 tons of soybean oil out of reserves on Wednesday. China sold 376,965 tons of soybeans out of reserves so far, this season.
- Iran seeks 30,000 tons of sunflower oil on July 10.
- Iran seeks 30,000 tons of palm olein oils on July 10.
- Iran seeks 30,000 tons of soybean oil on August 1.
· August soybeans are seen in a $8.25-$9.25 range; November $8.00-$10.00 range.
· August soybean meal $300-370 range; December $280-$400 range.
· August soybean oil 27.50-30.25 range; December 27.00-30.50 range.
- All three US wheat markets tanked after trading higher early on Monday. The weakness was led by Chicago. Some of the move was macro related. Wheat was higher early on ongoing concerns over crops in France and Russia.
- Funds in Chicago were sellers of an estimated net 13,000 SRW wheat futures, according to Reuters.
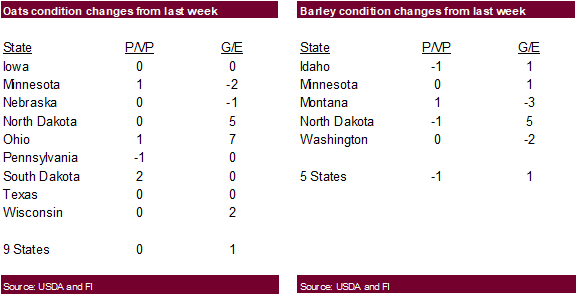
- US winter wheat and spring wheat crop condition for the combined G/E categories were unchanged from the previous week.
· USDA US all-wheat export inspections as of June 28, 2018 were 324,181 tons, within a range of trade expectations, below 364,312 tons previous week and compares to 519,098 tons year ago. Major countries included Korea Rep for 63,562 tons, Philippines for 49,500 tons, and Thailand for 49,500 tons.
- December Paris wheat futures ended 2.50 euros higher.
- The International Grains Council (IGC) cut its 2018-19 global wheat production by five million tons to 737 million tons, citing Russia and the European Union.
- Russian export prices for wheat out of the Black Sea increased $1.00/ton to $2.00/ton, fob, according to IKAR. SovEcon reported $197/ton.
- Russia’s state weather forecaster estimated Russia’s grain crop down 10-15 percent to 121.9-115.1 million tons from their 2017 forecast of 135.4 million tons. This would be below a 5-year average.
- Egypt said they confiscated 45,000 tons of “spoiled” Russian wheat near Alexandria.
- The CME Group is delisting their EU wheat futures contract.
Export Developments.
- Algeria seeks optional origin milling wheat on Tuesday for September shipment.
- Iraq’s lowest offer for 50,000 tons of wheat from the US, Australia and/or Canada on July 2, valid until July 8, was $295/ton from Canada. Lowest offer for Australia was $306.75 and US was $318.49/ton.
· Jordan seeks 120,000 tons of barley on July 4 for Oct-Nov shipment.
- Japan in a SBS import tender seeks 120,000 tons of feed wheat and 200,000 tons of barley on July 4 for arrival by December 28.
- Syria seeks 200,000 tons of wheat on July 2 for Aug 1-Sep 30 shipment. Origins include Russian, Romania and/or Bulgaria.
- Bangladesh seeks 50,000 tons of wheat on July 3 for shipment within 40 days of contract signing.
· Jordan seeks 120,000 tons of wheat on July 8 for Oct-Nov shipment.
Rice/Other
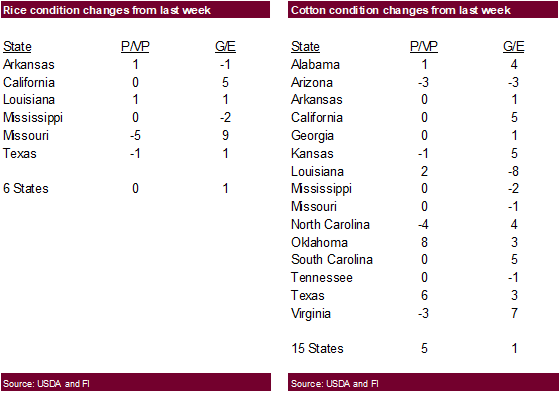
· US rice conditions improved one point and cotton was up one.
- China sold 31,602 tons of rice from state reserves at auction at an average price of 2689 yuan/per ton or $405.47/ton, 3.14 percent of what was offered.
- Results awaited: South Korea seeks 102,800 tons of rice for September-February arrival on June 27.
TONNES(M/T) GRAIN TYPE ARRIVAL/PORT
20,000 Brown Short Sept. 15, 2018/Incheon
20,000 Brown Short Sept. 15, 2018/Ulsan
20,000 Brown Short Sept. 15, 2018/Masan
10,000 Brown long Sept. 30, 2018/Mokpo
10,000 Brown long Sept. 30, 2018/Donghae
2,800 Milled Medium Dec. 1-31, 2018/Busan
10,000 Milled Medium Feb. 28, 2019/Busan
10,000 Milled Medium Feb. 28, 2019/Busan
- Results awaited: Iran seeks 50,000 tons of rice from Thailand on July 3.
- September Chicago wheat $4.50-$5.30 range.
- September KC $4.55-$5.40 range.
- September MN $5.00-$6.00 range.
USDA Announces Sugar TRQs for Fiscal Year 2019
WASHINGTON, July 2, 2018 – The U.S. Department of Agriculture (USDA) today announced the fiscal year 2019 tariff-rate quotas (TRQs) for raw cane and refined sugars.
USDA is establishing the FY 2019 TRQ for raw cane sugar at 1,231,497 short tons raw value (STRV) (1,117,195 MTRV*), the minimum to which the United States is committed under the World Trade Organization Uruguay Round Agreement on Agriculture. Pursuant to Additional U.S. Note 5 to Chapter 17 of the U.S. Harmonized Tariff Schedule and Section 359k of the Agricultural Adjustment Act of 1938, as amended, USDA published this decision in the Federal Register.
Raw cane sugar under this TRQ must be accompanied by a certificate of quota eligibility and may enter the United States until September 30, 2019. The Office of the U.S. Trade Representative (USTR) will allocate this TRQ among supplying countries and customs areas.
USDA is establishing the FY 2019 refined sugar TRQ at 211,644 STRV (192,000 MTRV). Of this quantity, 187,393 STRV (170,000 MTRV) is reserved for the importation of specialty sugars as defined by the USTR. The total refined sugar TRQ includes the 24,251 STRV (22,000 MTRV) minimum to which the United States is committed under Uruguay Round Agreement on Agriculture, of which 1,825 STRV (1,656 MTRV) is reserved for specialty sugar.
Because the specialty sugar TRQ is administered on a first-come, first-served basis, USDA will release it in tranches to allow for orderly marketing throughout the year. The FY 2019 specialty sugar TRQ will be opened in five tranches. The first tranche, totaling 1,825 STRV (1,656 MTRV), will open October 1, 2018. All specialty sugars are eligible for entry under this tranche.
The second, third, fourth, and fifth tranches will be reserved for organic sugar and other specialty sugars not currently produced commercially in the United States or reasonably available from domestic sources. The second tranche of 55,116 STRV (50,000 MTRV) will open on October 10, 2018. The third tranche of 55,116 STRV (50,000 MTRV) will open on January 23, 2019. The fourth and fifth tranches, both of 38,581 STRV (35,000 MTRV), will open on April 17, 2019, and July 17, 2019, respectively.
The USTR will allocate the refined sugar TRQ, other than the amount reserved for specialty sugar, among supplying countries and customs areas.
* Conversion factor: 1 metric ton = 1.10231125 short tons.
Terry Reilly
Senior Commodity Analyst – Grain and Oilseeds
Futures International │190 S LaSalle St., Suite 410│Chicago, IL 60603
W: 312.604.1366
AIM: fi_treilly
ICE IM: treilly1
Skype: fi.treilly

Trading of futures, options, swaps and other derivatives is risky and is not suitable for all persons. All of these investment products are leveraged, and you can lose more than your initial deposit. Each investment product is offered only to and from jurisdictions where solicitation and sale are lawful, and in accordance with applicable laws and regulations in such jurisdiction. The information provided here should not be relied upon as a substitute for independent research before making your investment decisions. Futures International, LLC is merely providing this information for your general information and the information does not take into account any particular individual’s investment objectives, financial situation, or needs. All investors should obtain advice based on their unique situation before making any investment decision. The contents of this communication and any attachments are for informational purposes only and under no circumstances should they be construed as an offer to buy or sell, or a solicitation to buy or sell any future, option, swap or other derivative. The sources for the information and any opinions in this communication are believed to be reliable, but Futures International, LLC does not warrant or guarantee the accuracy of such information or opinions. Futures International, LLC and its principals and employees may take positions different from any positions described in this communication. Past results are not necessarily indicative of future results.