From: Terry Reilly
Sent: Tuesday, July 10, 2018 4:04:31 PM (UTC-06:00) Central Time (US & Canada)
Subject: FI Evening Grain Comments 07/10/18
PDF attached
- Midday models turned a touch wetter for the dry areas of Missouri and a few nearby areas in eastern Kansas into southeastern Iowa and west-central Illinois Friday into Saturday.
- There were no major changes to the US Midwestern weather forecast.
- The US Midwest will see several rounds of timely rain are expected during the next two weeks, but not heavy in any locations. Some areas may receive multiple events, resulting in slowing of development.
- Temperatures will be warmer than normal across the US this week but trend cooler by the end of the week.
- For areas that receive little or no precipitation, we believe crop stress is most vulnerable across eastern Kansas into Missouri and portions of southeastern Iowa and west-central Illinois. These areas show short top soil moisture, and should be monitored over the next couple of weeks.
- Rain prospects improve for the Delta.
- Periodic rainfall and warm temperatures should be good for summer crop development for US hard red wheat.
- The Canadian Prairies will see rain early this week.
- There are no issues with Brazil second corn crop harvesting.
- Europe will continue to see net drying in parts of the northern and western growing regions, but in general weather is expected to improve this weekend into next week for many dry areas.
- Net drying is expected to persist across eastern Ukraine and in Russia’s southern, central and Volga regions.
- Australia will see an increase in net drying.
Source: World Weather Inc. and FI
Bloomberg News surveys
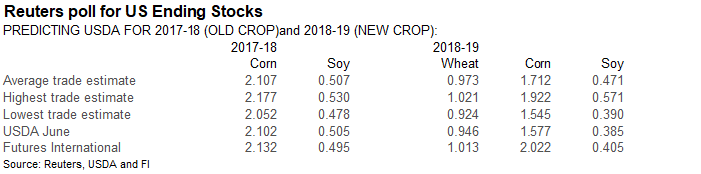
U.S. Corn, Soy, Wheat Inventory Survey Before USDA WASDE Report
================================================================
|———-Survey Results———–|USDA
2018-19 Crop: | Avg | Low | High | June
================================================================
Corn | 1,725| 1,455| 2,022| 1,577
Soybeans | 498| 380| 797| 385
Wheat | 985| 924| 1,084| 946
2017-18 Crop: |
Corn | 2,115| 2,058| 2,200| 2,102
Soybeans | 512| 478| 631| 505
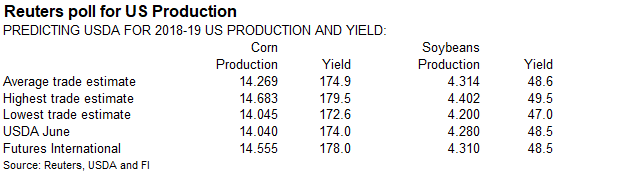
U.S. Corn, Soybean Production Survey Before USDA WASDE Report
================================================================
|———-Survey Results———–|USDA
2018-19 Crop: | Avg | Low | High | 2017-18
================================================================
Corn | 14,304| 14,045| 14,683| 14,040
Corn Yield | 175.1| 172.6| 179.5| 174.0
Soybeans | 4,324| 4,220| 4,430| 4,280
Soybean Yield | 48.7| 47.5| 50.0| 48.5
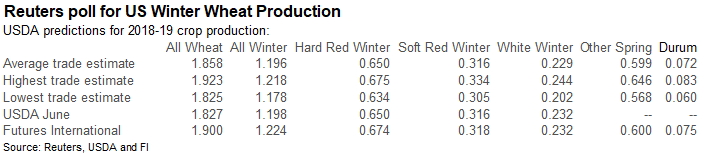
U.S. 2018 Wheat Production Survey Before USDA WASDE Report
================================================================
|———–Survey Results————|USDA
2018 Crop: | Avg | Low | High | June
================================================================
All Wheat | 1,860| 1,769| 1,923| 1,827
All Winter | | | |
Wheat | 1,199| 1,178| 1,224| 1,198
HRW | 652| 634| 675| 650
SRW | 316| 305| 334| 316
White Winter | 230| 202| 244| 232
Durum | 74| 60| 83|n/a
Other Spring | 600| 568| 646|n/a
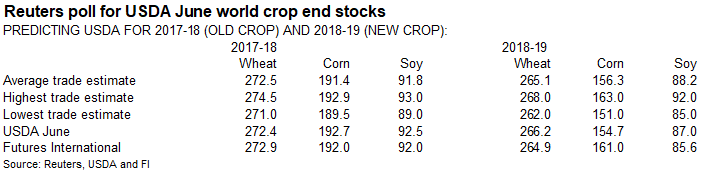
World Corn, Soybeans, Wheat Survey Before USDA WASDE Report
================================================================
|———-Survey Results———–|USDA
2018-19 Ending | | | |
Stocks: | Avg | Low | High | June
================================================================
Corn | 155.7| 151.0| 163.0| 154.7
Soybeans | 88.7| 85.6| 92.0| 87.0
Wheat | 263.7| 256.0| 268.0| 266.2
2017-18 Ending |
Stocks: |
Corn | 191.6| 188.0| 193.7| 192.7
Soybeans | 92.0| 89.0| 94.0| 92.5
Wheat | 272.2| 270.4| 274.5| 272.4
Brazil, Argentina Corn and Soy Survey Before USDA WASDE Report
================================================================
|———Survey Results———-|USDA
2017-18 crop: | Avg | Low | High | June
================================================================
Corn – Argentina | 32.7| 32.0| 33.0| 33.0
Corn – Brazil | 83.2| 79.2| 85.5| 85.0
Soybeans – | | | |
Argentina | 36.7| 35.5| 37.5| 37.0
Soybeans – Brazil | 118.9| 117.0| 120.0| 119.0
Source: Bloomberg and FI
Corn.
- CBOT corn traded lower on weakness in wheat and a non-threating US weather outlook over the next week, during the peak of US corn pollination.
- Funds sold an estimated net 15,000 corn contracts.
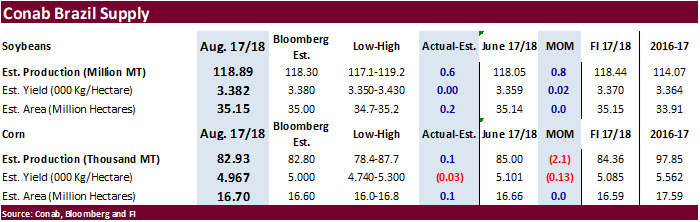
· Brazil’s Conab estimated the 2017-18 corn production at 82.93 million tons, 2.1 million below the previous month but 100,000 tons above a Bloomberg trade guess. The yield was decreased to 4.967 tons/hectare from 5.101 tons in June. Last year Brazil produced 97.85 million tons.
· Conab’s supply report was viewed neutral corn and slightly bearish for soybean futures.
· The CNGOIC estimated China corn production at 216.5 million tons, 0.3% above 2017, but revised higher from 213.7 million tons last month.
· Soybean and Corn Advisor left his US corn yield estimate unchanged at 178.0 bushels per acre. We left our 180.5 bushels per acre US corn yield unchanged from the previous week.
· USDA may increase its yield on Thursday from its current 174.0 bushels. We think they will go to 178.0 bushels.
· Mexico and China import tariffs on US pork continue to sack US prices. Futures were down more than 2 percent during mid-session trading.
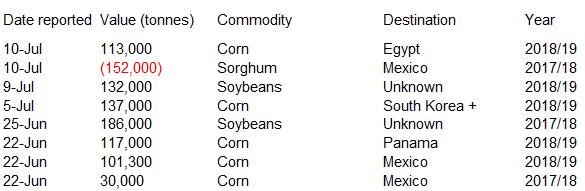
· Under the 24-hour reporting system, exporters reported the cancellations of 152,000 tons of sorghum for Mexico.
· US exporters also reported the 24-hour sale of 113,000 tons of corn for Egypt.
· China sold about 50-51 million tons of corn this season. China will offer more corn on July 12 & 13.
Soybean complex.
· The US soybean complex was higher this morning but gains limited as the Dalian products fell hard overnight amid a CNGOIC report on lower soybean meal use, and US weather remains non-threatening. Above normal temperatures for the US this week are keeping some bulls in the market.
· US soybeans ended nearly unchanged, August meal $2.30 higher and August soybean oil 13 higher.
- Midday weather models turned a touch wetter for the dry areas of Missouri and a few nearby areas in eastern Kansas into southeastern Iowa and west-central Illinois Friday into Saturday.
· Funds sold an estimated net 6,000 soybean contracts, bought 3,000 meal and 3,000 soybean oil.
· 29,310 tons of US soybeans arrived in Argentina’s Rosario port.
· Conab’s report was viewed neutral corn and slightly bearish for soybean futures.
· Brazil’s Conab estimated the 2017-18 soybean production at 118.89 million tons, 0.8 million above the previous month and 600,000 tons above a Bloomberg trade guess. The yield was increased to 3.382 tons/hectare from 3.359 tons in June. Last year Brazil produced 114.07 million tons.
· The CNGOIC sees ample China soybean supplies through August as animal feed mills are reducing the soybean meal use due to low domestic pork prices.
· China September soybean futures decreased 51 yuan per ton or 1.4%, September meal was down 33 or 1.1%, China soybean oil down 60 (1.1%) and China September palm down 76 (1.6%).
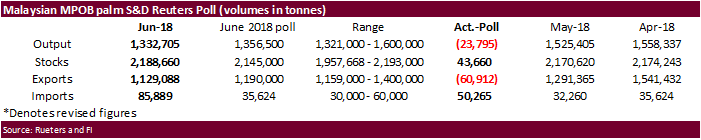
· Cargo surveyor SGS reported July 1-10 Malaysian palm exports at 257,096 tons, down 77,036 tons or 23% from the same period a month ago and down 124,145 tons from the same period a year ago (33% decrease). AmSpec reported palm exports at 278,048 tons, down 14 percent from the previous period last month.
· Soybean and Corn Advisor left his US soybean yield estimate unchanged at 51.0 bushels per acre. We lowered our US soybean yield to 49.2 bushels per acre from 49.4.
· We look for USDA to leave its US soybean yield estimate unchanged on Thursday.
· NOPA is due out with the US soybean crush on Monday, July 16.
· No export developments on Tuesday.
· US wheat futures were on the defensive from lower Paris wheat futures and US spring wheat conditions unexpectedly improving from the previous week.
· Funds today sold an estimated net 8,000 SRW wheat contracts.
· The CNGOIC estimated China wheat production at 122.5 million tons, 5.6% below 2017, down from 126.7 million tons last month.
- December Paris wheat fell 3.50 euros to 183.25 euros or nearly 2 percent on improving weather and less than expected crop losses for France.
- France’s AgMin (initial) estimated the soft wheat crop at 36.1MMT, down from 36.6 million tons in 2017. Last week Strategie estimated this crop at 33.3 MMT. This could be perceived as a high estimate by the AgMin, and pressuring Parris wheat futures.
- Germany imported about 300,000 tons of feed wheat from the Black Sea region (countries that reside in the EU).
- Note a Bloomberg survey pegged German wheat production estimated at 21.5 MMT versus 24.3 MMT last year (DBV estimate). The range of estimates was 20.8-22.1 MMT.
- A recent Reuters poll pegged the EU soft wheat production at 136 million tons.
- Net drying is expected to persist across eastern Ukraine and in Russia’s southern, central and Volga regions.
- Yesterday SovEcon lowered its Russia wheat crop to 69.6 million tons from 72.5 million previously. They are still perceived as on the high side for production. Grain output was pegged at 113.9 million tons, down from 118.6 million tons previously. FC Stone is at 70.8 million tons for Russia wheat output.
- Romania’s wheat crop was lowered by UkrAgroConsult to 8 million tons, down 8 percent from it previous estimate. Exports in 2018-19 seen at 4.9 million tons, down from previous 5.1MMT.
Export Developments.
· Egypt’s GASC bought 175,000 tons of Russian wheat for August 21-31 shipment.
o 60,000 ton at $203.65 FOB and $15.70 freight equating to $219.35 C&F
o 60,000 ton at $204.75 FOB and $15.70 freight equating to $220.45 C&F
o 60,000 ton at $204.50 FOB and $16.50 freight equating to $221.00 C&F
Terry Reilly
Senior Commodity Analyst – Grain and Oilseeds
Futures International │190 S LaSalle St., Suite 410│Chicago, IL 60603
W: 312.604.1366
AIM: fi_treilly
ICE IM: treilly1
Skype: fi.treilly

Trading of futures, options, swaps and other derivatives is risky and is not suitable for all persons. All of these investment products are leveraged, and you can lose more than your initial deposit. Each investment product is offered only to and from jurisdictions where solicitation and sale are lawful, and in accordance with applicable laws and regulations in such jurisdiction. The information provided here should not be relied upon as a substitute for independent research before making your investment decisions. Futures International, LLC is merely providing this information for your general information and the information does not take into account any particular individual’s investment objectives, financial situation, or needs. All investors should obtain advice based on their unique situation before making any investment decision. The contents of this communication and any attachments are for informational purposes only and under no circumstances should they be construed as an offer to buy or sell, or a solicitation to buy or sell any future, option, swap or other derivative. The sources for the information and any opinions in this communication are believed to be reliable, but Futures International, LLC does not warrant or guarantee the accuracy of such information or opinions. Futures International, LLC and its principals and employees may take positions different from any positions described in this communication. Past results are not necessarily indicative of future results.