From: Terry Reilly
Sent: Wednesday, July 11, 2018 4:13:02 PM (UTC-06:00) Central Time (US & Canada)
Subject: FI Evening Grain Comments 07/11/18
PDF attached
- Today’s forecast was wetter for the driest parts of the Midwest (eastern Kansas into Missouri and some nearby areas in southeastern Iowa and west-central Illinois) July 18-19. (WW)
- The morning forecast was also wetter for the Delta and Southeast.
- The US Midwest will see several rounds of timely rain are expected during the next two weeks, but not heavy in any locations. Some areas may receive multiple events, resulting in slowing of development.
- Temperatures will be warmer than normal across the US this week but trend cooler by the end of the week.
- For areas that receive little or no precipitation, we believe crop stress is most vulnerable across eastern Kansas into Missouri and portions of southeastern Iowa and west-central Illinois. These areas show short top soil moisture, and should be monitored over the next couple of weeks.
- Rain prospects improve for the Delta.
- Periodic rainfall and warm temperatures should be good for summer crop development for US hard red wheat.
- The Canadian Prairies will see rain early this week.
- There are no issues with Brazil second corn crop harvesting.
- Europe will continue to see net drying in parts of the northern and western growing regions, but in general weather is expected to improve this weekend into next week for many dry areas.
- Net drying is expected to persist across eastern Ukraine and in Russia’s southern, central and Volga regions.
- Australia will see an increase in net drying.
Source: World Weather Inc. and FI
From the weekly precipitation map, you can see net drying across a large portion of the lower WCB and far eastern areas of the central ECB.
SIGNIFICANT CORN AND SOYBEAN BELT PRECIPITATION EVENTS
WEST CORN BELT EAST CORN BELT
Tdy-Fri 40% cvg of up to 0.75” and local amts over 2.0”; Mostly dry with a few insignificant showers
east-central and SE S.D. to Wi. wettest; south and
far NW driest.
Sat 15% cvg of up to 0.35” and local amts to 0.60”;
wettest west and north
Sat-Mon 80% cvg of up to 0.75”and local amts to 2.0”
Sun-Tue 85% cvg of up to 0.75” and local amts to 2.0”
Tue 20% cvg of up to 0.65” and local amts to 1.35”;
central areas wettest
Jul 18-19 40% cvg of up to 0.75” and local amts to 2.0”
Jul 18-20 60% cvg of up to 0.75” and local amts to 1.75”;
driest north
Jul 20-21 45% cvg of up to 0.35” and locally more;
wettest north
Jul 21-22 30% cvg of up to 0.25” and locally more
Jul 22-24 50% cvg of up to 0.40” and locally more
Jul 23-24 50% cvg of up to 0.40” and locally more
U.S. DELTA/SOUTHEAST SIGNIFICANT PRECIPITATION EVENTS
DELTA SOUTHEAST
Tdy-Sun 20-40% daily cvg of up to 0.75” and locally
more each day; rain shifts from NE to SW
during the period
Thu-Fri 5-20% daily cvg of up to 0.30” and locally
more each day
Sat-Sun 15-35% daily cvg of up to 0.40” and locally
more each day
Mon-Tue 55% cvg of up to 0.60” and local amts to 1.30”; 70% cvg of up to 0.75” and local amts to 1.75”
wettest north
Jul 18-19 60% cvg of up to 0.75” and local amts to 1.50”;
wettest north
Jul 18-21 15-35% daily cvg of up to 0.50” and locally
more each day
Jul 20-25 10-25% daily cvg of up to 0.30” and locally
more each day
Jul 22-25 10-25% daily cvg of up to 0.35” and locally
more each day
Source: World Weather Inc. and FI
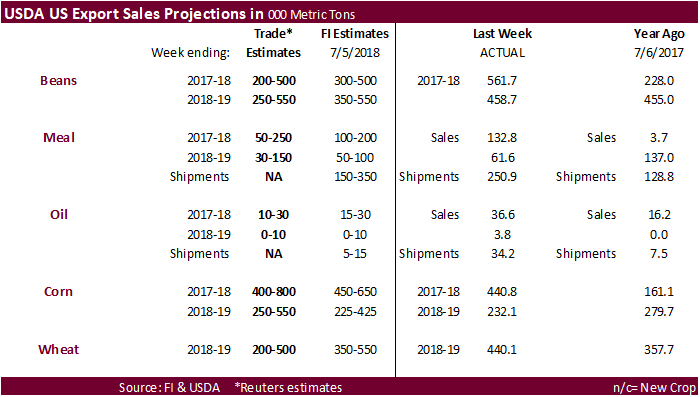
- USDA weekly net-export sales for corn, wheat, soy, cotton, 8:30am
- U.S. National Weather Service’s Climate Prediction Center will release its latest forecast for El Nino, 9am
- USDA’s monthly World Agricultural Supply and Demand Estimates (WASDE) report for July, noon
- Brazil coffee exporters group Cecafe releases data on shipments in June and the prospect for exports in 2018-19 crop
- Strategie Grains publishes monthly EU grains report
- Port of Rouen data on French grain exports
- Buenos Aires Grain Exchange weekly crop report
- Bloomberg weekly survey of analysts’ expectations on grain, sugar prices
- EARNINGS: Suedzucker
FRIDAY, JULY 13:
- China’s General Administration of Customs releases preliminary commodity trade data for June, including soy and palm oil, 10pm ET Thursday (10am Beijing Friday)
- ICE Futures Europe commitments of traders weekly report on coffee, cocoa, sugar positions, ~1:30pm ET (~6:30pm London)
- CFTC commitments of traders weekly report for period ending July 10 on positions for various U.S. futures and options, 3:30pm
- FranceAgriMer weekly updates on French crop conditions
Source: Bloomberg and FI
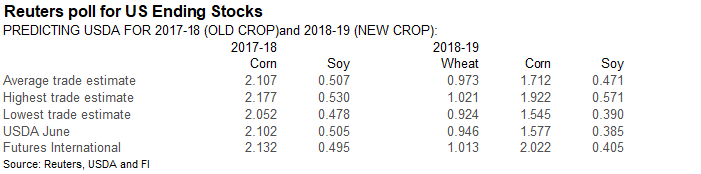
Bloomberg News surveys
U.S. Corn, Soy, Wheat Inventory Survey Before USDA WASDE Report
================================================================
|———-Survey Results———–|USDA
2018-19 Crop: | Avg | Low | High | June
================================================================
Corn | 1,725| 1,455| 2,022| 1,577
Soybeans | 498| 380| 797| 385
Wheat | 985| 924| 1,084| 946
2017-18 Crop: |
Corn | 2,115| 2,058| 2,200| 2,102
Soybeans | 512| 478| 631| 505
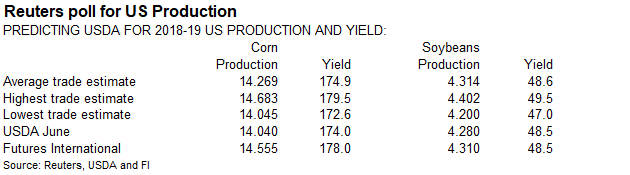
U.S. Corn, Soybean Production Survey Before USDA WASDE Report
================================================================
|———-Survey Results———–|USDA
2018-19 Crop: | Avg | Low | High | 2017-18
================================================================
Corn | 14,304| 14,045| 14,683| 14,040
Corn Yield | 175.1| 172.6| 179.5| 174.0
Soybeans | 4,324| 4,220| 4,430| 4,280
Soybean Yield | 48.7| 47.5| 50.0| 48.5
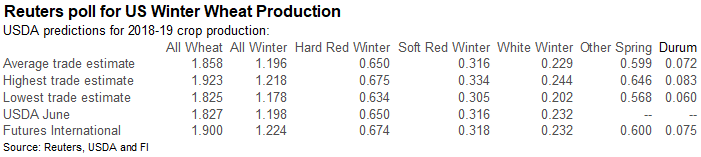
U.S. 2018 Wheat Production Survey Before USDA WASDE Report
================================================================
|———–Survey Results————|USDA
2018 Crop: | Avg | Low | High | June
================================================================
All Wheat | 1,860| 1,769| 1,923| 1,827
All Winter | | | |
Wheat | 1,199| 1,178| 1,224| 1,198
HRW | 652| 634| 675| 650
SRW | 316| 305| 334| 316
White Winter | 230| 202| 244| 232
Durum | 74| 60| 83|n/a
Other Spring | 600| 568| 646|n/a
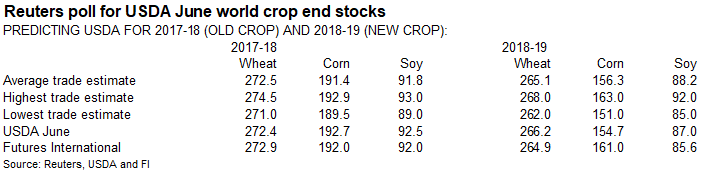
World Corn, Soybeans, Wheat Survey Before USDA WASDE Report
================================================================
|———-Survey Results———–|USDA
2018-19 Ending | | | |
Stocks: | Avg | Low | High | June
================================================================
Corn | 155.7| 151.0| 163.0| 154.7
Soybeans | 88.7| 85.6| 92.0| 87.0
Wheat | 263.7| 256.0| 268.0| 266.2
2017-18 Ending |
Stocks: |
Corn | 191.6| 188.0| 193.7| 192.7
Soybeans | 92.0| 89.0| 94.0| 92.5
Wheat | 272.2| 270.4| 274.5| 272.4
Brazil, Argentina Corn and Soy Survey Before USDA WASDE Report
================================================================
|———Survey Results———-|USDA
2017-18 crop: | Avg | Low | High | June
================================================================
Corn – Argentina | 32.7| 32.0| 33.0| 33.0
Corn – Brazil | 83.2| 79.2| 85.5| 85.0
Soybeans – | | | |
Argentina | 36.7| 35.5| 37.5| 37.0
Soybeans – Brazil | 118.9| 117.0| 120.0| 119.0
Source: Bloomberg and FI
- Renewed China/US trade fears surfaced late Tuesday after the US president warned another $200 billion of import tariffs could soon go into place. U.S. Commerce Department released a list of Chinese goods that would be subject to new round of tariffs. ustr.gov/sites/default/files/301/2018-0026%20China%20FRN%207-10-2018_0.pdf
- China will retaliate with making US/China M&A activity harder.
・ US stocks were lower, WTI crude lower.
・ US PPI Ex Food and Energy June 0.3% M/M: (est 0.2% prev 0.3%)
・ US PPI Ex Food, Energy and Trade June 0.3% M/M: (est 0.2% prev 0.1%)
・ US PPI Final Demand June 3.4% Y/Y: (est 3.1% prev 3.1%)
・ US PPI Ex Food and Energy 2.8% June Y/Y: (est 2.6% prev 2.4%)
・ US PPI Ex Food. Energy and Trade June 2.7% Y/Y: (prev 2.6%)
Corn.
- CBOT corn traded to new contract lows on a new round of proposed 10% tariffs $200 bln of Chinese imports.
- Funds sold an estimated net 22,000 corn contracts.
- WTI Crude oil was under pressure throughout the day.
- CME increased corn maintenance margins by 11 percent to $800 per contract.
- EPA abandoned plans to increase blending of biofuels for 2019 to make up for exempted volumes.
・ USDA may increase its yield on Thursday from its current 174.0 bushels. We think they will go to 178.0 bushels.
・ We are going to put our FI WASDE snapshot together Thursday morning.
- USDA plans to end the lockups for the monthly S&D reports, giving media an equal footing for access to data before they are released. Media is forbidden to share the data with the public until release time.
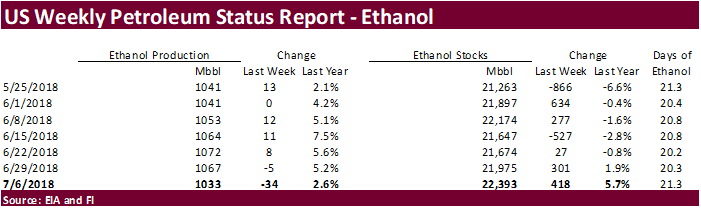
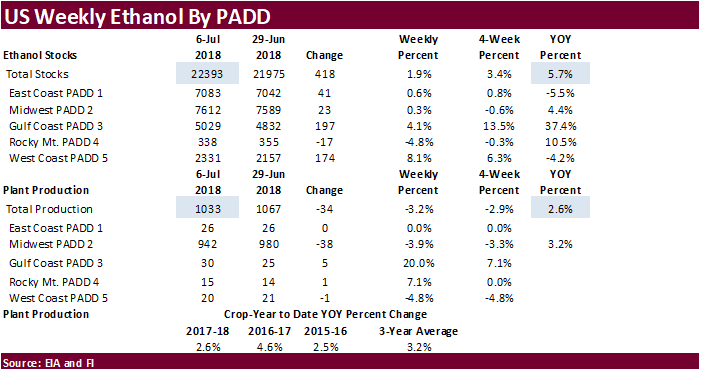
・ US ethanol production fell by most since February 9th by 34,000 barrels to 1.033 million, lowest inventory level since May 18. Traders were looking for a slight decrease (2).
・ The report was viewed as bearish corn futures, but larger fundamentals, namely widespread commodity selling amid China/US trade concerns, are already pressuring corn futures.
・ September 2017-ealry July US ethanol production is running 2.6 percent above the same period a year ago.
・ With corn prices on the move lower over the past month, the US corn crush spread hit its highest level since early September 2017.
Export Developments
・ None reported.
・ China sold about 50-51 million tons of corn this season. China will offer more corn on July 12 & 13.
7/11/18. September corn may now trade in a large $3.00-$3.90 range. December corn is seen in a $3.00-4.50 range. If the US good/excellent US corn condition hold over through July, look for December corn to possibly test the $2.90 area.
Soybean complex.
・ CBOT soybeans traded sharply lower on China/US trade fears. The crush traded above $2.00 during the day from limited losses in soybean meal prices. Soybean meal opened the day session near unchanged and trade lower. Soybean oil fell hard following sharp declines in Malaysian palm.
・ We are taking a poll on where the price floor might be at for nearby CBOT soybeans from now until end of harvest (early November), assuming China/US trade issue do not get resolved. Lowest level we heard was $6.50. Any feedback or response is welcome.
・ Funds sold an estimated net 14,000 soybean contracts, 3,000 meal and 5,000 soybean oil.
- CME increased soybean maintenance margins by 11 percent to $2050 per contract.
・ Mato Grosso’s IMEA reported producers slowed sales of soybeans and corn after transportation costs increased. 2018-19 soybean sales were 21% complete at the end of June, compared with 20.8% from the previous month and 9.4% a year ago. Sales of the 2017-18 crop were 86.3%, up from 85.6% at the end of May and little changed from a year ago.
・ Chinese officials are trying to keep local markets and traders calm by exercising monetary policy and issuing statements that they can handle feed use without the assistance of US soybeans. They are also careful on limiting media coverage, according to newswires.
・ Cofco mentioned “China can meet any deficit in its domestic soy market should imports from the U.S. decline.”
・ China September soybean futures decreased 11 yuan per ton or 0.3%, September meal was up 32 or 1.0%, China soybean oil down 40 (0.7%) and China September palm down 52 (1.1%).
・ Malaysia will lower its August CPO export tax to 4.5 percent from 5 percent in July.
・ September Malaysian palm was 55 lower at MYR2204 and cash down $12.50 at $572.50.
・ We look for USDA to leave its US soybean yield estimate unchanged on Thursday.
・ NOPA is due out with the US soybean crush on Monday, July 16.
・ No US export developments were reported on Wednesday.
・ China sold 6286 tons of soybean oil out of 49,000 tons offered at an average price of 5000 yuan per ton, or $754.19/ton, 12.5 percent of what was offered.
・ China sold 171,778 tons of soybeans out of 493,000 tons offered at an average price of 2995 yuan per ton, or $449.14/ton, 35 percent of what was offered. China sold 832,302 tons of soybeans out of reserves so far, this season.
- China will offer 61,000 tons of rapeseed oil on July 17.
- Iran seeks 30,000 tons of sunflower oil on July 10.
- Iran seeks 30,000 tons of palm olein oils on July 10.
- Iran seeks 30,000 tons of soybean oil on August 1.
We lowered our nearby soybean trading range by 25 cents.
・ August soybeans are seen in a $8.00-$8.75 range; November $7.75-$9.50 range.
・ August soybean meal $290-355 range; December $280-$400 range.
・ August soybean oil 28.00-30.00 range; December 27.00-30.50 range.
・ Widespread commodity selling pulled US wheat futures lower.
・ Funds today sold an estimated net 10,000 SRW wheat contracts.
- December Paris wheat fell 2.25 euros to 181.00 euros.
- French farm office, AgriMer, sees a higher wheat crop and upped their stocks estimate to 3 million tons.
- IKAR lowered 2018-19 Russia’s export forecast to 41.0 million tons from 43.2 million previously.
- Russia plans to sell 1.5 million tons of wheat reserves this marketing year.
- Net drying is expected to persist across eastern Ukraine and in Russia’s southern, central and Volga regions.
- The USDA Attaché updated their S&D’s for Australia and wheat production for 2018-19 was estimated at 21 million tons, 12.5 percent below USDA’s official forecast of 24.0 million tons (MMT). This is lower than what we projected (23.2MMT), and we lowered output, based on a smaller harvested area, to 22 million tons. See our updated world wheat production estimates attached (PDF) after the text. Note on June 12, ABARES lowered the Australian wheat production estimate by nearly 8 percent to 21.9 million tons.
- From the USDA Attaché report:
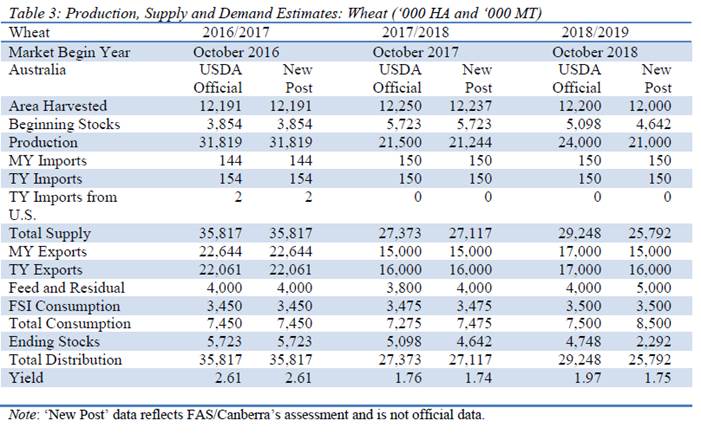
Source: USDA Attaché and FI
- Japan in a SBS import tender bought 130 tons of barley for arrival by December 28.
- Japan in a SBS import tender seeks 120,000 tons of feed wheat and 200,000 tons of barley on July 18 for arrival by December 28.
・ Jordan passed 120,000 tons of barley for Oct/Nov shipment.
- China sold 6,000 tons of 2013 imported wheat from state reserves at auction at an average price of 2322 yuan/per ton or $348.07/ton, 0.3 percent of what was offered.
・ Japan seeks 62,865 tons of milling wheat this week. (Reuters)
Details are as follows (in tons):
COUNTRY TYPE QUANTITY
U.S. Western White 17,177 *
U.S. Dark Northern Spring (protein minimum 14.0%) 11,353 *
Australia Standard White (West Australia) 34,335 *
Shipments: * Loading between Sept. 1 and Sept. 30, 2018
・ Mauritius seeks 6,000 tons of white rice on July 13 for Sep 1-Nov 30 shipment.
・ Jordan seeks 120,000 tons of wheat on July 19 for Oct-Nov shipment.
Rice/Other
- September Chicago wheat $4.50-$5.25 range.
- September KC $4.50-$5.30 range.
- September MN $5.00-$5.90 range.
Terry Reilly
Senior Commodity Analyst C Grain and Oilseeds
Futures International │190 S LaSalle St., Suite 410│Chicago, IL 60603
W: 312.604.1366
AIM: fi_treilly
ICE IM: treilly1
Skype: fi.treilly

Trading of futures, options, swaps and other derivatives is risky and is not suitable for all persons. All of these investment products are leveraged, and you can lose more than your initial deposit. Each investment product is offered only to and from jurisdictions where solicitation and sale are lawful, and in accordance with applicable laws and regulations in such jurisdiction. The information provided here should not be relied upon as a substitute for independent research before making your investment decisions. Futures International, LLC is merely providing this information for your general information and the information does not take into account any particular individual’s investment objectives, financial situation, or needs. All investors should obtain advice based on their unique situation before making any investment decision. The contents of this communication and any attachments are for informational purposes only and under no circumstances should they be construed as an offer to buy or sell, or a solicitation to buy or sell any future, option, swap or other derivative. The sources for the information and any opinions in this communication are believed to be reliable, but Futures International, LLC does not warrant or guarantee the accuracy of such information or opinions. Futures International, LLC and its principals and employees may take positions different from any positions described in this communication. Past results are not necessarily indicative of future results.