From: Terry Reilly
Sent: Monday, July 16, 2018 3:59:18 PM (UTC-06:00) Central Time (US & Canada)
Subject: FI Evening Grain Comments 07/16/18
PDF attached
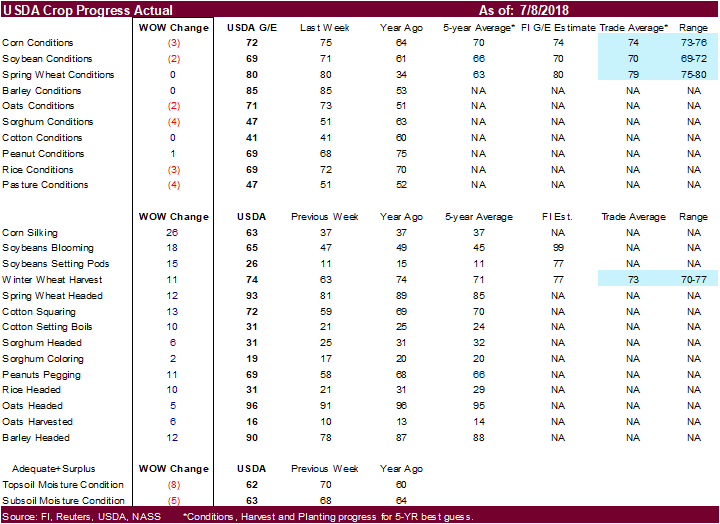
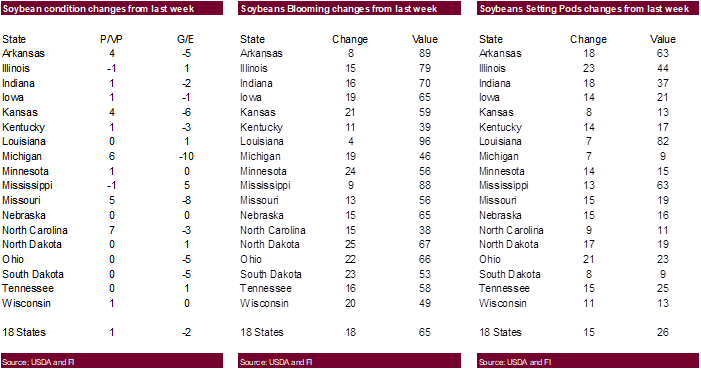
USDA Crop Progress
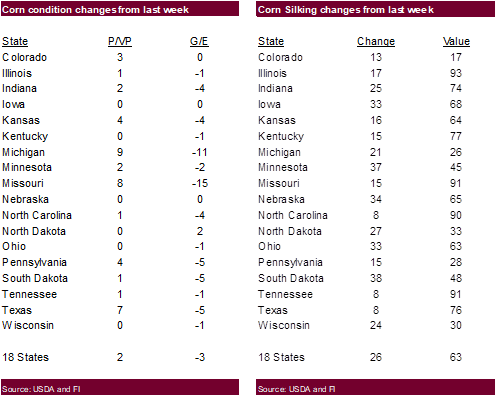
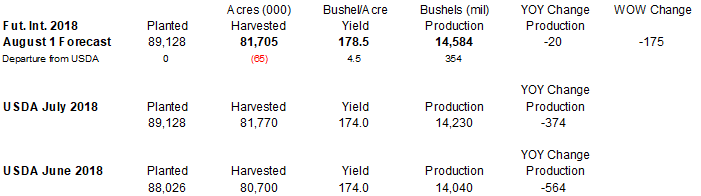
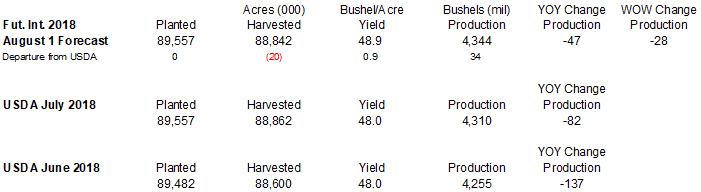
· Corn down 3. We dropped our US corn yield by 2.0 bu/ac and lowered production by 175 million.
· Soybeans down 2. We dropped our US soybean yield by 0.3 bu/ac and lowered production by 28 million.
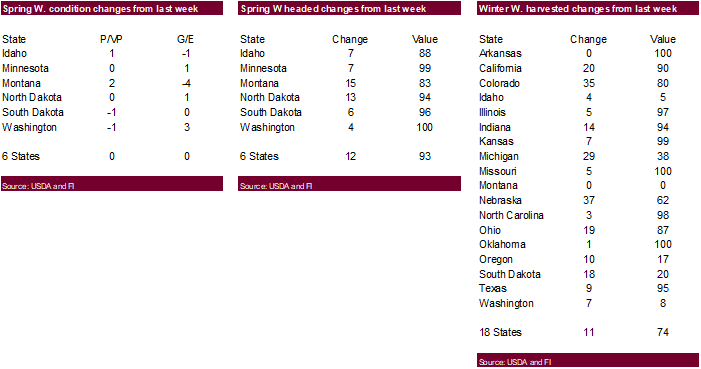
· WW Harvest @ 74 vs. 63 LW
· Spring unchanged (good up 1 & exc. down 1)
· Subsoil moisture levels are now below a year ago
http://usda.mannlib.cornell.edu/usda/current/CropProg/CropProg-07-16-2018.pdf
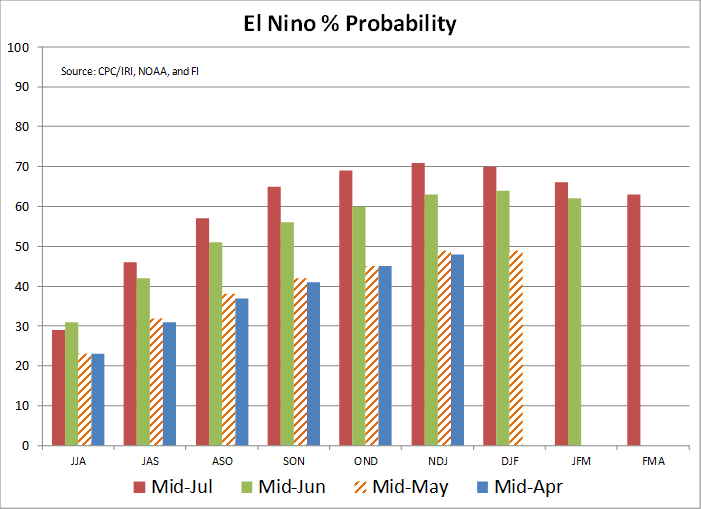
· IRI ENSO Forecast per Columbia University shows the change of El Nino during the November, December and January period at 71 percent, up from 63 percent forecast in mid-June.
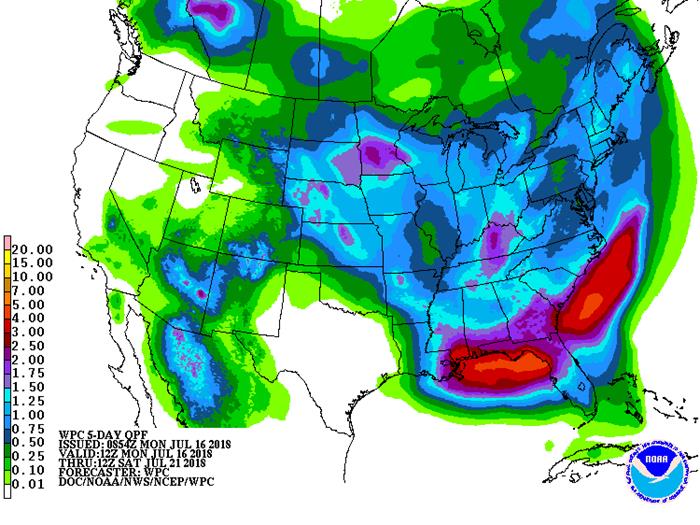
· Rain over the weekend was about as expected and cooling will start to set in after warm Monday temperatures. Nighttime low temperatures will be down into the 50s and 60s during mid-week, lasting through July 26. The southern U.S. Plains and lower Delta will remain hot during this period.
· Several waves of rain are forecast across the northern and central Plains, Midwest, Delta and southeastern states through July 31.
· The U.S. Pacific northwest and northwestern U.S. Plains will be dry or mostly dry during the next ten days
· Net drying will continue across the southwestern Corn Belt and the southern Plains.
· The Delta and southeastern states will see a mix of rain and sunshine.
· The northwestern Plains will see an increase of net drying.
· We are hearing lack of corn tasseling across WI. Feedback is welcome.
· The Canada Prairies will see net drying across the southern crop areas. Western and northern Alberta will be wettest.
· East-central China will continue to see net drying this week but the Northeast Provinces will improve with rain.
· Frequent rain will fall from eastern Europe through the western CIS this week.
· Western Europe will trend wetter this week.
Source: World Weather Inc. and FI
SIGNIFICANT CORN AND SOYBEAN BELT PRECIPITATION EVENTS
WEST CORN BELT EAST CORN BELT
Tdy-Tue 5-15% daily cvg of up
to 0.30” and locally
more each day;
wettest south
Tue-Wed Mostly dry with a few
insignificant showers
Wed-Fri 80% cvg of up to 0.75”
and local amts to 1.50”
with a few bands of
1.50-3.0”; far SE and
far NW driest
Thu-Sat 85% cvg of up to 0.75”
and local amts to 2.0”
Sat Mostly dry with a few
insignificant showers
Sun 20% cvg of up to 0.25”
and locally more;
wettest east
Sun-Jul 24 60% cvg of up to 0.60”
and local amts to 1.30”
Jul 23-25 60% cvg of up to 0.50”
and local amts to 1.10”
Jul 25 15% cvg of up to 0.20”
and locally more
Jul 26 15% cvg of up to 0.20”
and locally more
Jul 26-27 55% cvg of up to 0.70”
and locally more
Jul 27-29 65% cvg of up to 0.75”
and locally more
Jul 28-30 40% cvg of up to 0.60”
and locally more
U.S. DELTA/SOUTHEAST SIGNIFICANT PRECIPITATION EVENTS
DELTA SOUTHEAST
Tdy-Wed 75% cvg of up to 0.70” 85% cvg of up to 0.75”
and local amts to 1.50”; and local amts to 1.50”
far north and far south with a few bands of
driest 1.50-3.0”; wettest
south
Thu 20% cvg of up to 0.75”
and local amts to 1.50”;
wettest SE
Thu-Fri 40% cvg of up to 0.50”
and local amts to 1.30”;
wettest north
Fri-Sat 75% cvg of up to 0.75”
and local amts to 1.75”;
driest west
Sat-Jul 23 Up to 15% daily cvg of
up to 0.20” and locally
more each day; some
days may be dry
Sun-Jul 23 10-25% daily cvg of
up to 0.35” and locally
more each day; Va.
and Carolinas wettest
Jul 24-25 40% cvg of up to 0.50” 60% cvg of up to 0.75”
and local amts to 1.10” and local amts to 1.50”
Jul 26-27 10-25% daily cvg of
up to 0.30” and locally
more each day
Jul 26-28 15-35% daily cvg of
up to 0.60” and locally
more each day
Jul 28-30 50% cvg of up to 0.60”
and locally more
Jul 29-31 60% cvg of up to 0.75”
and locally more
Source: World Weather Inc. and FI
Bloomberg weekly agenda
MONDAY, JULY 16:
- Japan on holiday; no rubber trading on Tokyo Commodity Exchange
- Cargo surveyors AmSpec and Intertek release their respective data on Malaysia’s July 1-15 palm oil exports, 11pm ET Sunday (11am Kuala Lumpur Monday); SGS data during same period, 3am ET Monday (3pm local time Monday)
- European Cocoa Association 2Q cocoa grind data, 2am ET (7am London)
- German Confectionery Industry 2Q cocoa grind data, 2am ET (7am London)
- USDA weekly corn, soybean, wheat export inspections, 11am
- USDA weekly crop progress report, 4pm
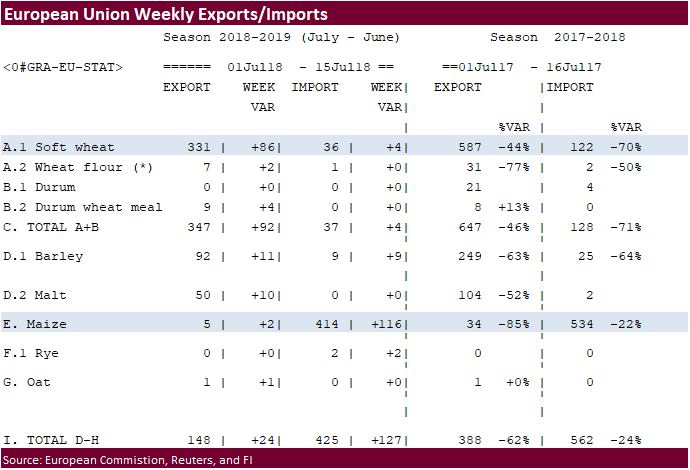
- EU weekly grain, oilseed import and export data
- Ivory Coast weekly cocoa arrivals
TUESDAY, JULY 17:
- New Zealand dairy auction on Global Dairy Trade online market starts ~7am ET (~noon London, ~11pm Wellington)
WEDNESDAY, JULY 18:
- EIA U.S. weekly ethanol inventories, output, 10:30am
THURSDAY, JULY 19:
- Nicaragua on holiday
- USDA weekly net-export sales for corn, wheat, soy, cotton, 8:30am
- USDA red meat production for June, 3pm
- National Confectioners Association North America 2Q cocoa grind, ~4pm
- Port of Rouen data on French grain exports
- Buenos Aires Grain Exchange weekly crop report
- Bloomberg weekly survey of analysts’ expectations on grain, sugar prices
FRIDAY, JULY 20:
- Colombia on holiday
- Cocoa Association of Asia is set to release 2Q cocoa grind data
- ICE Futures Europe commitments of traders weekly report on coffee, cocoa, sugar positions, ~1:30pm ET (~6:30pm London)
- USDA milk production for June, 3pm
- USDA cattle on feed for June, 3pm
- CFTC commitments of traders weekly report on positions for various U.S. futures and options, 3:30pm
- FranceAgriMer weekly updates on French crop conditions
Source: Bloomberg and FI
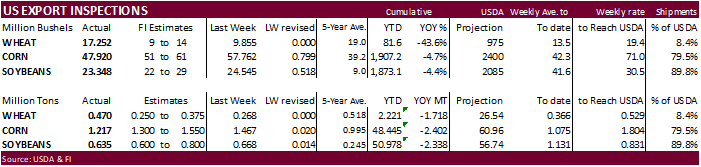
USDA inspections versus Reuters trade range
Wheat 469,523 versus 200,000-400,000 range
Corn 1,217,233 versus 900,000-1,500,000 range
Soybeans 635,429 versus 300,000-800,000 range
GRAINS INSPECTED AND/OR WEIGHED FOR EXPORT
REPORTED IN WEEK ENDING JUL 12, 2018
— METRIC TONS —
————————————————————————-
CURRENT PREVIOUS
———– WEEK ENDING ———- MARKET YEAR MARKET YEAR
GRAIN 07/12/2018 07/05/2018 07/13/2017 TO DATE TO DATE
BARLEY 73 0 98 880 5,319
CORN 1,217,233 1,467,222 1,122,852 48,445,001 50,846,879
FLAXSEED 0 0 343 24 2,742
MIXED 0 0 0 24 24
OATS 0 0 399 1,098 1,297
RYE 0 0 0 0 0
SORGHUM 552 14,283 61,318 4,785,928 5,198,304
SOYBEANS 635,429 668,014 299,639 50,978,252 53,316,326
SUNFLOWER 0 335 0 335 383
WHEAT 469,523 268,221 594,705 2,220,533 3,938,258
Total 2,322,810 2,418,075 2,079,354 106,432,075 113,309,532
————————————————————————-
CROP MARKETING YEARS BEGIN JUNE 1 FOR WHEAT, RYE, OATS, BARLEY AND
FLAXSEED; SEPTEMBER 1 FOR CORN, SORGHUM, SOYBEANS AND SUNFLOWER SEEDS.
INCLUDES WATERWAY SHIPMENTS TO CANADA.
Corn.
- Corn prices traded higher following strength in soybeans. Corn futures did come off its highs into the close, ending 0.50-1.50 cents higher with light bear spreading. A non-threatening US Midwest weather forecast is limiting gains. Pockets across the Delta remain dry. WTI crude was under a good amount of pressure. USD was lower.
- US Crude Oil Futures Settle At $68.06 BBL, Down $2.95, -4.15% (ICE)
- Funds bought an estimated net 6,000 corn contracts.
- News was light.
· There was some talk of some corn failing to tassel across some northwestern Corn Belt states. WI was one of them. Corn generally tassels about 20 days before the kernels are ready to harvest, so there is still some time. Feedback is welcome.
- USDA corn conditions fell 3 points to 72, 2 points below the trade average.
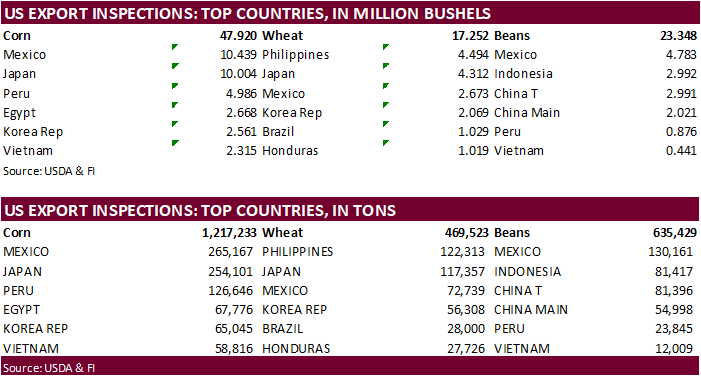
- USDA US corn export inspections as of July 12, 2018 were 1,217,233 tons, within a range of trade expectations, below 1,467,222 tons previous week and compares to 1,122,852 tons year ago. Major countries included Mexico for 265,167 tons, Japan for 254,101 tons, and Peru for 126,646 tons.
- The last time China took more than 1,000 tons of US corn was during the week ending 5/17/2018. A total of 286,712 tons of US corn shave been inspected for China since early January.
- Brazil’s Center-South corn harvest hit 25 percent as of late last week, down from 36 percent a year ago, according to AgRural.
- There has been an increase in talk about US cost of production. Here is the latest FarmDoc article that touches on the subject. https://farmdocdaily.illinois.edu/2018/07/2018-income-projections-after-recent-price-declines.html?utm_source=farmdoc+daily+and+Farm+Policy+News+Updates&utm_campaign=750f0cad25-WEEKENDER_RSS_EMAIL_CAMPAIGN&utm_medium=email&utm_term=0_2caf2f9764-750f0cad25-173649469
· South Korea’s FLC bought 66,000 tons of optional origin corn at $203.99/ton c&f for arrival around December 25. Last week MFG, KFA and NOFI bought corn.
· China sold about 52-53 million tons of corn out of reserves this season.
China domestic cash corn prices vs. the import price of corn are widening
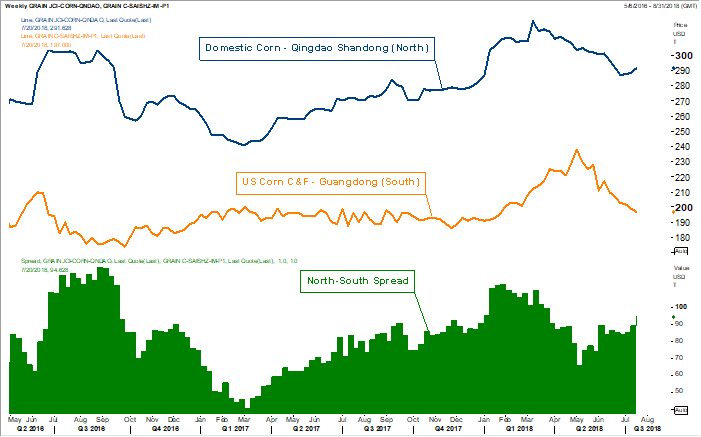
Source: Reuters and FI
Soybean complex.
· Soybeans finished 10.75-12.50 higher (light bear spreading), meal up $2.90-$6.10 (bear spreading) and soybean oil down 30-33 points.
· After briefly hitting a contract low overnight, September soybean futures opened higher and rallied by nearly 10 cents within the first 30 minutes of trading, then traded 15 higher by mid-morning. The USDA inspections report showed a cargo for China. The rally in soybeans was thought to be weather related. The Delta saw hot and dry conditions over the weekend. With no premium built into this market, bull traders are searching for any bullish piece of news on US crop development. Selected field reports for northwestern IA point out patches of poor crops in low lying areas. There was also some talk of some corn failing to tassel across some northwestern Corn Belt states.
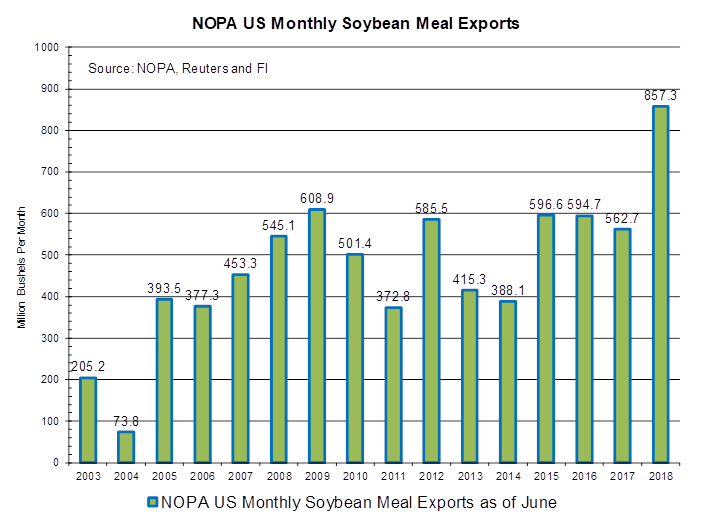
· Soybean meal rallied as well, and found additional support after NOPA reported record soybean meal exports for the month of June.
· Soybean oil futures were under pressure from lower WTI crude oil and high global vegetable oil stocks. Malaysian vegetable oil stocks at the end of June were up from the end of May. Indonesian stocks at the end of May were higher than April. NOPA did report a slightly friendly end of June soybean oil stocks.
· Funds bought an estimated net 6,000 soybean contracts, bought 6,000 meal and sold 3,000 soybean oil.
- USDA soybean conditions fell 2 points to 69, 1 point below the trade average.
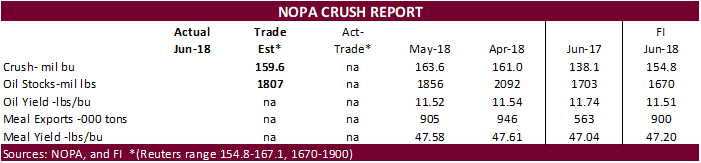
· NOPA updated their US monthly crush. June was a record for the month at 5.31 bushels per day crush, or 159.2 million bushels, 0.4 million below an average trade guess. US end of June soybean oil stocks were reported at 1.766 billion pounds, 41 million below a Reuters trade guess, 90 million below last month, and 63 million above a year ago. US NOPA soybean meal exports were 857,000 short tons, a record for the month of June, below 905,000 short tons last month and above 563,000 short tons a year ago. The soybean meal yield decreased to 47.56 versus 47.58 last month. The soybean oil yield of 11.52 pounds per bushel was unchanged from last month. Typically, the soybean oil yield decreases at this time of year.
· The NOPA report was neutral for soybeans, neutral meal and slightly friendly for soybean oil, in our opinion.
· The CBOT crush traded unchanged to 8 cents lower. August settled at $1.98, down 8 cents. May 2019 was unchanged at $1.45.
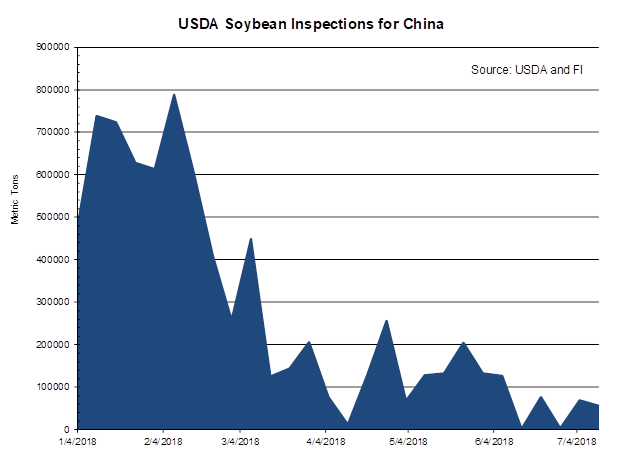
- USDA US soybean export inspections as of July 12, 2018 were 635,429 tons, within a range of trade expectations, below 668,014 tons previous week and compares to 299,639 tons year ago. Major countries included Mexico for 130,161 tons, Indonesia for 81,417 tons, and China T for 81,396 tons.
- 2.0 million bushels or nearly 55,000 tons of soybeans were inspected for China.
- July soybean inspections are on track to hit 2.6 million tons, down from 2.996 million tons in June.
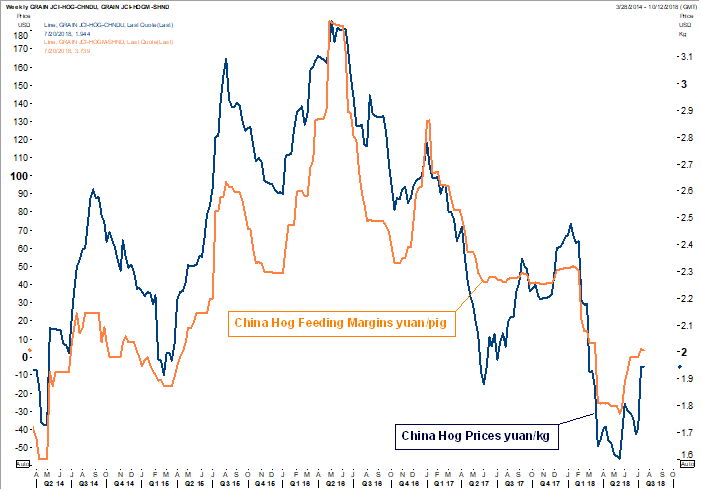
- China’s AgMin noted hot margins are improving, which should allow for domestic soybean meal demand to recover.
· India imported 1.8% less palm oil in June from May, at 487,147 tons, a 4-1/2-year low (lowest volume since February 2014). Crude palm oil import tax was lifted to 44 percent in March from 30 percent and refined tax to 54 percent from 40 percent. Total India vegetable oil imports in June were 1.04 million tons, down 22.4 percent from June 2017.
· Brazil’s Santos Port increased its draft, allowing for up to 10 percent more in shipping capacity, or about 30,000 tons of soybeans per month. The Captaincy last Thursday approved the increase to 30.50 meters versus 13.20 previously.
· We last heard IL soybean oil at around 75 under, East at option, West 100 under and Gulf 230 over. Argentina was 220 over fob and Brazil 225 over nominally.
- The CCC seeks 12,500 tons of soybean meal for Honduras, opened until July 18, for early October shipment.
- South Korea seeks 1,500 tons of non-GMO soybeans on July 25 for September-December delivery.
- China will offer 61,000 tons of rapeseed oil on July 17.
· China sold 832,302 tons of soybeans out of reserves so far, this season.
- Results awaited: Iran seeks 30,000 tons of sunflower oil on July 10.
- Results awaited: Iran seeks 30,000 tons of palm olein oils on July 10.
- Iran seeks 30,000 tons of soybean oil on August 1.
China hog margins are starting to recover.
Source: Reuters and FI
· US wheat futures were lower led by Chicago amid fund selling and improving global weather. September Chicago was down 8.50 cents, September KC off 7.25 cents and September MN down 3.50 cents.
· Funds today sold an estimated net 6,000 SRW wheat contracts.
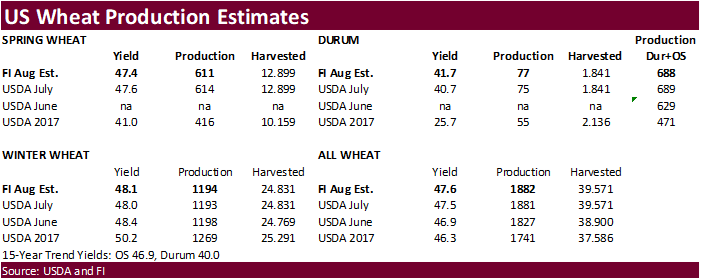
- USDA spring wheat conditions were unchanged at 80, 1 point above the trade average.
- USDA winter wheat harvest advanced 11 points to 74 percent, one point above the trade average.
· Problems for major producing countries still exist but rain prospects increase this week for Rain in western Russia, Belarus, Poland and western Ukraine. Dry and warm weather for the northwestern US Plains, PNW, and Canadian southern Prairies are threatening yields. Wheat establishment for east-central Australia is of concern.
· Agritel pegged the German wheat crop at 21.5 million tons, down 12 percent from a 2017 and 16 percent below a 5-year average.
- December Paris wheat was up 0.50 euros to 186.00 euros.
- USDA US all-wheat export inspections as of July 12, 2018 were 469,523 tons, above a range of trade expectations, above 268,221 tons previous week and compares to 594,705 tons year ago. Major countries included Philippines for 122,313 tons, Japan for 117,357 tons, and Mexico for 72,739 tons.
- Russian wheat export prices are at a 4-week high.
- July 2017 through June 2018 Russia wheat exports totaled 40.388 million tons. Of that total, 21.5 percent were for Egypt and 11.7 percent for Turkey.
Export Developments.
· Saudi Arabia bought 625,000 (595,000 tons sought) of wheat at an average $256.57/ton C&F.
· Results awaited: Saudi Arabia seeks 1,740,000 million tons of fodder barley during the period September-October 2018.
- China sold 1,709 tons of imported wheat from state reserves at auction at an average price of 1709 yuan/per ton or $360.45/ton, 0.09 percent of what was offered.
· Jordan seeks 120,000 tons of barley for Oct/Nov shipment on July 17.
- Japan in a SBS import tender seeks 120,000 tons of feed wheat and 200,000 tons of barley on July 18 for arrival by December 28.
· Jordan seeks 120,000 tons of wheat on July 19 for Oct-Nov shipment.
- Bangladesh seeks 50,000 tons of optional origin milling wheat on July 25 for shipment within 40 days of contract signing.
Rice/Other
- China sold 63,079 tons of rice from state reserves at auction at an average price of 2604 yuan/per ton or $388.98/ton, 6.15 percent of what was offered.
· Results awaited: Mauritius seeks 6,000 tons of white rice for Sep 1-Nov 30 shipment.
- Thailand seeks to sell 120,000 tons of raw sugar on July 18.
- September Chicago wheat $4.60-$5.05 range.
- September KC $4.60-$5.15 range.
- September MN $5.05-$5.50 range.
Terry Reilly
Senior Commodity Analyst – Grain and Oilseeds
Futures International │190 S LaSalle St., Suite 410│Chicago, IL 60603
W: 312.604.1366
AIM: fi_treilly
ICE IM: treilly1
Skype: fi.treilly

Trading of futures, options, swaps and other derivatives is risky and is not suitable for all persons. All of these investment products are leveraged, and you can lose more than your initial deposit. Each investment product is offered only to and from jurisdictions where solicitation and sale are lawful, and in accordance with applicable laws and regulations in such jurisdiction. The information provided here should not be relied upon as a substitute for independent research before making your investment decisions. Futures International, LLC is merely providing this information for your general information and the information does not take into account any particular individual’s investment objectives, financial situation, or needs. All investors should obtain advice based on their unique situation before making any investment decision. The contents of this communication and any attachments are for informational purposes only and under no circumstances should they be construed as an offer to buy or sell, or a solicitation to buy or sell any future, option, swap or other derivative. The sources for the information and any opinions in this communication are believed to be reliable, but Futures International, LLC does not warrant or guarantee the accuracy of such information or opinions. Futures International, LLC and its principals and employees may take positions different from any positions described in this communication. Past results are not necessarily indicative of future results.