From: Terry Reilly
Sent: Monday, July 23, 2018 6:24:18 PM (UTC-06:00) Central Time (US & Canada)
Subject: FI Evening Grain Comments 07/23/18
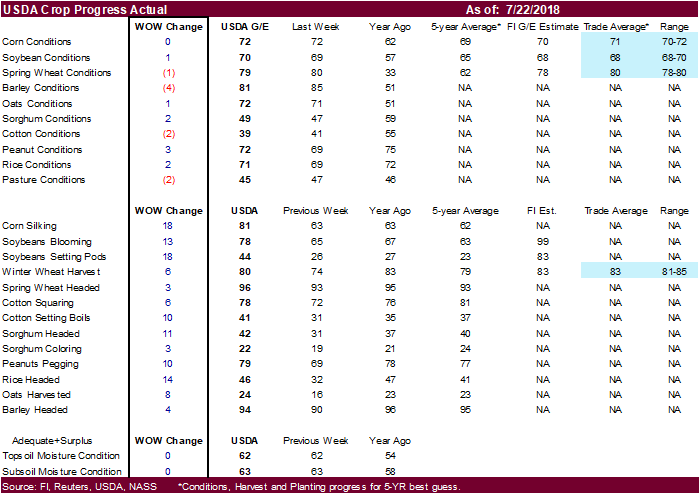
· The USDA crop progress report showed US corn conditions unchanged at 72 percent, one point above trade expectations.
· US soybean conditions increased unexpectedly by one point to 70 percent, 2 points above expectations.
· US spring wheat conditions decreased 1 point to 79 percent. The trade was looking for unchanged.
· US winter wheat harvesting progress increased 6 points to 80 percent, 3 points below average.
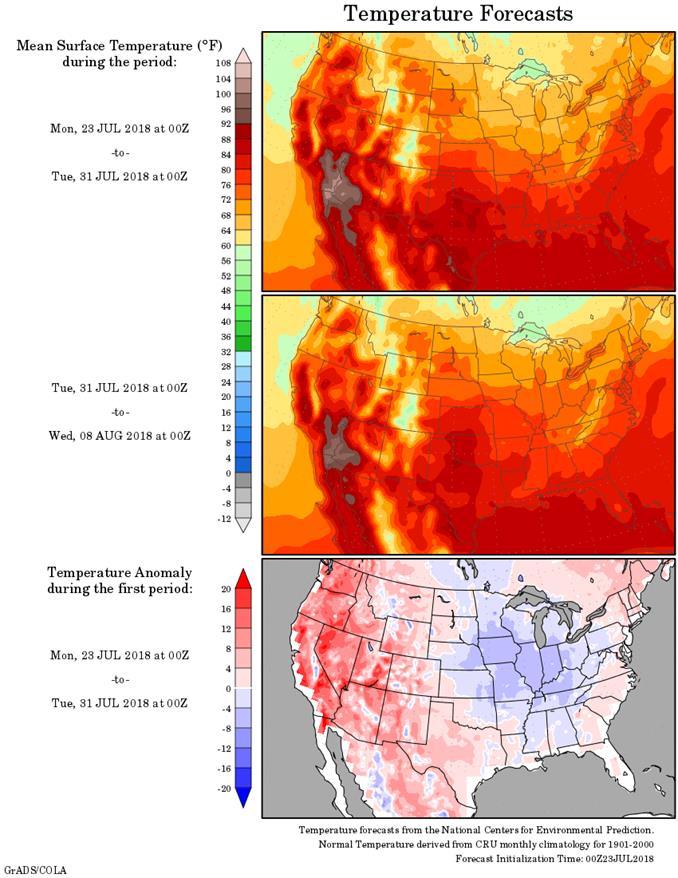
· The ridge of high pressure is expected to stay centered over the southwestern United States throughout this week, creating a northwesterly flow aloft in the central U.S., Northern Plains and Corn Belt.
· It was hot across the US southwest over the weekend.
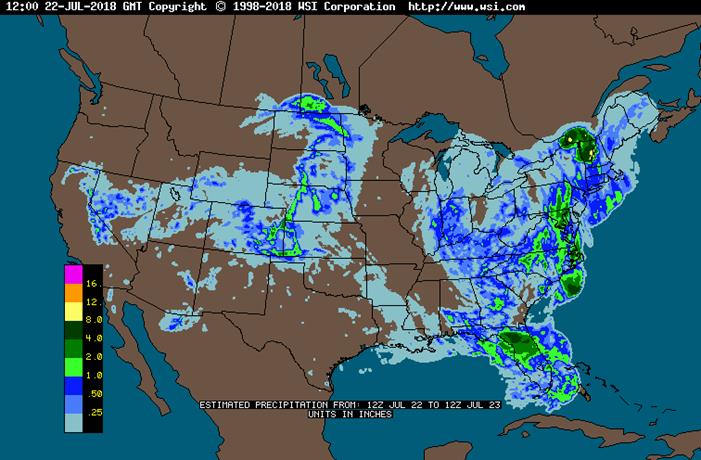
· Rainfall across the Midwest over the weekend was restricted to the ECB and western Dakotas. Dry or mostly dry weather occurred in much of Illinois, western Indiana, western Kentucky, western Tennessee and from much of Missouri through Iowa to western and southern Minnesota and the eastern Dakotas.
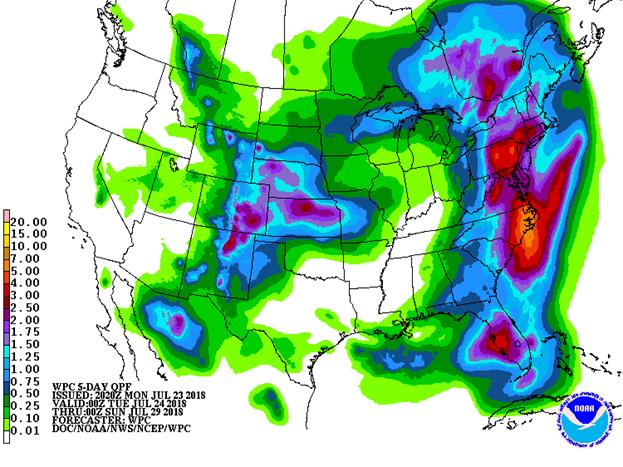
· The western Corn Belt will see net dry this week. The eastern Midwest will see rain.
· U.S. weather late this week through the weekend will be wettest from the central Plains into the lower Ohio River Valley and far northern Delta.
WORLD WEATHER AREAS OF GREATEST INTEREST THIS WEEK
· Northern Europe dryness is not likely change much
· Eastern Europe and the western CIS will see frequent rain maintaining concern over unharvested small grain quality
· Interior eastern and some central China areas will be drying out this week while Tropical Storm Ampil produces heavy rain from Jiangsu through western Shandong and Hebei to parts of the Northeast Provinces
· East-central Australia drought will remain unchanged, despite a few showers
· U.S. Midwest weather will be mild to cool, but net drying is still expected in the central and western Corn Belt through mid-week and in central and northwestern areas late this week into early next week
· Southern U.S. Plains livestock and crops will get relief from heat this week, but not much rain expected
· Key Texas crop areas will stay dry this week, but some rain in West Texas
· SW Canada Prairies, northwestern U.S. Plains and U.S. Pacific Northwest will stay drier and warmer biased through the next week
Source: World Weather Inc. and FI
SIGNIFICANT CORN AND SOYBEAN BELT PRECIPITATION EVENTS
WEST CORN BELT EAST CORN BELT
Tdy-Tue 15-35% daily cvg of
up to 0.65” and locally
more each day;
wettest east
Tue-Wed 30% cvg of up to 0.40”
and local amts to 0.90”;
wettest NW
Wed-Thu 35% cvg of up to 0.20”
and locally more
Thu 15% cvg of up to 0.10”
and locally more;
wettest north
Fri 15% cvg of up to 0.30”
and locally more
Fri-Sun 60% cvg of up to 0.75”
and local amts to 1.50”
with a few 1.50-2.50”
bands in the south;
driest north
Sat-Jul 30 75% cvg of up to 0.75”
and local amts to 2.0”
Jul 30-31 5-20% daily cvg of up
to 0.20” and locally
more each day
Jul 31-Aug 1 5-20% daily cvg of up
to 0.20” and locally
more each day
Aug 1-3 60% cvg of up to 0.60”
and local amts to 1.20”
Aug 2-4 60% cvg of up to 0.60”
and local amts to 1.25”
Aug 4-6 55% cvg of up to 0.50”
and locally more
Aug 5-7 60% cvg of up to 0.60”
and locally more
U.S. DELTA/SOUTHEAST SIGNIFICANT PRECIPITATION EVENTS
DELTA SOUTHEAST
Tdy-Fri Up to 15% daily cvg of
up to 0.20” and locally
more each day; some
days may be dry
Tdy-Tue 50-75% daily cvg of
up to 0.75” and local
amts over 1.50” each
day; wettest NE;
driest west
Wed-Fri 65% cvg of up to 0.75”
and local amts to 1.50”;
driest west
Sat-Jul 30 80% cvg of up to 0.75”
and local amts over 2.0”;
far south driest
Sat 25% cvg of up to 0.40”
and locally more;
wettest NE
Sun-Jul 31 80% cvg of up to 0.75”
and local amts over 2.0”
Jul 31 30% cvg of up to 0.50”
and locally more;
wettest south
Aug 1-3 10-25% daily cvg of 20-40% daily cvg of
up to 0.35” and locally up to 0.70” and locally
more each day more each day
Aug 4-6 15-35% daily cvg of 30-50% daily cvg of
up to 0.50” and locally up to 0.75” and locally
more each day more each day
Source: World Weather Inc. and FI
MONDAY, JULY 23:
- China scheduled to release June commodities trade data, including imports of palm oil, cotton, corn, wheat, sugar, 2:30am ET (2:30pm Beijing)
- NOTE: China will skip some data, including country breakdown details
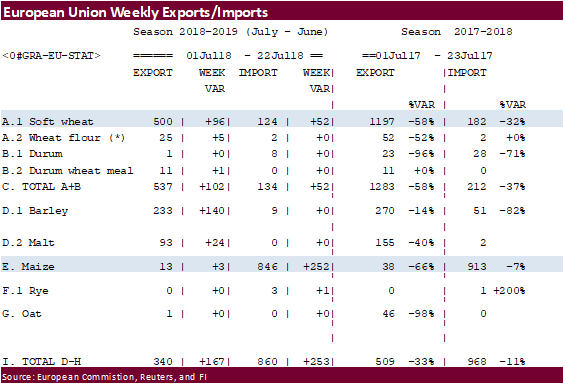
- EU weekly grain, oilseed import and export data, 10am (3pm London)
- EU’s monthly (MARS) report on European crop progress and weather conditions, with scorching heat already ruining the grain harvest
- USDA weekly corn, soybean, wheat export inspections, 11am
- U.S. cold storage report for June, 3pm
- USDA weekly crop progress report, 4pm
- Ivory Coast weekly cocoa arrivals
- Datagro hosts Global Agribusiness Forum, Sao Paulo, 1st day of 2. Speakers include Brazilian Agriculture Minister Blairo Maggi, executives from Minerva, John Deere, Copersucar and Cofco
TUESDAY, JULY 24:
- Wheat Quality Council’s U.S. spring wheat crop tour begins in North Dakota, with final data expected Thursday
- Grain World crop tour in Canada hosted by FarmLink begins in Manitoba, Saskatchewan and Alberta, with final data for spring wheat, canola, durum and pulses expected Thursday
- Allendale holds webinar on weather outlook, 3pm ET (2pm CST)
- Datagro’s Global Agribusiness Forum in Sao Paulo, final day
WEDNESDAY, JULY 25:
- Costa Rica public holiday; Pakistan holds general election
- Cargo surveyors AmSpec, Intertek to release data on Malaysia’s July 1-25 palm oil exports, 11pm ET Tuesday (11am Kuala Lumpur Wednesday); SGS data for same period, 3am ET Wednesday (3pm local time Wednesday)
- EIA U.S. weekly ethanol inventories, output, 10:30am
- Allendale holds webinar on grains and oilseeds, 3pm ET (2pm CST)
- U.S. poultry slaughter June, 3pm
- Wheat Quality Council’s U.S. spring wheat crop tour, 2nd day
- Grain World crop tour in Canada, 2nd day
- EARNINGS: Coca-Cola
THURSDAY, JULY 26:
- Intl Grains Council monthly grains report, 8:30am ET (1:30pm London)
- USDA weekly net-export sales for corn, wheat, soy, cotton, 8:30am
- Allendale holds webinar on livestock outlook, 3pm ET (2pm CST)
- Port of Rouen data on French grain exports
- Buenos Aires Grain Exchange weekly crop report
- Wheat Quality Council’s U.S. spring wheat crop tour, 3rd day
- Grain World crop tour in Canada, final day
- Bloomberg weekly survey of analysts’ expectations on grain, sugar prices
- World Trade Organization holds a General Council meeting that will last through July 27 to cover issues related to the U.S.-China trade conflict
- EARNINGS: Nestle SA, Anheuser-Busch Inbev, Diageo Plc
FRIDAY, JULY 27:
- Thailand, Peru public holidays
- G20 Agriculture ministers meet in Buenos Aires
- ICE Futures Europe commitments of traders weekly report on coffee, cocoa, sugar positions, ~1:30pm ET (~6:30pm London)
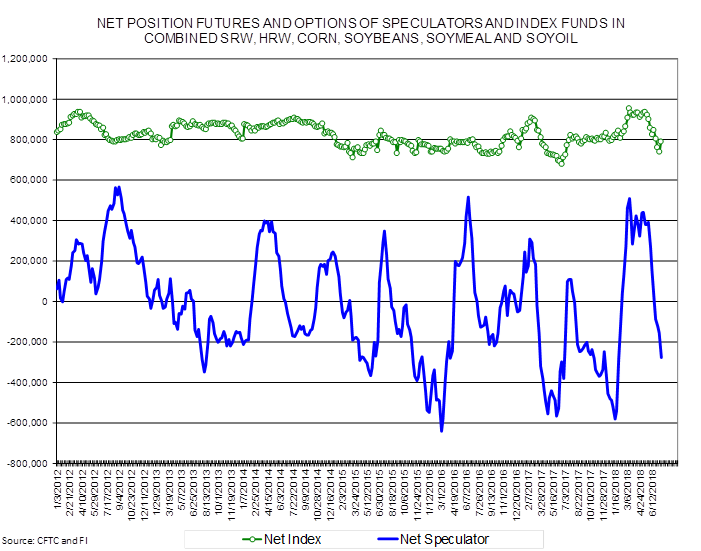
- CFTC commitments of traders weekly report on positions for various U.S. futures and options, 3:30pm
- FranceAgriMer weekly updates on French crop conditions
Source: Bloomberg and FI
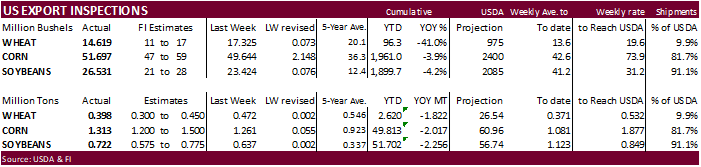
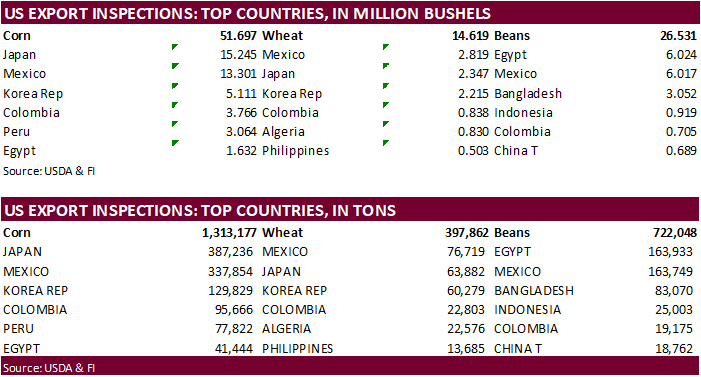
USDA inspections versus Reuters trade range
Wheat 397,862 versus 300,000-500,000 range
Corn 1,313,177 versus 950,000-1,400,000 range
Soybeans 722,048 versus 450,000-750,000 range
GRAINS INSPECTED AND/OR WEIGHED FOR EXPORT
REPORTED IN WEEK ENDING JUL 19, 2018
— METRIC TONS —
————————————————————————-
CURRENT PREVIOUS
———– WEEK ENDING ———- MARKET YEAR MARKET YEAR
GRAIN 07/19/2018 07/12/2018 07/20/2017 TO DATE TO DATE
BARLEY 0 73 0 880 5,319
CORN 1,313,177 1,261,026 983,291 49,812,748 51,830,170
FLAXSEED 24 0 539 48 3,281
MIXED 0 0 0 24 24
OATS 0 0 0 1,098 1,297
RYE 0 0 0 0 0
SORGHUM 12,078 744 106,940 4,798,198 5,305,244
SOYBEANS 722,048 637,486 641,814 51,702,357 53,958,140
SUNFLOWER 0 0 0 335 383
WHEAT 397,862 471,514 504,072 2,620,386 4,442,330
Total 2,445,189 2,370,843 2,236,656 108,936,074 115,546,188
————————————————————————-
CROP MARKETING YEARS BEGIN JUNE 1 FOR WHEAT, RYE, OATS, BARLEY AND
FLAXSEED; SEPTEMBER 1 FOR CORN, SORGHUM, SOYBEANS AND SUNFLOWER SEEDS.
INCLUDES WATERWAY SHIPMENTS TO CANADA.
Corn.
- Corn ended higher on light technical buying and a mostly higher trade in US wheat. Net drying across the southern areas of the WCB also provided some support.
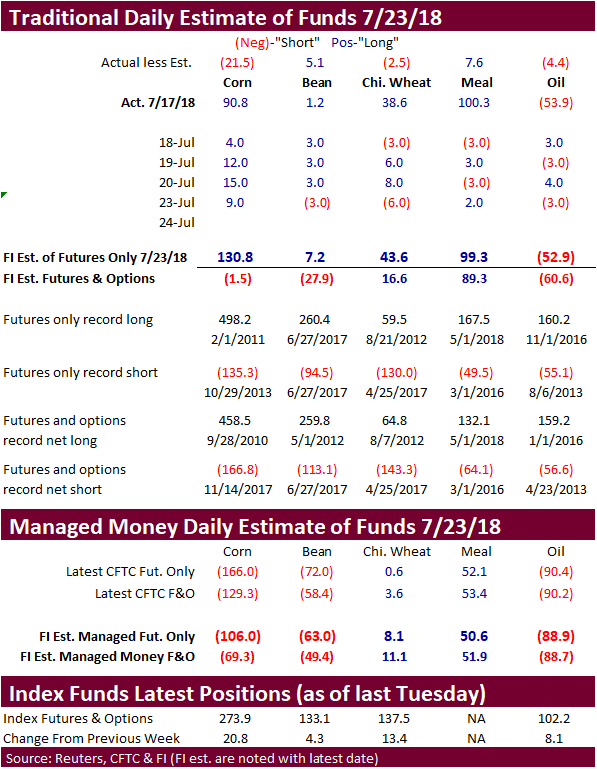
- Funds bought an estimated net 9,000 corn contracts.
- We picked up that Canada has been selling corn to the EU for OND and April/May shipment.
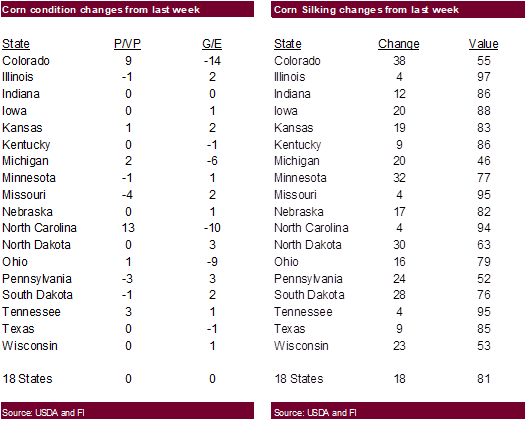
· The USDA crop progress report showed US corn conditions unchanged at 72 percent, one point above trade expectations.
· Our corn crop year weighted index increased 0.2% to 83.4, 3.1 percent above year ago and 1.0% above a 5-year average.
· We increased our US corn yield to 179.0 bushels per acre from 178.5 last week, which increased US corn production by 41 million bushels to 14.625 billion bushels, 21 million above last year and 395 million above USDA’s July estimate of 14.230 billion.

- South Africa’s CEC is due to update their 2018 corn production on Thursday and traders are looking for a slight increase to 13.305 million tons form 13.207 million previously. USDA is at 13.8 million tons, down from 17.55 million in 2017.
· EU’s crop monitoring service (MARS) increased its 2018 corn yield to 7.64 tons/hectare from 7.35 last month.
· China plans to inspect all of its grain reserve facilities through October 2019 to update volume and quality figures.
· China imported 450,000 tons of sorghum in June, up from 324,301 tons last year and down from 470,000 tons in May. Jan-June sorghum imports of 3.25 million tons were up 8.7 percent from a year ago.
· China imported 520,000 tons of corn in June, down from 760,000 tons in May but up 35 percent from June 2017. Jan-June corn imports were 2.21 million tons, about three times greater than the same period a year ago.
· China imported 98,566 tons of pork in June.
· Brazil will soon raise import quotas for US pork.
· China sold about 55.6 million tons of corn out of reserves this season.
Soybean complex.
· Soybeans snapped a 5-day winning streak after ended lower.
· The US weather forecast is calling for net drying across the WCB and northern Delta this week. This provided support early but a cancellation by China for new-crop US soybeans renewed concerns with China/US trade relations.
· CBOT soybean meal ended higher and soybean oil lower.
· Funds sold an estimated net 3,000 soybean contracts, bought 2,000 meal and sold 3,000 soybean oil.
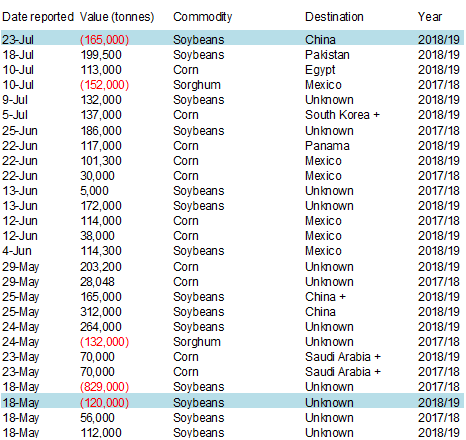
· Under the 24-hour reporting system, US exporters reported the cancelation of 165,000 tons of soybeans for new-crop delivery. We are not totally sure, but this could be the first new-crop soybean cancellation by China.
· President Trump plans to visit Dubuque, IA on Thursday. We may learn more if more agriculture groups are turning up the pressure to resolve the trade dispute.
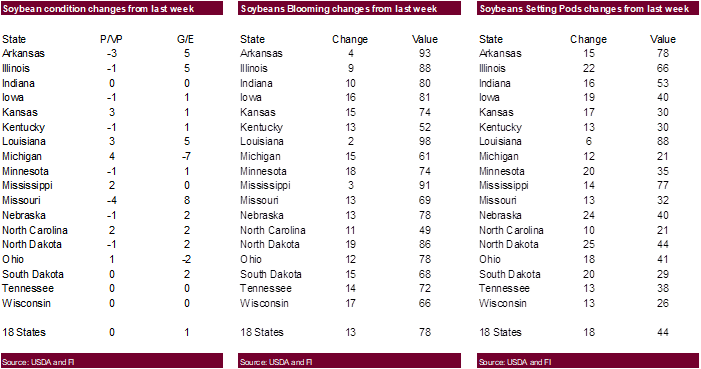
· US soybean conditions increased unexpectedly by one point to 70 percent, 2 points above expectations.
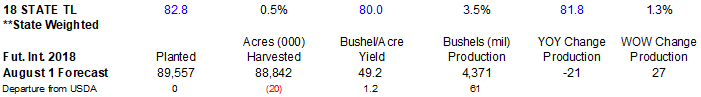
· On a weighted basis our US soybean index increased 0.5% to 82.8, 3.5 percent above last year and 1.3 percent above a 5-year average.
· We increased our soybean yield by 0.5/bu per acre to 49.2 bushels. Our production estimate is 4.371 billion bushels, 27 million above the previous week and 61 million above USDA’s 4.310 billion projection.
· Commercial interest on Monday was slow.
· EU’s crop monitoring service (MARS) decreased its 2018 rapeseed yield to 2.89 tons/hectare from 3.05 last month.
· Brazil soybean premiums firmed on Monday by 5-20 cents in the nearby fob positions.
· Brazil’s Abiove increased its Brazil soybean production to 118.7 million tons for 2017-18 from 118.4 million in May. Soybean exports were seen at 73.5 million tons, up from 72.1 million tons in May. Soybean crushing was seen at 43.6 million tons versus 43.6 million previously.
· Consultancy Corteva Agriscience estimated the soybean area in 2018-19 could increase 3 to 5 percent. That translates up to 37 million hectares (91.4 million acres), according to Reuters, using the current 35.15 million for 2017-18.
· Chinese soybean crusher Shandong Sunrise Group has filed for bankruptcy. They were unable to repay debts.
· Reuters noted China soybean crushers in Shandong were losing nearly 50 yuan ($7.40) per ton, via Shanghai JC Intelligence.
· September Malaysian palm was 25 lower at MYR2169, and cash down $5.00 at $565.00/ton.
· There is talk palm oil production will increase over the next few weeks.
· Offshore values were leading soybean oil 30 points lower and meal $0.60/short ton higher.
- Last week the CCC bought 12,500 tons of soybean meal for Honduras for Oct 1-10 shipment at $402.89/ton fob.
- South Korea seeks 1,500 tons of non-GMO soybeans on July 25 for September-December delivery.
- Iran seeks 30,000 tons of soybean oil on August 1.
· China sold 972,370 tons of soybeans out of reserves so far, this season.
- Pakistan bought 360,000 tons of US and/or Brazil soybeans over the past couple weeks, bringing purchases to 600,000 tons over the past month. They have been buying for October through March shipment.
· Under the 24-hour reporting system, US exporters reported the cancelation of 165,000 tons of soybeans for new-crop delivery. We are not totally sure, but this could be the first new-crop soybean cancellation by China, at least what is reported in the 24-hour reporting system.
· Chicago wheat ended mixed after spreads collapsed. The back months were able to sustain gains, possibly in part to tighter 2018-19 global stocks for many regions of the world. Note we are long-term bullish wheat. See our short blubs after these bullets.
· Global cash prices appreciated over the past week and this sentiment spilled over into MN contracts.
· KC and MN ended higher led by MN.
· Funds today sold an estimated net 6,000 SRW wheat contracts.
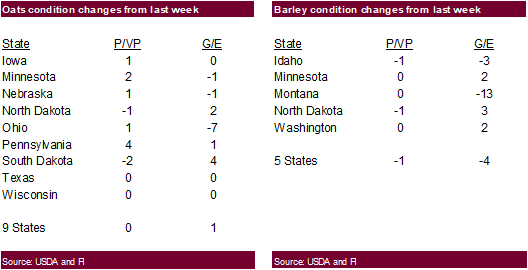
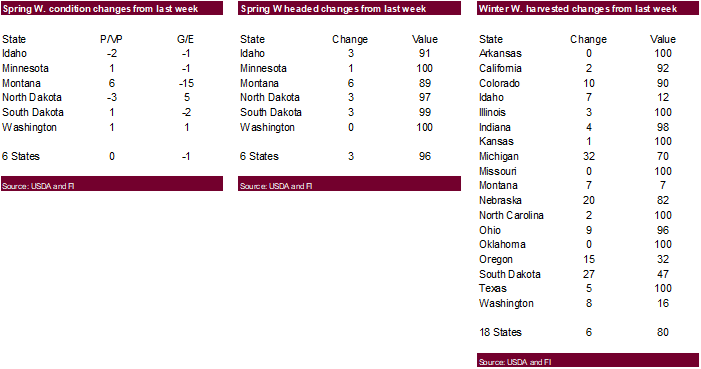
· US spring wheat conditions decreased 1 point to 79 percent, highest level for this time of year since 2010. The trade was looking for unchanged.
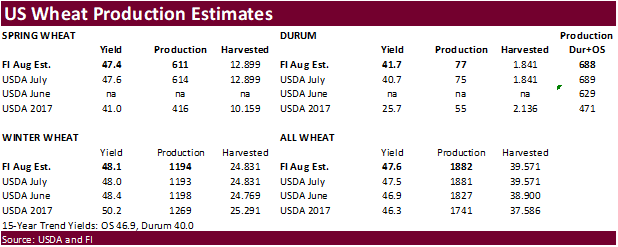
· Our spring wheat weighted rating did not change much from the previous week. A drop in the MT ratings was partially offset by an increase in ND. There was no change to our spring and durum wheat production estimates from the previous week.
· US winter wheat harvesting progress increased 6 points to 80 percent, 3 points below average.
· December Paris wheat futures ended 1.50 euros higher at 194.75 euros, at a three-year high.
· EU’s crop monitoring service (MARS) decreased its 2018 soft wheat yield to 5.82 tons/hectare from 6.04 last month. They lowered barley to 4.74 from 4.98 and increased corn to 7.64 from 7.35 last month.
· The European Union granted export licenses for 96,000 tons of soft wheat imports, bringing cumulative 2018-19 soft wheat export commitments to 0.500 million tons, well down from 1.197 million tons committed at this time last year.
· Russia wheat export prices were up last week.
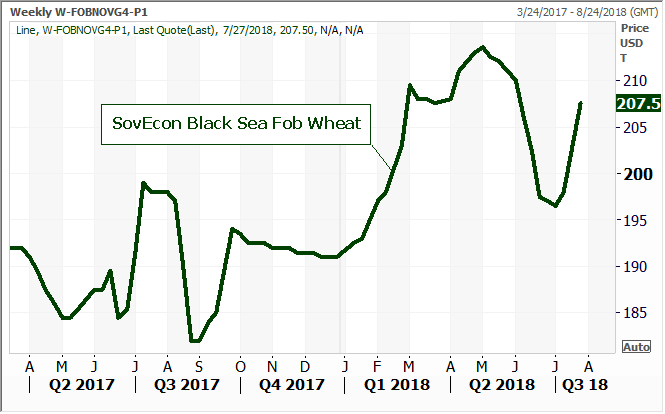
· IKAR noted Black Sea prices for Russian wheat with 12.5 percent protein content for delivery in August were $211 per ton fob, up $11.50 from a week earlier. SovEcon reported Black Sea FOB prices for wheat were at $207.5 a ton, up $9.50. Russian barley prices increased $13.00 to $203.5 per ton. Russia’s central regions has seen poor growing conditions this year.
· China imported 310,000 tons of wheat in June, down 33.6 percent from a year ago. Jan-Jun wheat imports were 1.95 million tons, down 26.4 percent from the same period a year ago.
· China imported 590,000 tons of barley in June, down 5.6 percent from a year ago. Jan-June barley imports were 4.4 million tons, down 2.7 percent.
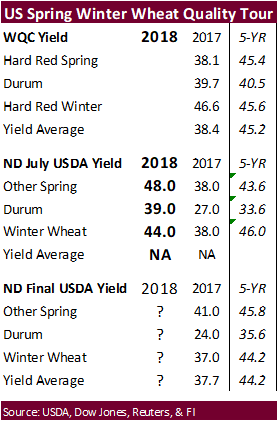
- On Tuesday the Wheat Quality Council’s U.S. spring wheat crop tour begins in North Dakota. Results are due out Thursday.
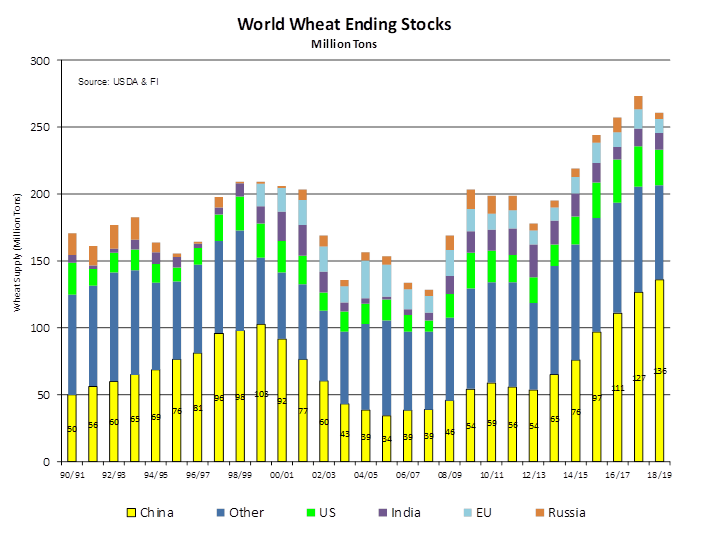
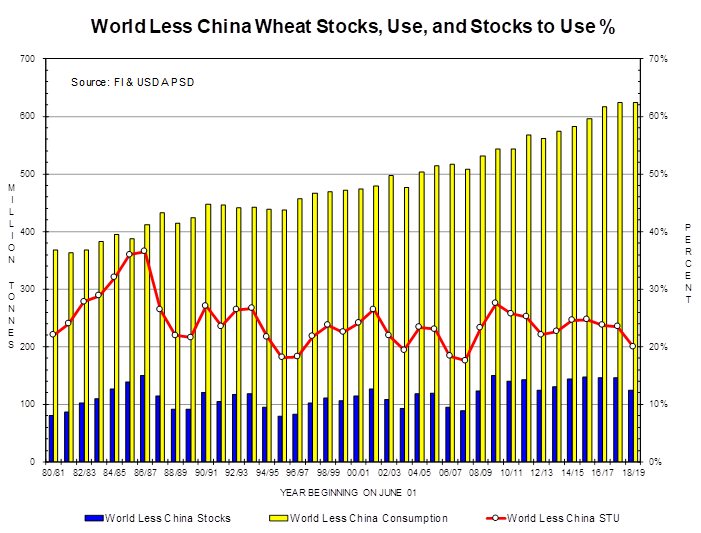
We would be LT buyers of wheat. According to USDA’s latest PSD data, China accounts for 52 percent of all world wheat ending stocks for 2018-19. When you remove China, the world wheat STU would be the tightest since 2007-08, a year when prices were high. See graphs below, and try to imagine a global balance sheet without China, and expectations for world supply to further tighten from current estimates amid global weather problems.
Export Developments.
· Egypt is in for wheat for September 1-10 shipment.
· Iraq seeks 50,000 tons of US, Canadian, and/or Australian wheat on July 29, valid until August 2.
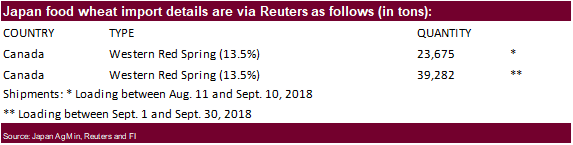
· Japan is back in the market for 62,957 tons of food wheat, all from Canada, on Thursday.
· Jordan seeks 120,000 tons of wheat on July 26 for Sep-Nov shipment.
· Jordan seeks 120,000 tons of barley on July 24.
- Japan in a SBS import tender seeks 120,000 tons of feed wheat and 200,000 tons of barley on July 25 for arrival by December 28.
- Bahrain Flour Mills seeks 17,000 tons of semi-hard wheat and 8,000 tons of hard wheat, on July 24, valid until July 25, for shipment in late Aug/early Sept. Origins include Australia, Baltics, & Canada.
- Bangladesh seeks 50,000 tons of optional origin milling wheat on July 25 for shipment within 40 days of contract signing.
Rice/Other
- China sold 60,174 tons of rice out of auction at an average price of 2621 yuan per tons ($387.50/ton), 6 percent of what was offered.
- Results awaited: Thailand seeks to sell 120,000 tons of raw sugar on July 18.
· Results awaited: Mauritius seeks 6,000 tons of white rice for Sep 1-Nov 30 shipment.
Terry Reilly
Senior Commodity Analyst – Grain and Oilseeds
Futures International │190 S LaSalle St., Suite 410│Chicago, IL 60603
W: 312.604.1366
AIM: fi_treilly
ICE IM: treilly1
Skype: fi.treilly

Trading of futures, options, swaps and other derivatives is risky and is not suitable for all persons. All of these investment products are leveraged, and you can lose more than your initial deposit. Each investment product is offered only to and from jurisdictions where solicitation and sale are lawful, and in accordance with applicable laws and regulations in such jurisdiction. The information provided here should not be relied upon as a substitute for independent research before making your investment decisions. Futures International, LLC is merely providing this information for your general information and the information does not take into account any particular individual’s investment objectives, financial situation, or needs. All investors should obtain advice based on their unique situation before making any investment decision. The contents of this communication and any attachments are for informational purposes only and under no circumstances should they be construed as an offer to buy or sell, or a solicitation to buy or sell any future, option, swap or other derivative. The sources for the information and any opinions in this communication are believed to be reliable, but Futures International, LLC does not warrant or guarantee the accuracy of such information or opinions. Futures International, LLC and its principals and employees may take positions different from any positions described in this communication. Past results are not necessarily indicative of future results.