From: Terry Reilly
Sent: Wednesday, August 15, 2018 5:30:58 PM (UTC-06:00) Central Time (US & Canada)
Subject: FI Evening Grain Comments 08/15/18
PDF attache
· The Northern U.S. Delta and Tennessee River Basin will see good rains.
· West Texas will see rain this weekend.
· Canada’s Prairies will receive scattered showers and thunderstorms during the coming week.
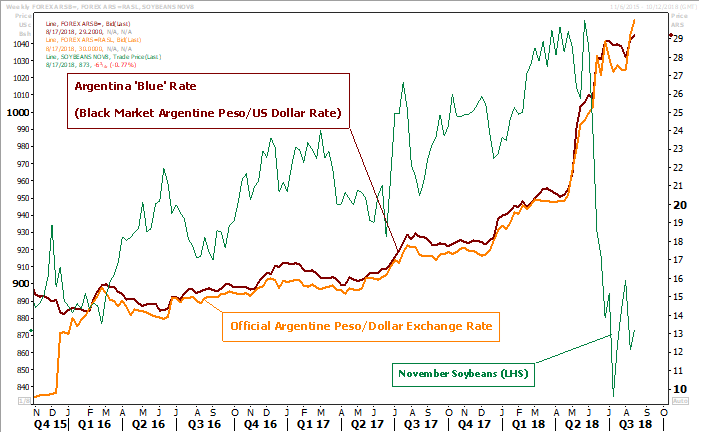
· Argentina will receive rain in the central and east this weekend.
Source: World Weather and FI
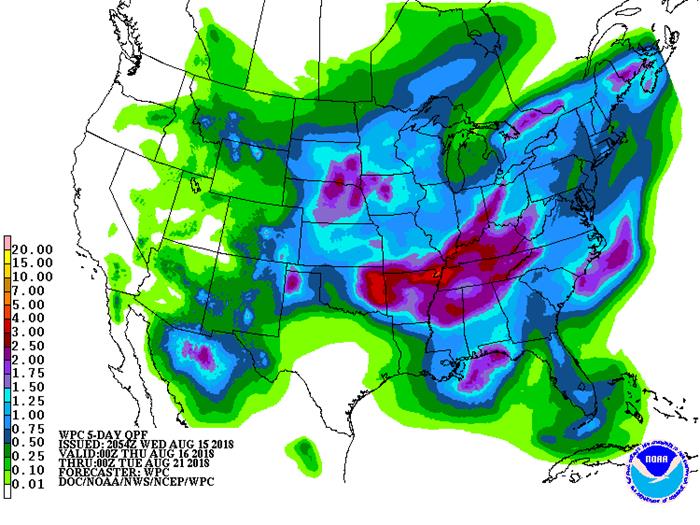
SIGNIFICANT CORN AND SOYBEAN BELT PRECIPITATION EVENTS
WEST CORN BELT EAST CORN BELT
Tdy-Fri 90-100% cvg of 0.20-1.30”
and local amts over 2.50”;
wettest SW
Thu-Fri 50% cvg of up to 0.60”
and local amts to 2.0”;
Neb. to Mo. wettest;
driest NW
Sat 15% cvg of up to 0.30” 20% cvg of up to 0.75”
and locally more; and local amts to 1.50”;
S.D. wettest wettest south
Sun 10% cvg of up to 0.20”
and locally more
Sun-Mon 80% cvg of up to 0.75”
and local amts over 2.0”;
far NW driest
Mon-Tue 75% cvg of up to 0.65”
and local amts to 1.35”
Tue 15% cvg of up to 0.20”
and locally more
Aug 22 15% cvg of up to 0.20”
and locally more
Aug 22-23 20% cvg of up to 0.60”
and locally more;
far south wettest
Aug 23-24 20% cvg of up to 0.60”
and locally more;
wettest south
Aug 24-26 45% cvg of up to 0.75”
and locally more;
wettest north
Aug 25-27 50% cvg of up to 0.60”
and locally more
Aug 27-29 40% cvg of up to 0.60”
and locally more
Aug 28-30 60% cvg of up to 0.50”
and locally more
U.S. DELTA/SOUTHEAST SIGNIFICANT PRECIPITATION EVENTS
DELTA SOUTHEAST
Tdy-Thu 15-30% daily cvg of
up to 0.75” and locally
more each day;
driest NE
Tdy-Fri 60% cvg of 0.60-2.0”
and local amts to 3.0”
north with up to 0.60”
and locally more in
central and southern
areas
Fri-Sun 85% cvg of 0.35-1.50”
and local amts over 3.0”
from east Ms.to west
Ga. with up to 0.75”
and local amts to 2.0”
elsewhere
Sat-Sun 65% cvg of up to 0.75”
and local amts to 1.75”;
driest south
Mon-Tue 75% cvg of up to 0.55”
and local amts to 1.20”
Mon-Aug 22 80% cvg of up to 0.65”
and local amts to 1.40”
Aug 22 15% cvg of up to 0.20”
and locally more
Aug 23-24 50% cvg of up to 0.65”
and local amts to 1.40”;
wettest north
Aug 23-25 60% cvg of up to 0.75”
and locally more
Aug 25-29 5-20% daily cvg of up
to 0.30” and locally
more each day
Aug 26-29 15-35% daily cvg of
up to 0.60” and locally
more each day
Source: World Weather and FI
Bloomberg weekly agenda
WEDNESDAY, AUG. 15:
- India on holiday
- Cargo surveyors Intertek, AmSpec release respective data on Malaysia’s Aug. 1-15 palm oil exports, 11pm ET Tuesday (11am Kuala Lumpur Wednesday)
- SGS data for same period, 3am ET Wednesday (3pm Kuala Lumpur Wednesday)
- EIA U.S. weekly ethanol inventories, output, 10:30am
- National Oilseed Processors Association report on U.S. soybean processing data, noon
- The Salvadoran coffee council releases monthly El Salvador export data
THURSDAY, AUG. 16:
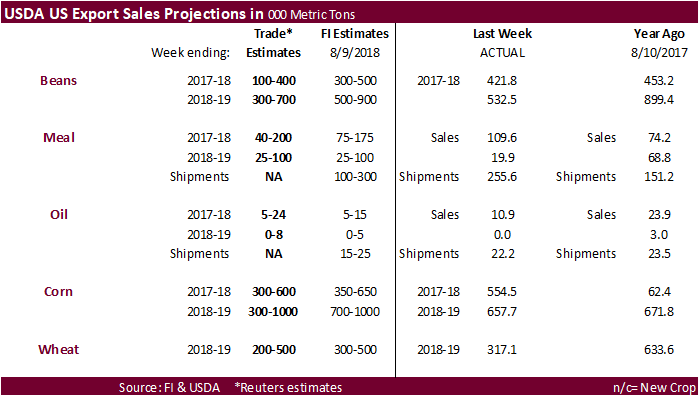
- USDA weekly net-export sales for corn, wheat, soy, cotton, 8:30am
- Port of Rouen data on French grain exports
- Buenos Aires Grain Exchange weekly crop report
- Bloomberg weekly survey of analysts’ expectations on grain, sugar prices
FRIDAY, AUG. 17:
- FranceAgriMer weekly updates on French crop conditions
- ICE Futures Europe commitments of traders weekly report on coffee, cocoa, sugar positions, ~1:30pm ET (~6:30pm London)
- CFTC commitments of traders weekly report on positions for various U.S. futures and options, 3:30pm
- EARNINGS: Deere & Co.
· Retail Sales Advance (M/M) (Jul): 0.5% (est 0.1% prevR 0.3%)
– Retail Sales Ex Auto (M/M) (Jul): 0.3% (est 0.6%, prevR 0.2%)
– Retail Sales Ex Auto (M/M) (Jul): 0.4% ( est 0.4% prevR 0.2%)
– Retail Sales Ex Auto And Gas (Jul) 0.5% (est 0.4%, prevR-0.1%)
Corn.
- Corn traded tow-sided, ending unchanged to slightly lower. Basis September corn, the 20 and 50-day MA’s crossed for the first time since June 18.
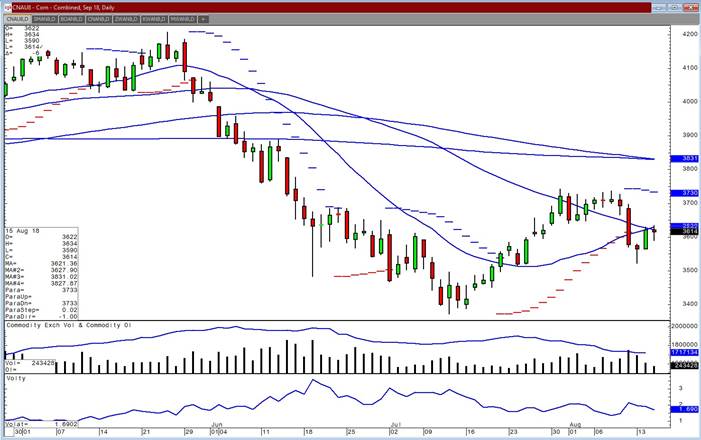
- We still see corn prices remaining in a two-sided trading range over the short term.
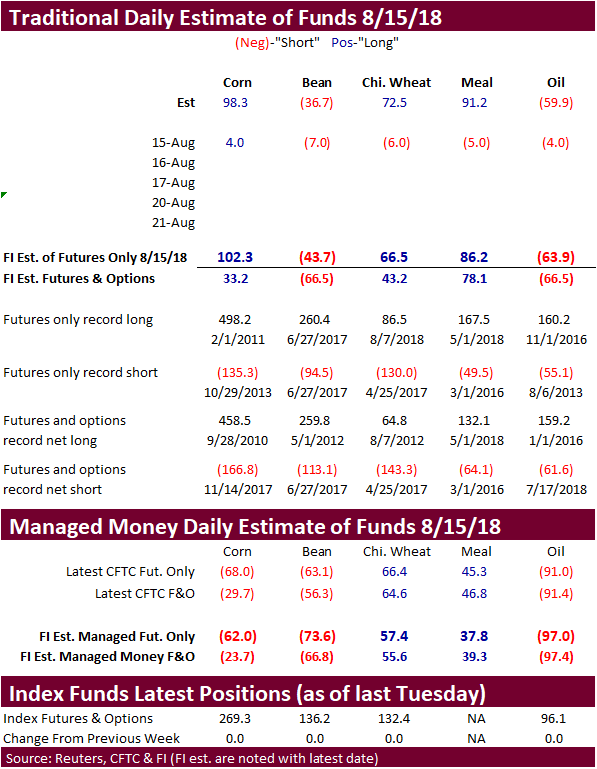
- The funds bought an estimated net 4,000 corn contracts.
- WTI crude was down nearly $2 for most contracts.
- Most of Europe was on holiday.
- The USDA Turkey Hatchery report showed eggs in Incubators on August 1 Down 4 percent from last year, poults hatched during July up 3 percent from last year. Net poults placed during July up 4 percent from last year.
- USDA’s Broiler Report showed broiler-type eggs set in the United States up 1 percent and chicks placed up slightly. Cumulative placements from the week ending January 6, 2018 through August 11, 2018 for the United States were 5.89 billion. Cumulative placements were up 1 percent from the same period a year earlier.
- USDA announced it will buy $50 million worth of fluid milk for food assistance programs, but says the purchase is not part of the Trump Administrations tariff relief package for dairy. https://www.milkbusiness.com/article/usda-to-purchase-50-million-fluid-milk
- African swine fever discovered earlier this month resulted in the culling of more than 8,000 hogs in Liaoning. Yesterday China’s AgMin confirmed an outbreak of foot and mouth disease in its central province of Henan.
- Argentina’s BA Grains Exchange put the upcoming corn area at 5.8 million hectares, up from 5.4 million planted in 2017. Rosario is using 6.8 million hectares with output at 45 to 46 million tons.
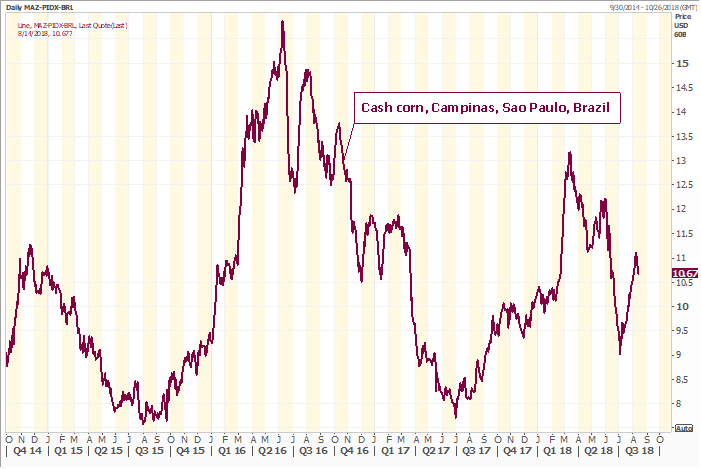
- Safras & Mercado reported Brazil corn prices rose 14 percent since early July as winter corn production could end up 27 percent below 2017. This is bullish US corn exports.
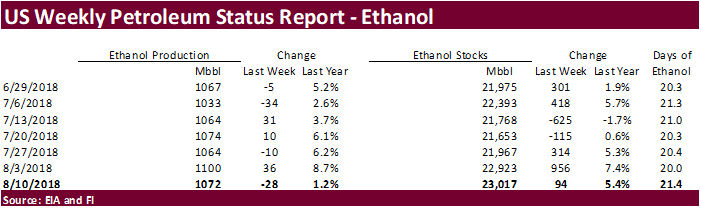
- The US weekly EIA ethanol data was negative for US corn futures, in our opinion.
- Production decreased 28,000 barrels per day to 1.072 million barrels per day (bbl) and stocks increased 94,000 to 23.017 million.
- A Bloomberg poll called for US ethanol production to fall 14,000 million/day and stocks to increase 59,000 barrels.
- US ethanol production of 1.072 million barrels per day is still up 1.2% from about the same time a year ago, and running near a record.
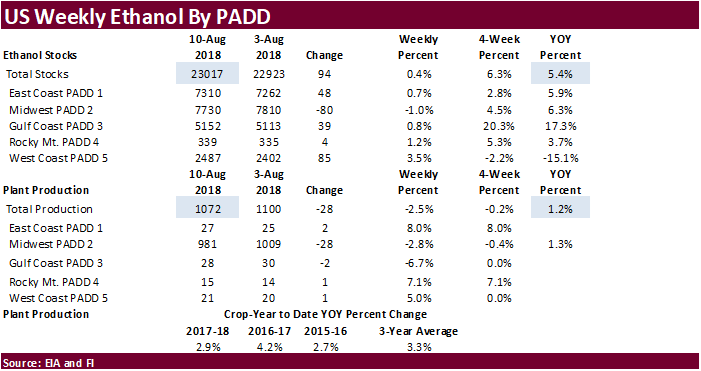
- Padd2 production was 981,000 barrels, down 28,000 from a week earlier.
- September 2017 to date US ethanol production is running 2.9% above the same period a year ago.
- There were no imports reported this week.
- Ethanol stocks of 23.017 million barrels are up 6.3% from four weeks ago and up 5.4% from a year ago.
- Ethanol stocks were higher since mid-March 2017.
- Days of inventory of 21.4 compares to 21.0 a month ago and 20.2 during comparable period a year ago.
- Weekly ending stocks of total gasoline were down 0.740 million barrels to 233.1 million barrels.
- The net blender input of fuel ethanol was up 7,000 from the previous week at 948,000 bpd, above its 4-week average of 936,000 bpd.
- Net production of finished reformulated and conventional motor gasoline with ethanol, increased 67,000 to 9.377 million barrels, or 91.3 percent of the net production of all finished motor gasoline, up from up from 91.2 percent for the previous week.
- Our 2017-18 crop-year corn for ethanol usage is 5.635 billion bushels, above USDA’s current estimate of 5.600 and compares to 5.432 billion for 2016-17. USDA looks for 2018-19 US corn for ethanol use at 5.525 billion bushels.
· Under the 24-hour reporting system, private exporters reported export sales of 114,572 tons of corn for delivery to unknown destinations. Of the total 55,000 tons is for delivery during the 2017/2018 marketing year and 59,572 tons is for delivery during the 2018/2019 marketing year.
· China sold about 61.4 million tons of corn out of reserves this season. Another 8 million tons will be offered this week.
Soybean complex.
· The soybean complex ended lower in part to prices giving back gains from yesterday. The USD hit a June 2017 high, so traders are getting anxious that the higher USD will start to impact US agriculture exports.
· Turkish import tariffs against the US sparked selling in US equities that could have spilled over into the commodity markets. Apprehensiveness for escalating US mercantile relations with countries beyond China and NAFTA are increasing. Caveat emptor. We don’t know how many more trading sessions will result in lower prices based on trade fears.
· Sharply lower WTI added pressure to soybean oil. September soybean oil could test or trade at a fresh contract low this week.
· This is the third consecutive day the September soybean contract settled below its 20-day MA. September soybean meal ended below its 20-day MA.
· NOPA reported a bullish US soybean crush for the month of July. Soybean oil stocks were also supportive, in our opinion. They report was widely overlooked.
· Funds sold an estimated net 7,000 soybeans, sold 5,000 soybean meal, and sold 4,000 soybean oil.
· Ukraine started rapeseed plantings for 2019 harvest.
· Brazil soybean plantings start around mid-September.
· October Malaysian palm was lower overnight by 18 ringgits.
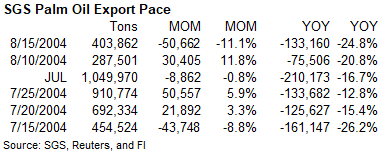
· AmSpec reported palm exports at 415,719 tons, down 14.6 percent from the previous period last month.
NOPA crush exceeds expectations.
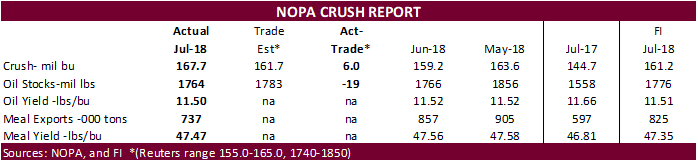
- NOPA reported a record (for the month) July crush of 167.7 million bushels, 8.5 million above June well above 144.7 million in July 2017. On a daily adjusted basis, it was remarkably 103,000 bushels per day higher than the average June daily rate, a 1.9% increase. This was not expected given the amount of downtime during July.
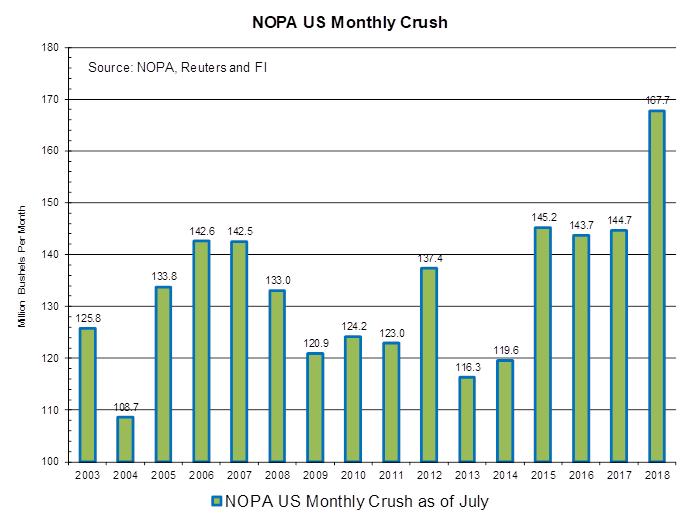
- The July crush of 167.733 million bushels ranks as the second highest monthly crush in our recorded history, behind 171.858 million in March 2018. On a daily basis, the July crush ranked 4th highest for any month. The Illinois region posted a record crush for the month of July. IA was not a record. Southeast and southwest regions posted a record for comparable July’s.
- Soybean oil stocks came in 19 million pounds less than the average trade guess. This translate to much higher use than expected. At 1.764 billion pounds, its 2 million less than the end of June and compares to 1.558 billion at the end of July 2017. July NOPA soybean oil stocks are the largest for that month since 2013.
- The soybean oil yield fell 2 tenths to 11.50 pounds per bushel. Last July it was 11.66 pounds per bushel.
- July soybean oil production was 1.929 million pounds, second highest in our monthly history, behind 1.977 million in March 2018.
- The soybean meal yield in July was 47.47, below 47.56 in June but up from 46.81 in July 2017.
- July soybean meal production was 3.961 million short tons, second highest for any month behind 4.083 million short tons in March 2018.
- Soybean meal exports were robust at 737,000 short tons, and a record for the month, but did fall below our expectations and were below 857,000 short tons in June and above 597,000 short tons in July 2017.
- We look for end of July NASS soybean meal stocks to fall between the 425-455 thousand ton range, above 399 thousand tons at the end of June and compares to 424 thousand at the end of July 2017.
- Even with only one month of reporting left, we will likely increase our 2.041 billion bushel crush estimate (Sep-Aug) by 11-13 million bushels. USDA is at 2.040 billion. Any feedback on August downtime is welcome.
Source: Reuters and FI
Export Developments
· China sold 127,270 tons of 2013 soybeans at auction at an average price of 3,012 yuan/ton ($437.37/ton), 42% of what was offered. China sold 1.218 million tons of soybeans out of reserves so far, this season.
· China sold 20,113 tons of 2011 soybean oil at auction at an average price of 5,000 yuan/ton ($725.30/ton), 35.5% of what was offered.
· China sold 600 tons of rapeseed oil at auction at an average price of 6117 yuan/ton ($888.98/ton), 0.96% of what was offered.
- Iran seeks 30,000 tons of sunflower oil on September 24.
· US wheat ended lower after the USD reached its highest level since June 2017.
· Chicago and KC wheat remain at a two-week low.
· September KC today bounced off its 100-day MA.
· Volume was lower than normal.
· Funds sold an estimated net 6,000 SRW wheat contracts.
· EU December wheat was 0.50 euros lower at 207.50 euros.
· Ukraine harvested 33.4 million tons of grain so far, which includes early summer grain.
· UkrAgroConsult reported July wheat exports out of Ukraine at 959,960 tons.
Export Developments.
· Jordan bought 60,000 tons of hard milling wheat at $262/ton c&f for LH October shipment.
· Jordan seeks 120,000 tons of feed barley on August 28.
· Iraq seeks 50,000 tons of milling wheat on 8/15.
- Japan in a SBS import tender seeks 120,000 tons of feed wheat and 200,000 tons of barley on August 22 for arrival by January 31.
Rice/Other
· Egypt’s ESIIC seeks 100,000 tons (150k previously_ of raw sugar on Aug 18 for shipment within the first half of September and two 50,000-ton shipments from September 15-Oct 15.
· Thailand to sell 120k tons of raw sugar on Aug. 22.
Terry Reilly
Senior Commodity Analyst – Grain and Oilseeds
Futures International │190 S LaSalle St., Suite 410│Chicago, IL 60603
W: 312.604.1366
AIM: fi_treilly
ICE IM: treilly1
Skype: fi.treilly

Trading of futures, options, swaps and other derivatives is risky and is not suitable for all persons. All of these investment products are leveraged, and you can lose more than your initial deposit. Each investment product is offered only to and from jurisdictions where solicitation and sale are lawful, and in accordance with applicable laws and regulations in such jurisdiction. The information provided here should not be relied upon as a substitute for independent research before making your investment decisions. Futures International, LLC is merely providing this information for your general information and the information does not take into account any particular individual’s investment objectives, financial situation, or needs. All investors should obtain advice based on their unique situation before making any investment decision. The contents of this communication and any attachments are for informational purposes only and under no circumstances should they be construed as an offer to buy or sell, or a solicitation to buy or sell any future, option, swap or other derivative. The sources for the information and any opinions in this communication are believed to be reliable, but Futures International, LLC does not warrant or guarantee the accuracy of such information or opinions. Futures International, LLC and its principals and employees may take positions different from any positions described in this communication. Past results are not necessarily indicative of future results.