From: Terry Reilly
Sent: Thursday, September 13, 2018 4:32:02 PM (UTC-06:00) Central Time (US & Canada)
Subject: FI Evening Grain Comments 09/13/18
PDF attached
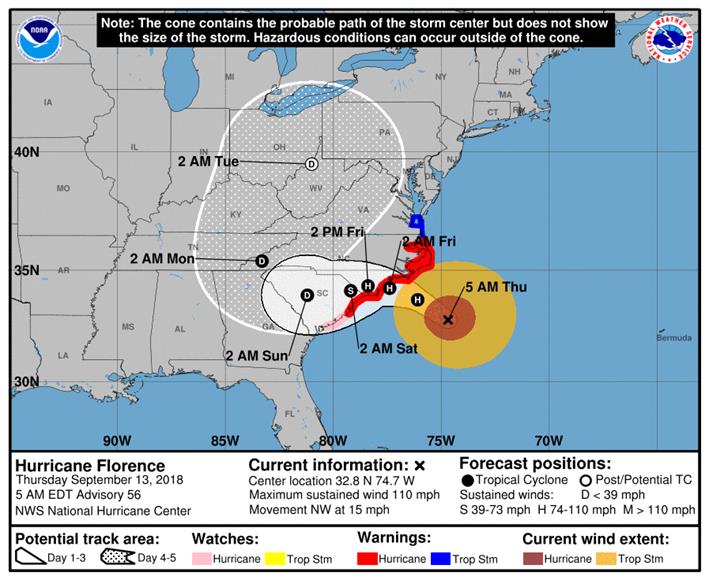
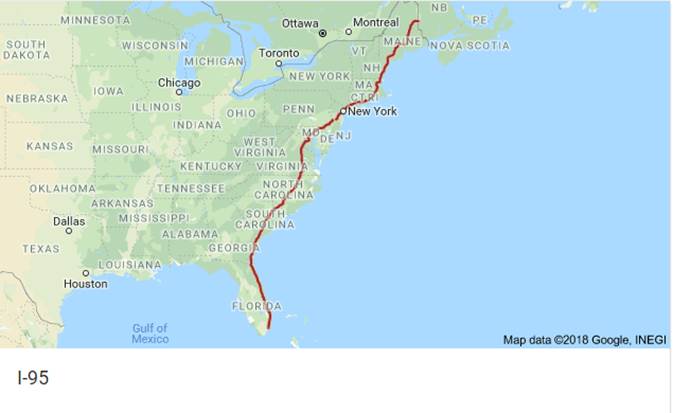
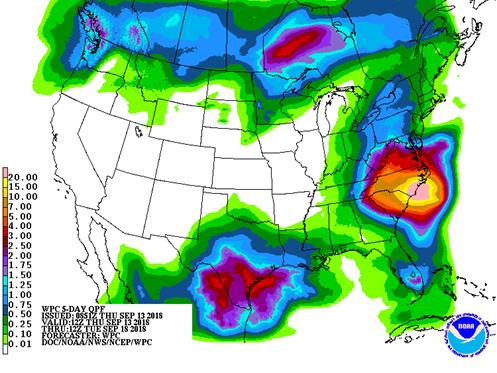
- Hurricane Florence may dump 15.00 to 30.00 inches of rain from the Interstate Highway 95 to the coast with 6.00 to 15.00 inches likely in a broad region surrounding this and extending into central South Carolina.
- Most WCB areas will be dry through Sunday with exceptions in the northwestern Corn Belt.
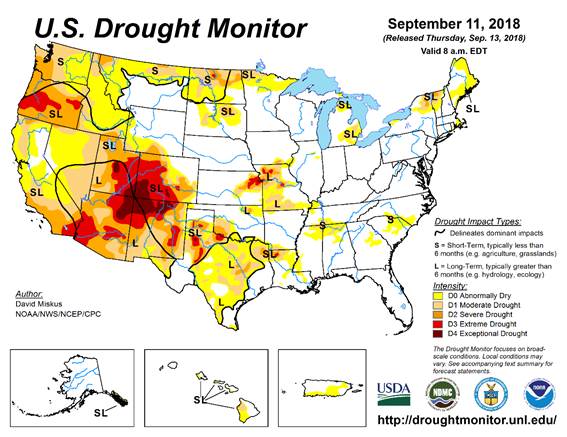
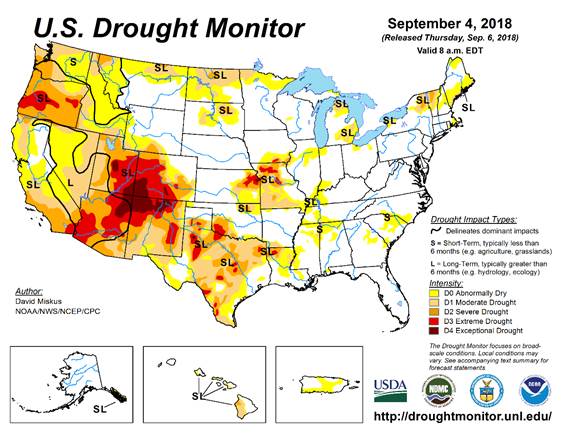
- The central and southern US Great Plains need rain.
- The eastern Midwest will see only little to no rain of significance through Sunday with portions of Ohio and eastern Kentucky seeing some rain from the remnants of Hurricane Florence Monday into Tuesday.
- Brazil’s weather outlook looks favorable for soybean and corn planting progress, which already started.
- Argentina will see additional rain by the end of the week.
- Alberta, Canada will get heavy snow (Thursday, Saturday and Sunday) and then a hard freeze which may negatively impact some immature crops.
- US HRW wheat country will see below average rainfall in the first week of the outlook.
SIGNIFICANT CORN AND SOYBEAN BELT PRECIPITATION EVENTS
WEST CORN BELT EAST CORN BELT
Tdy-Sat 10-20% daily cvg of 5-20% daily cvg of up
up to 0.40” and locally to 0.25” and locally
more each day; more each day;
wettest NW wettest east
Sun-Mon 30% cvg of up to 0.75”
and local amts to 1.50”;
wettest east
Sun-Tue 80% cvg of up to 0.75”
and local amts to 1.50”;
driest south and far NW
Tue-Wed 10-25% daily cvg of
up to 0.30” and locally
more each day
Wed-Sep 21 80% cvg of up to 0.75”
and local amts to 2.0”;
far NW driest
Sep 20-22 85% cvg of up to 0.75”
and local amts to 1.50”;
wettest north
Sep 22 20% cvg of up to 0.50”
and locally more
Sep 23-27 5-20% daily cvg of up 5-20% daily cvg of up
to 0.30” and locally to 0.30” and locally
more each day more each day
U.S. DELTA/SOUTHEAST SIGNIFICANT PRECIPITATION EVENTS
DELTA SOUTHEAST
Tdy-Sat 10-25% daily cvg of
up to 0.50” and locally
more each day;
wettest south
Sun Mostly dry with a few
insignificant showers
Mon-Sep 20 Up to 20% daily cvg of
up to 0.30” and locally
more each day; some
days may be dry
Tdy-Mon 70% cvg of 7.0-15.0”
with a few bands of
15.0-22.0” and locally
more from east-central
to central N.C. through
east-central and central
S.C. with 1.50-7.0” and
locally more elsewhere
in the Carolinas, south
Va. and nearby areas in
Ga. with up to 1.50” and
locally more elsewhere;
Rain is from
Hurricane Florence
Tue-Sep 21 10-25% daily cvg of
up to 0.50” and locally
more each day
Sep 21-23 80% cvg of up to 0.75”
and local amts to 1.50”
Sep 22-24 70% cvg of up to 0.75”
and local amts to 1.50
Sep 24-27 10-25% daily cvg of
up to 0.35” and locally
more each day
Sep 25-27 10-25% daily cvg of
up to 0.35” and locally
more each day
Source: World Weather and FI
FRIDAY, SEPT. 14:
- ICE Futures Europe commitments of traders weekly report on coffee, cocoa, sugar positions, ~1:30pm ET (~6:30pm London)
- CFTC commitments of traders weekly report on positions for various U.S. futures and options, 3:30pm
- FranceAgriMer weekly updates on French crop conditions
- Malaysia to announce crude palm oil export tax for October
Bloomberg weekly bull/bear survey (taken after the USDA report)
· Raw sugar survey results: Bullish: 5 Bearish: 1 Neutral: 1
· White sugar: Bullish: 4 Bearish: 1 Neutral: 2
· White-sugar premium: Widen: 0 Narrow: 3 Neutral: 4
· Wheat: Bullish: 3 Bearish: 4 Neutral: 4
· Corn: Bullish: 2 Bearish: 6 Neutral: 4
· Soybeans: Bullish: 2 Bearish: 8 Neutral: 2
· 9:18:03 am livesquawk US Pres Trump: We Are Under No Pressure To Make A Deal With China
· U.S. Plans `severe’ Russia sanctions by Nov. – Gov’t Official
· US Initial Jobless Claims w/e Sep 8: 204K (est 210K ; prevR 205K ; prev 203K)
US Continuing Jobless Claims w/e Sep 1: 1.696M (est 1.71M ; prevR 1.711M ; prev 1.707M)
· US Core CPI (M/M) SA Aug: 0.1% (est 0.2% ; prev 0.2%)
US Core CPI (Y/Y) NSA Aug: 2.2%(est 2.4% ; prev 2.4%)
US CPI (M/M) Aug: 0.2% (est 0.3% ; prev 0.2%)
US CPI (Y/Y) NSA Aug: 2.7% (est 2.8% ; prev 2.9%)
Corn.
- Non-expiring corn prices were 0.50-2.25 cents lower on large US crop production estimates. Hurricane Florence should yield some crop losses along the East Coast and delay harvesting. Traders are also not looking for widespread crop losses from the hurricane. Georgia, North Caroline and South Carolina make up 4.0% of the US corn crop.
- December corn hit a fresh contract low, and traders remain bearish rolling into harvest.
- African Swine Fever was discovered in Belgium, in wild boars. The French AgMin called for protective measures, as the discovery was near the French border. This is the first case for western Europe. More than 100,000 animals were culled in eastern Europe after several cases emerged this year.
· Funds sold an estimated net 11,000 corn contracts.
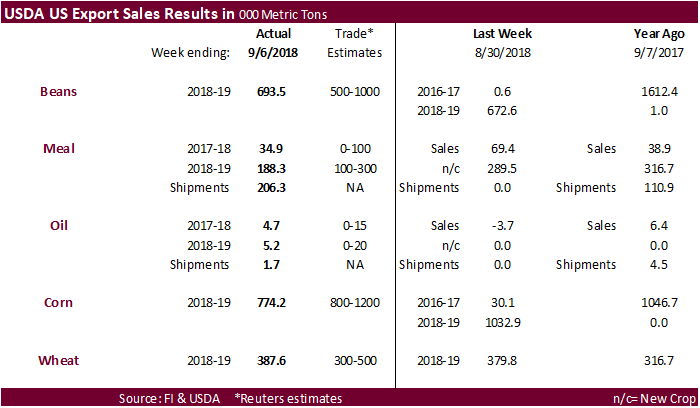
· USDA export sales for corn of 774,200 tons were below a range of expectations.
· The Rosario Grain Exchange estimated Argentina’s corn production for 2018-19 (2019-20 local marketing year) at 43 million tons, down from around 45 million tons previously.
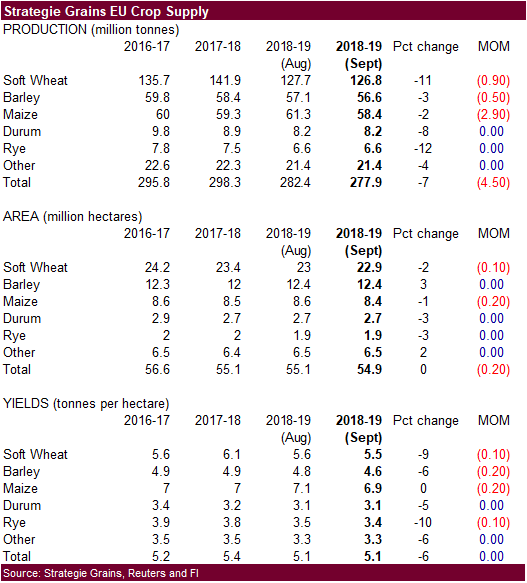
· Strategie Grains lowered its estimate for EU corn by 2.9MMT to 58.4 million tons.
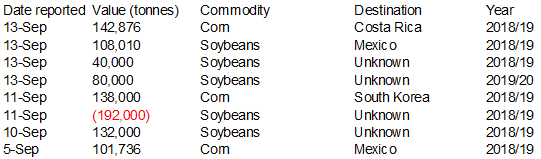
· Under the 24- hour USDA announcement system, private exporters reported:
–Export sales of 142,876 metric tons of corn for delivery to Costa Rica during the 2018/2019 marketing year
· China sold 2,902,204 tons of corn at auction from state reserves at an average price of 1,567 yuan ($228.81) per ton, 73.28 percent of total corn available at the auction.
· China will sell another 4 million tons of corn September 14.
· China sold about 78.2 million tons of corn out of reserves this season.
USDA Export Sales Text
· Corn: Net sales for the 2018/2019 marketing year, which began September 1, totaled 774,200 MT. Increases were reported for Mexico (218,400 MT, including decreases of 27,900 MT), Colombia (166,600 MT, including 54,800 MT switched from unknown destinations), Japan (128,300 MT, including decreases of 3,100 MT), Peru (113,000 MT, including 50,000 MT switched from unknown destinations and decreases of 1,000 MT), and Taiwan (38,900 MT, including 35,000 MT switched from unknown destinations). A total of 2,926,200 MT in sales were carried over from the 2017/2018 marketing year, which ended Aug 31. Exports for the period ending Aug 31 of 264,300 MT brought accumulated exports to 57,473,700 MT, up 4 percent from the prior year’s total of 55,394,800 MT. The primary destinations were Colombia (104,900 MT), Mexico (50,100 MT), Peru (45,200 MT), Guatemala (25,400 MT), and El Salvador (11,700 MT). Exports for September 1-6 totaled 727,200 MT, with Japan (243,700 MT) and Mexico (226,700 MT) being the primary destinations. Optional Origin Sales: For 2018/2019, the current outstanding balance of 965,000 MT is for South Korea (412,000 MT), unknown destinations (298,000 MT), Vietnam (130,000 MT), Saudi Arabia (70,000 MT), and Malaysia (55,000 MT).
· Barley: Net sales of 1,000 MT for 2018/2019 were for Taiwan. Exports of 400 MT were to the Philippines (200 MT), Taiwan (100 MT), and Japan (100 MT).
· Sorghum: No net sales were reported for 2018/2019, which began September 1. A total of 5,400 MT in sales were carried over the 2017/2018 marketing year, which ended August 31. Exports for period ending August 31 were to Mexico (500 MT). Accumulated exports in 2017/2018 totaled 5,080,900 MT, up 5 percent from the prior year’s total of 4,830,300 MT. Exports for September 1-6 totaled 1,000 MT, with Mexico being the destination.
CME butter and cheese margin changes: https://www.cmegroup.com/content/dam/cmegroup/notices/clearing/2018/09/Chadv18-366.pdf
· Soybeans fell 4.50-6.75 cents on renewed trade war concerns and large US crop prospects. Products followed soybeans lower. Lower crude oil added to the negative undertone in soybean oil. Offshore values this morning were suggesting a lower lead for US soybean meal and higher lead for soybean oil.
· Funds sold 6,000 soybeans, sold 4,000 meal and sold 3,000 soybean oil.
· President Trump today said “we are under no pressure to make a deal with China.” This sent a bearish undertone to the soybean market.
· Hurricane Florence will bring widespread rain to the SE parts of the ECB, up into the Ohio River Valley. Flooding is expected but the majority of the heavy flooding will stay near the coastal areas of the Carolina’s, northern GA, and southern Virginia.
· GA and NC make up only 1.4 percent of the US soybean crop.
· Note SC and GA make up 17 percent of the total US cotton crop. USDA reported earlier this week cotton bolls opening were at 43 percent for NC, 28 percent for SC, and 40 percent for GA. USDA did not report a harvest figure for these three states.
· US soybeans are completive enough in comparison to Brazil to attract Chinese business, but don’t look for robust purchases just yet. They may look to exhaust soybean meal supplies from SA and other oilseed producing nations, such as Ukraine for sunflower meal and India for soybean meal.
· Which brings us to believe Brazil could import soybeans to crush for soybean meal.
· An India delegation was invited to China to discuss soybean meal trade. If this is authorized by China, they could become less dependent on soybean imports. India used to export soybean meal to China, but you have to go back several years. India’s soybean crop is projected 2 million tons higher than 2017.
· CNGOIC reported China soybean stocks at ports fell from the previous week.
· Soybean export basis is extremely low and lack of business was noted this week. Advancing harvest in the Delta with reports of good yields are adding to the pressure on soybean basis.
· USDA export sales for soybeans were at the lower end of expectations. Soybean meal sales and shipments were ok and soybean oil sales and shipments were light.
· Australian canola production was pegged by FCStone at 2.4 million tons, below 2.8 million tons forecast by ABARES.
· The Rosario Grain Exchange estimated Argentina’s soybean production for 2018-19 (2019-20 local marketing year) at 50 million tons.
- The trade should see EPA release RIN generation figures soon.
· Under the 24- hour USDA announcement system, private exporters reported:
–Export sales of 108,010 metric tons of soybeans for delivery to Mexico during the 2018/2019 marketing year; and
–Export sales of 120,000 metric tons of soybeans for delivery to unknown destinations. Of the total 40,000 metric tons is for delivery during the 2018/2019 marketing year and 80,000 metric tons is for delivery during the 2019/2020 marketing year.
· Egypt’s GASC bought 20,000 tons of local soyoil and 11,500 tons of local sunflower oil for arrival Oct. 16-31.
o 11,500 tonnes of sunflower oil at $736.00
o 20,000 tonnes of soyoil at 12,040 Egyptian pounds (equivalent to around $672.25)
· The CCC seeks 1540 tons of fully refined vegetable oil on September 18 for carious countries for Oct/Nov delivery.
- Iran seeks 30,000 tons of sunflower oil on September 24.
- China sold about 2.29 MMT of soybeans out of reserves this season.
USDA Export Sales Text
· Soybeans: Net sales for the 2018/2019 marketing year, which began September 1, totaled 693,500 MT. Increases were reported for Egypt (196,300 MT, including 66,000 MT switched from unknown destinations and 60,000 MT switched from Iran), Japan (87,000 MT, including 63,000 MT switched from unknown destinations and decreases of 1,700 MT), Iran (76,200 MT), the Netherlands (70,500 MT, including 66,000 MT switched from unknown destinations), and Pakistan (69,100 MT, including 65,000 MT switched from unknown destinations). Reductions were reported for unknown destinations (173,000 MT). A total of 2,430,900 MT in sales were carried over from the 2017/2018 marketing year, which ended Aug 31. Exports for the period ending Aug 31 of 242,500 MT brought accumulated exports to 56,381,000 MT, down 3 percent from the prior year’s total of 58,117,600 MT. The primary destinations were Germany (75,900 MT), China (66,000 MT), Portugal (50,000 MT), Colombia (17,300 MT), and Indonesia (10,500 MT). Exports for September 1-6 totaled 895,800 MT, with Egypt (136,300 MT), Iran (136,200 MT), Japan (82,900 MT), the Netherlands (70,500 MT), and Vietnam (69,800 MT) being the primary destinations. Optional Origin Sales: For 2018/2019, the current outstanding balance of 63,000 MT is for unknown destinations. Export for Own Account: For 2017/2018, decrease in exports for own account of 69,300 MT were reported for Canada. For 2018/2019, exports for own account totaling 61,600 MT were carried over from the 2017/2018 marketing year, which ended August 31. The current exports for own account outstanding balance is 61,600 MT, all Canada.
· Soybean Cake and Meal: Net sales of 34,900 MT for 2017/2018 were down 50 percent from the previous week and 70 percent from the prior 4-week average. Increases were reported for Colombia (19,400 MT, including 10,300 MT switched from unknown destinations), Mexico (11,500 MT), Canada (8,500 MT), Burma (3,000 MT), and the Philippines (2,400 MT, including decreases of 100 MT). Reductions were reported for unknown destinations (10,400 MT) and the Dominican Republic (6,800 MT). For 2018/2019, net sales of 188,300 MT reported for Ecuador (60,000 MT), Mexico (41,100 MT), Colombia (33,400 MT), and unknown destinations (13,200 MT), were partially offset by reductions for Guatemala (400 MT). Exports of 206,300 MT were up 24 percent from the previous week and 1 percent from the prior 4-week average. The primary destinations were the Philippines (50,600 MT), Mexico (45,300 MT), Colombia (31,000 MT), Guatemala (21,600 MT), and Canada (21,200 MT).
· Soybean Oil: Net sales of 4,700 MT for 2017/2018 were up noticeably from the previous week, but down noticeably from the prior 4-week average. Increases were reported for Jamaica (3,500 MT), Mexico (500 MT), and the Dominican Republic (500 MT). For 2018/2019, net sales of 5,200 MT were reported for the Dominican Republic (2,700 MT) and Colombia (2,500 MT). Exports of 1,700 MT were down 96 percent from the previous week and 92 percent from the prior 4-week average. The primary destination was Mexico (1,400 MT).
· US wheat traded 1.75-9.75 cents lower led by Chicago to the downside despite very little bearish news in the market to press it down. Global trade increased this week. There might have been some follow through selling from USDA’s upward revision to Russia wheat on Wednesday was noted. A could traders question if USDA is too high for that country.
· Funds sold an estimated net 8,000 Chicago wheat contracts.
· December Paris wheat fell 2.75 euros to 196.75 euros.
· USDA export sales for all-wheat of 387,600 tons were within expectations.
· The Rosario Grain Exchange estimated 2018-19 wheat output at 21 million tons. Farmers planted 6.32 million hectares, up from 5.7 million hectares last season.
- Iraq seeks 50,000 tons of wheat on September 23, with offers valid until September 27. Iraq needs wheat for four after Turkey restricted flour shipments.
- Jordan cancelled an import tender for 120,000 tons of wheat.
- Tunisia seeks durum and soft wheat and feed barley on September 14 for Oct/Dec shipment.
· China sold 485,287 tons of imported 2013 wheat at auction of state reserves at an average price of 2,133 yuan ($311.45) per ton, 33.01 percent of the total wheat available at the auction.
· Algeria’s OAIC bought 630,000 tons of optional-origin milling wheat at $262 and $263 a ton, c&f, for shipment in November.
- Japan in a SBS import tender seeks 120,000 tons of feed wheat and 200,000 tons of barley on September 19 for arrival by late February.
- Syria’s General Establishment for Cereal Processing and Trade (Hoboob) seeks 200,000 tons of soft bread wheat from Russia, Romania or Bulgaria, with shipment sought between Oct. 15 and Dec. 15. The deadline is Sept. 17 and requires payment in Syrian pounds.
- Ethiopia seeks 200,000 tons of milling wheat on September 18 for shipment two months after contract signing.
- Morocco seeks 336,364 tons of US durum wheat on September 28 for arrival by December 31.
Rice/Other
· The Philippines seeks an extra 250k tons of rice for Q4 and Q1 2019 shipment.
· Iraq seeks 30,000 tons of rice from India on October 9 for LH October / FH November shipment.
USDA Export Sales Text
· Wheat: Net sales of 387,600 MT for 2018/2019 were up 2 percent from the previous week, but down 16 percent from the prior 4-week average. Increases were reported for Taiwan (112,500 MT), Mexico (37,000 MT, including decreases of 7,000 MT), Italy (31,700 MT), Nigeria (31,400 MT), and Algeria (30,000 MT). Reductions were for unknown destinations (75,700 MT). Exports of 429,100 MT were up 50 percent from the previous week and 6 percent from the prior 4-week average. The destinations were primarily to Sri Lanka (65,700 MT), Thailand (55,100 MT), Nigeria (46,400 MT), Japan (45,700 MT), and Taiwan (42,400 MT).
· Rice: Net sales of 27,000 MT for 2018/2019 were reported for Mexico (13,800 MT), Honduras (8,700 MT), El Salvador (3,000 MT), Ghana (1,100 MT), and Canada (900 MT). Reductions were reported for Libya (2,500 MT). Exports of 78,800 MT–a marketing-year high–were up noticeably from the previous week and up 81 percent from the prior 4-week average. The destinations were primarily to Japan (26,000 MT), Colombia (17,500 MT), Haiti (16,100 MT), Honduras (12,200 MT), and Mexico (1,900 MT).
Terry Reilly
Senior Commodity Analyst – Grain and Oilseeds
Futures International │190 S LaSalle St., Suite 410│Chicago, IL 60603
W: 312.604.1366
AIM: fi_treilly
ICE IM: treilly1
Skype: fi.treilly

Trading of futures, options, swaps and other derivatives is risky and is not suitable for all persons. All of these investment products are leveraged, and you can lose more than your initial deposit. Each investment product is offered only to and from jurisdictions where solicitation and sale are lawful, and in accordance with applicable laws and regulations in such jurisdiction. The information provided here should not be relied upon as a substitute for independent research before making your investment decisions. Futures International, LLC is merely providing this information for your general information and the information does not take into account any particular individual’s investment objectives, financial situation, or needs. All investors should obtain advice based on their unique situation before making any investment decision. The contents of this communication and any attachments are for informational purposes only and under no circumstances should they be construed as an offer to buy or sell, or a solicitation to buy or sell any future, option, swap or other derivative. The sources for the information and any opinions in this communication are believed to be reliable, but Futures International, LLC does not warrant or guarantee the accuracy of such information or opinions. Futures International, LLC and its principals and employees may take positions different from any positions described in this communication. Past results are not necessarily indicative of future results.
This email, any information contained herein and any files transmitted with it (collectively, the Material) are the sole property of OTC Global Holdings LP and its affiliates (OTC); are confidential, may be legally privileged and are intended solely for the use of the individual or entity to whom they are addressed. Unauthorized disclosure, copying or distribution of the Material, is strictly prohibited and the recipient shall not redistribute the Material in any form to a third party. Please notify the sender immediately by email if you have received this email by mistake, delete this email from your system and destroy any hard copies. OTC waives no privilege or confidentiality due to any mistaken transmission of this email.