From: Terry Reilly
Sent: Thursday, September 20, 2018 6:25:10 PM (UTC-06:00) Central Time (US & Canada)
Subject: FI Evening Grain Comments 09/20/18
Please note I will be out of the office on Friday.
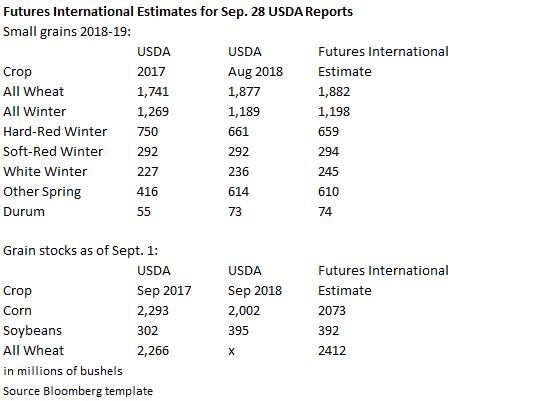
Our Sep. 28 USDA reports are included in this comment.
PDF attached
・ El Nino will not develop in the next few weeks.
・ The central and eastern North America will see a cold air mass next week, bringing frost like condition that will extend into early October.
・ The Northwestern US Plains and southern most Canada Prairies will receive periodic precipitation slowing farming activity.
・ The US Southern Plains will see rain through the end of this weekend.
・ The Delta turns wet Friday into early next week.
・ France will not receive much rain in the coming week.
・ Russia’s Volga River Basin will see two waves of rain. The first occurs Sunday into Monday and the second a little later next week.
・ Western Australia will trend wetter last days of September and early October, but confidence in the rain event is low. East-central Australia may get some showers this weekend, but mostly in northeastern New South Wales and extreme southeastern Queensland.
・ After seeing rain, China’s weather will trend drier again in the Yellow River Basin for a while.
・ Brazil will receive additional rain in the center west, center south and far southern crop areas through end of September. Winter wheat harvest delays may occur in parts of Parana, Sao Paulo and Mato Grosso do Sul.
・ Argentina will see a mixture of rain and sunshine.
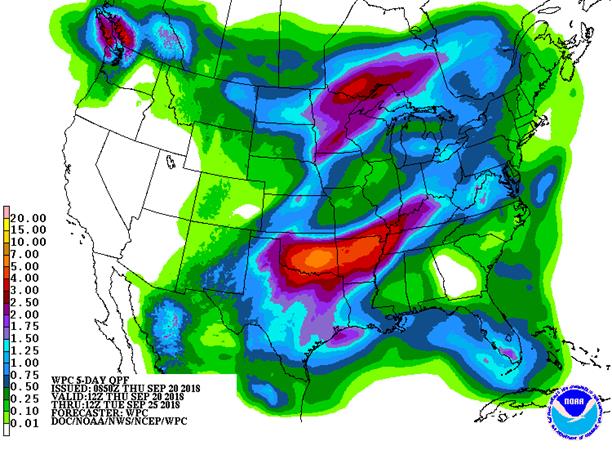

SIGNIFICANT CORN AND SOYBEAN BELT PRECIPITATION EVENTS
WEST CORN BELT EAST CORN BELT
Tdy-Fri 75% cvg of up to 0.35”
and local amts to 0.75”;
wettest south
Fri-Sat 15% cvg of up to 0.50”
and local amts to 1.0”;
SE Mo. wettest
Sat-Sun 20% cvg of up to 0.40”
and local amts to 1.0”;
mostly south
Sun-Tue 85% cvg of up to 0.75”
and local amts to 1.75”
Mon-Wed 85% cvg of up to 0.75”
and local amts to 2.0”
Wed-Sep 28 55% cvg of up to 0.35”
and local amts to 0.85”
Sep 27-28 60% cvg of up to 0.35”
and local amts to 0.65”
Sep 29-30 Up to 20% daily cvg of 5-20% daily cvg of up
up to 0.20” and locally to 0.20” and locally
more each day; some more each day
days may be dry
Oct 1-2 50% cvg of up to 0.50”
and locally more
Oct 1-3 60% cvg of up to 0.60”
and locally more
Oct 3-4 Up to 20% daily cvg of
up to 0.20” and locally
more each day
U.S. DELTA/SOUTHEAST SIGNIFICANT PRECIPITATION EVENTS
Fri-Sun 85% cvg of 0.15-0.90”
and local amts to 2.20”
with lighter rain in a
few areas; driest SE
Fri-Mon 15-30% daily cvg of
up to 0.70” and locally
more each day;
wettest west
Mon-Wed 85% cvg of up to 0.75”
and local amts to 2.0”
Tue-Sep 27 80% cvg of up to 0.75”
and local amts to 2.0”
Sep 27-Oct 1 Up to 20% daily cvg of
up to 0.25” and locally
more each day; some
days may be dry
Sep 28-29 10-25% daily cvg of
up to 0.30” and locally
more each day
Sep 30-Oct 1 Up to 20% daily cvg of
up to 0.25” and locally
more each day
Oct 2-3 40% cvg of up to 0.35”
and locally more
Oct 2-4 40% cvg of up to 0.40”
and locally more
Source: World Weather and FI
Bloomberg weekly agenda
FRIDAY, SEPT. 21:
- Ghana public holiday
- FranceAgriMer weekly updates on French crop conditions
- ICE Futures Europe commitments of traders weekly report on coffee, cocoa, sugar positions, ~1:30pm ET (~6:30pm London)
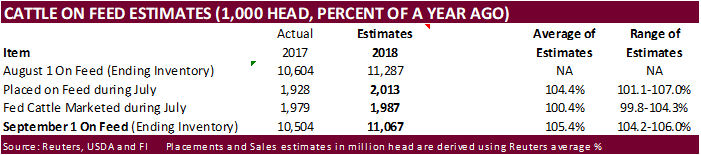
- USDA cattle-on-feed report for August, 3pm
- CFTC commitments of traders weekly report on positions for various U.S. futures and options, 3:30pm
Bloomberg Bull/Bear survey (taken Wed)
・ Soybeans: Bullish: 2 Bearish: 11 Neutral: 2
・ Wheat: Bullish: 6 Bearish: 4 Neutral: 5
・ Corn: Bullish: 4 Bearish: 6 Neutral: 5
・ Raw Sugar : Bullish: 3 Bearish: 3 Neutral: 2
・ White sugar: Bullish: 3 Bearish: 3 Neutral: 2
・ White-sugar premium: Widen: 0 Narrow: 3 Neutral: 5
Corn.
・ Corn futures appreciated on buy stops after shorts decided to exit their positions amid contracts inability to grind lower in line with soybeans and wheat early on Thursday. This sparked a flurry of buying across the soybean complex and corn. Wheat ended mixed when taking into account the three US markets. December corn ended 6.75 cents higher at $3.5250.
・ USD was weaker.
・ US exporters sold corn to Mexico.
・ Funds bought an estimated net 28,000 corn contracts after buying 9,000 on Wednesday.
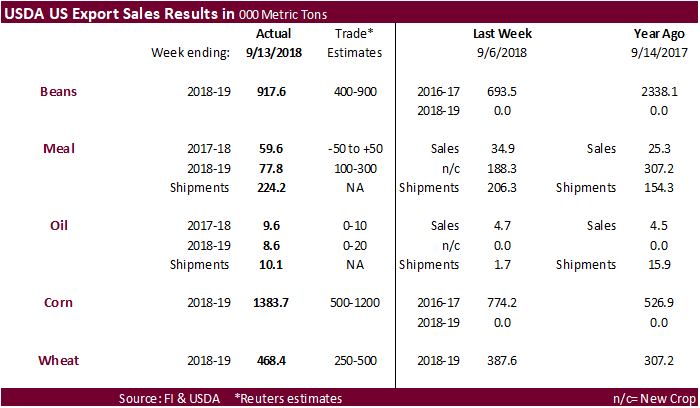
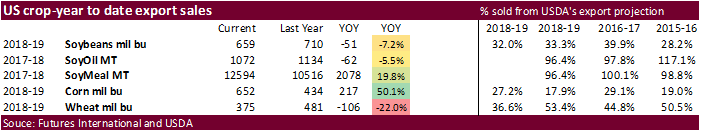
・ USDA export sales for corn were better than expected of 1.384 million tons.
・ EU corn (futures) hit a 2-month low.
・ Ukrainian corn hit a 9-month low (Platts) of $168.50/ton.
・ USDA’s Attaché estimates Egypt will import 9.5 million tons of corn, up from 9.4 million a year earlier.
・ The EPA reported 1.35 billion of ethanol (D6) blending credits were generated in August, down from 1.37 billion in July.
・ Under the 24-hour announcement system, US exporters sold 160,020 tons of corn for Mexico for the 2018-19 marketing year.
・ China sold 2,999,788 tons of corn at auction of state reserves at an average price of 1,559 yuan ($227.65) per ton, 75.45 percent of total corn available at the auction.
・ China will sell another 4 million tons of corn on Friday.
・ China sold about 83 million tons of corn out of reserves this season.
USDA Export Sales Text
・ Corn: Net sales of 1,383,700 MT for 2018/2019 were reported for Mexico (344,600 MT, including decreases of 100 MT), South Korea (204,300 MT), Peru (148,900 MT, including 72,600 MT switched from unknown destinations), Japan (145,200 MT, including 44,900 MT switched from unknown destinations), and Costa Rica (135,900 MT, including decreases of 3,000 MT). For 2019/2020, net sales of 9,700 MT were reported for Mexico. Reductions were reported for El Salvador (9,000 MT) and Israel (700 MT). Exports of 1,077,700 MT were primarily to Mexico (398,900 MT), Japan (96,000 MT), Taiwan (86,900 MT), Saudi Arabia (73,800 MT), and Colombia (73,300 MT). Optional Origin Sales: For 2018/2019, new optional origin sales were reported for South Korea (69,000 MT) and unknown destinations (55,000 MT). The current outstanding balance of 1,089,000 MT is for South Korea (481,000 MT), unknown destinations (353,000 MT), Vietnam (130,000 MT), Saudi Arabia (70,000 MT), and Malaysia (55,000 MT).
・ Barley: No sales were reported during the week. Exports 100 MT reported were to Taiwan.
・ Sorghum: Net sales of 20,200 MT for 2018/2019 were reported for unknown destinations (10,200 MT) and Japan (10,000 MT). Exports of 1,700 MT were reported to Mexico.
・ Beef: Net sales of 15,900 MT reported for 2018 were up 47 percent from the previous week, but down 16 percent from the prior 4-week average. Increases were reported for Mexico (3,600 MT, including decreases of 100 MT), Hong Kong (3,000 MT, including decreases of 200 MT), South Korea (2,900 MT, including decreases of 300 MT), Japan (2,500 MT, including decreases of 1,200 MT), and Taiwan (1,600 MT). For 2019, net sales of 300 MT were reported for Japan (200 MT) and Taiwan (200MT). Exports of 17,300 MT were up 10 percent from the previous week and 3 percent from the prior 4-week average. The primary destinations were Japan (5,500 MT), South Korea (4,200 MT), Hong Kong (1,800 MT), Mexico (1,800 MT), and Taiwan (1,300 MT).
・ Pork: Net sales of 22,900 MT reported for 2018 were up 22 percent from the previous week, but down 2 percent from the prior 4-week average. Increases were reported primarily for Mexico (7,700 MT), Colombia (4,000 MT), South Korea (3,000 MT), Japan (2,700 MT), and Hong Kong (2,000 MT). For 2019, net sales of 2,500 MT were reported for Australia (2,400 MT) and South Korea (100 MT). Exports of 20,800 MT were up 11 percent from the previous week and unchanged from the prior 4-week average. The destinations were primarily Mexico (8,700 MT), Japan (3,900 MT), Hong Kong (1,600 MT), South Korea (1,600 MT), and Canada (1,500 MT).
・ A short covering rally initially started by corn amid good export sales lifted soybeans more than 18 cents by mid-session, only to rally more than 20 cents and settle 20.25 higher basis November. Buy stops were hit at the 20-day MA of $8.3825. November soybeans are at $8.5025. Soybean meal ended $5.00 higher in the nearby at $344.40. Soybean oil was up 35 points.
・ USD was weaker.
・ Funds bought 14,000 soybeans, bought 5,000 meal and bought 4,000 soybean oil.
・ USDA export sales for soybeans were better than expected although we don’t see Argentina in the summary text. Soybean meal was on the lower end and soybean oil within expectations. Shipments of both products were ok.
・ Some traders said the rally in soybeans today was China related, in that they are buying from Argentina and relaxing on import controls (VAT, tariff, and/or inspections) for other exporting countries that traditionally don’t supply China. We think a shift in the global trade balance from one country to another is not necessarily a supportive feature.
・ A real bullish factor would be Brazil joining Argentina in buying US soybeans to crush for meal.
・ Brazilian nearby basis for export were up again.
・ China plans to impose import tariffs on US goods as soon as October. At the same time they may relax on Indian ag product export controls.
・ JCI warned reducing animal feed may disrupt China’s pork supply. Reduction of soybean meal in animal feed rations by 2-3% could extend the growing period of hogs. JCI also mentioned China will continue to take previously booked US soybean cargos, crush it, and export the soybean meal. This does not make sense to us. In a Bloomberg article, it was noted about 400,000 tons out of 700,000-800,000 tons booked have been shipped and some cargoes have already unloaded for crushers including plants in Shandong, Guangdong and Guangxi.
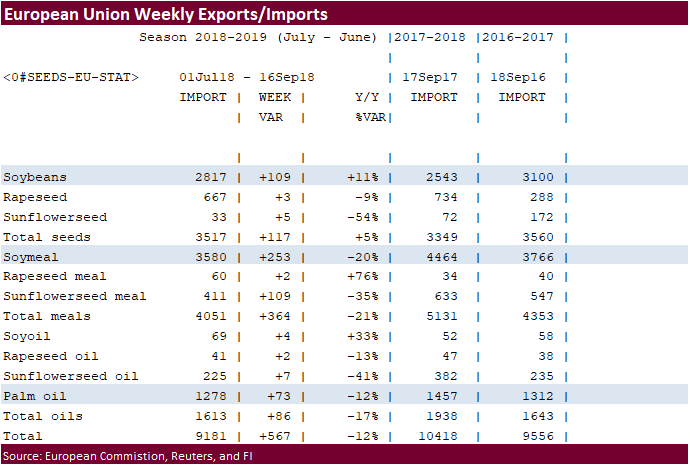
・ The European Union reported soybean import licenses since July 1 at 2.817 million tons, above 2.543 million tons a year ago. European Union soybean meal import licenses are running at 3.580 million tons for 2018-19, below 4.464 million tons a year ago. EU palm oil import licenses are running at 1.278 million tons for 2018-19, down from 1.457 million tons a year ago.
・ The market share for soybean exports to the EU has increased, but it’s a small total relative to the global trade balance.
・ Note EU rapeseed production fell to the 7-year low.
・ The EPA reported 345 million biodiesel (D4) blending credits were generated in August, compared with 310 million a month earlier.
・ EPA granted biofuel mandate exemptions for 29 small refineries for 2017, up from 19 waivers for 2016 and 7 in 2015.
・ India officials met with Chinese officials on Wednesday about opening exports to China, specifically soybean meal and other feed stuff.
・ Malaysian palm oil fell to a 3-year low.
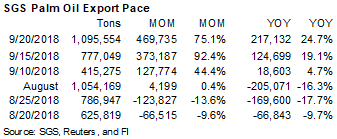
・ Cargo surveyor SGS reported month to date September 20 Malaysian palm exports at 1,095,554 tons, 469,735 tons above the same period a month ago or up 75%, and 217,132 tons above the same period a year ago or up 25%.
・ AmSpec reported palm exports up 73% and ITS up 79%.
・ Iran seeks 30,000 tons of sunflower oil on September 24.
・ China sold about 2.38 MMT of soybeans out of reserves this season.
USDA Export Sales Text
・ Soybeans: Net sales of 917,600 MT for 2018/2019 were reported for Mexico (165,600 MT, including decreases of 1,300 MT), Indonesia (90,500 MT, including 83,600 MT switched from unknown destination and decreases of 1,400 MT), Costa Rica (70,300 MT), Spain (66,900 MT, including 65,000 MT switched from unknown destinations and decreases of 200 MT), and Iran (66,500 MT, including 65,000 MT switched from unknown destinations). Reductions were reported for unknown destinations (28,000 MT) and China (4,000 MT). Exports of 800,900 MT were primarily to Mexico (140,900 MT), Spain (126,900 MT), Indonesia (119,600 MT), Iran (66,500 MT), and the Netherlands (65,200 MT). Optional Origin Sales: For 2018/2019, the current outstanding balance of 63,000 MT is for unknown destinations. Export for Own Account: The current export for own account outstanding balance is 61,600 MT, all Canada.
・ Soybean Cake and Meal: Net sales of 59,600 MT for 2017/2018 were up 71 percent from the previous week, but down 19 percent from the prior 4-week average. Increases were reported for Canada (12,300 MT), unknown destinations (10,300 MT), Indonesia (9,700 MT, including decreases of 100 MT), Colombia (9,600 MT, including 8,000 MT switched from unknown destinations and decreases of 800 MT), and Guatemala (5,700 MT, all switched from unknown destinations). Reductions were reported for El Salvador (1,700 MT) and Honduras (1,600 MT). For 2018/2019, net sales of 77,800 MT reported for the United Kingdom (30,000 MT), the Dominican Republic (16,000 MT), Israel (16,000 MT), Peru (15,000 MT), and Canada (10,800 MT), were partially offset by reductions for unknown destinations (13,200 MT) and Panama (9,600 MT). Exports of 224,200 MT were up 9 percent from the previous week and 11 percent from the prior 4-week average. The primary destinations were Mexico (53,300 MT), the Philippines (50,600 MT), Guatemala (24,100 MT), Canada (20,600 MT), and Colombia (20,400 MT).
・ Soybean Oil: Net sales of 9,600 MT for 2017/2018 were up noticeably from the previous week and 27 percent from the prior 4-week average. Increases were reported for Guatemala (6,000 MT), Mexico (3,300 MT), and Canada (200 MT). For 2018/2019, net sales of 8,600 MT were reported for the Dominican Republic (5,900 MT) and Mexico (2,700 MT). Exports of 10,000 MT were up noticeably from the previous week, but down 43 percent from the prior 4-week average. The primary destinations were the Dominican Republic (4,500 MT), Colombia (2,500 MT), and Mexico (2,300 MT).
・ Chicago December ended higher by 1.5 cents. KC and MN ended mixed.
・ Chicago December found some resistance at its 200-day MA.
・ Funds bought an estimated net 2,000 Chicago wheat contracts.
・ USDA export sales for all-wheat of 468,400 tons were within expectations.
・ EU wheat ended mixed for the nearby positions.
・ Frost and light freezes occurred along the western slopes and Great Dividing Range of Victoria and southeast New South Wales this morning. Not much damage was suspected. (World Weather Inc.)
・ USDA’s Attaché estimates Egypt will import 12.5 million tons of wheat, up from 12.3 million a year earlier.
・ The European Union granted export licenses for 163,000 tons of soft wheat imports, bringing cumulative 2018-19 soft wheat export commitments to 2.881 million tons, well down from 4.844 million tons committed at this time last year.
・ The EU granted import licenses for 25,068 tons of wheat under import quota.
・ Russian wheat exports during the first 11 weeks of the local crop year are up 48 percent from last year.
・ Ukraine 2019 winter grain plantings are at 20 percent, 1.4 million hectares, out of the projected 7.2 million. 7.24 million were planted in second half 2018.
・ Algeria bought about 75,000 tons of feed barley for November shipment at $252-$255/ton.
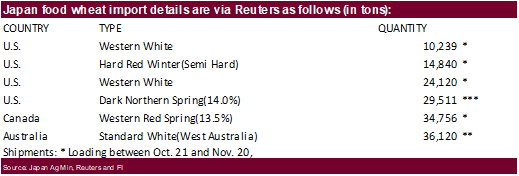
・ Japan bought 149,586 tons of wheat. Original details as follows:
・ China sold 2,631 tons of imported 2013 wheat at auction from state reserves at an average price of 2,231 yuan ($325.42) per ton, 0.3 percent of total wheat available at the auction.
・ Results awaited: Ethiopia seeks 200,000 tons of milling wheat for shipment two months after contract signing. Ethiopia got offers from 7 firms. Lowest offer was for 100,000 tons at $272.05/ton, c&f.
・ Turkey seeks up to 252,000 tons of red milling wheat for October 2-22 loading, possibly as early as September 22. The depreciation of the lira sent importers seeking Turkish wheat flour, causing them to restrict exports. But countries like Iraq that heavily depend on flour from Turkey may have to import from other countries.
・ Japan in a SBS import tender seeks 120,000 tons of feed wheat and 200,000 tons of barley on September 26 for arrival by late February.
・ Jordan seeks 120,000 tons of feed barley, optional origin, on September 26.
・ Jordan seeks 120,000 tons of feed wheat, optional origin, on September 27.
・ Iraq seeks 50,000 tons of wheat on September 23, with offers valid until September 27. Iraq needs wheat for four after Turkey restricted flour shipments.
・ Morocco seeks 336,364 tons of US durum wheat on September 28 for arrival by December 31.
Rice/Other
・ Mauritius seeks 9,000 tons of rice for delivery between Nov. 15, 2018, and March 31, 2019, set to close is Sept. 27.
・ Iraq seeks 30,000 tons of rice from India on October 9 for LH October / FH November shipment.
USDA Export Sales Text
・ Wheat: Net sales of 468,400 metric tons for 2018/2019 were up 21 percent from the previous week and 32 percent from the prior 4-week average. Increases were reported for the Philippines (80,000 MT), Indonesia (70,000 MT), Vietnam (61,000 MT), Thailand (55,100 MT), and South Korea (48,600 MT, including decreases of 1,500 MT). Reductions were for unknown destinations (27,200 MT), Costa Rica (4,000 MT), Peru (2,400 MT), and Honduras (1,900 MT). Exports of 315,100 MT were down 27 percent from the previous week and 20 percent from the prior 4-week average. The destinations were primarily to Japan (150,600 MT), Mexico (49,900 MT), Malaysia (43,500 MT), Ecuador (25,000 MT), and Honduras (17,700 MT).
・ Cotton: Net sales of 97,800 RB for 2018/2019 were up 20 percent from the previous week, but down 24 percent from the prior 4-week average. Increases were reported for Vietnam (25,500 RB, including 900 RB switched from Taiwan), Mexico (18,500 RB), Pakistan (15,300 RB), Bangladesh (13,100 RB, including decreases of 100 RB), and Thailand (8,700 RB). Reductions were reported for Taiwan (900 RB). For 2019/2020, net sales of 32,900 RB were reported for Thailand (23,300 RB), Mexico (8,400 RB), Guatemala (800 RB), and China (400 RB). Exports of 148,900 RB were up 10 percent from the previous week, but down 7 percent from the prior 4-week average. Exports were reported primarily to Vietnam (43,700 RB), Indonesia (19,200 RB), China (16,200 RB), Mexico (16,100 RB), and Pakistan (8,800 RB). Net sales of Pima totaling 3,300 RB for 2018/2019 were down 42 percent from the previous week and 61 percent from the prior 4-week average. Increases reported for Peru (1,800 RB), India (800 RB), China (600 RB), and Vietnam (300 RB, switched from Japan), were partially offset by reductions for Japan (300 RB). For 2019/2020, net sales of 400 RB were reported for Peru. Exports of 8,700 RB were up noticeably from the previous week and 50 percent from the prior 4-week average. The primarily destinations were India (3,500 RB), Thailand (2,400 RB), and Pakistan (1,200 RB). Optional Origin Sales: For 2018/2019, the current optional origin outstanding balance is for Vietnam (1,800 RB). Exports for Own Account: The current exports for own account outstanding balance is 7,400 RB, all China.
Terry Reilly
Senior Commodity Analyst C Grain and Oilseeds
Futures International │190 S LaSalle St., Suite 410│Chicago, IL 60603
W: 312.604.1366
AIM: fi_treilly
ICE IM: treilly1
Skype: fi.treilly

Trading of futures, options, swaps and other derivatives is risky and is not suitable for all persons. All of these investment products are leveraged, and you can lose more than your initial deposit. Each investment product is offered only to and from jurisdictions where solicitation and sale are lawful, and in accordance with applicable laws and regulations in such jurisdiction. The information provided here should not be relied upon as a substitute for independent research before making your investment decisions. Futures International, LLC is merely providing this information for your general information and the information does not take into account any particular individual’s investment objectives, financial situation, or needs. All investors should obtain advice based on their unique situation before making any investment decision. The contents of this communication and any attachments are for informational purposes only and under no circumstances should they be construed as an offer to buy or sell, or a solicitation to buy or sell any future, option, swap or other derivative. The sources for the information and any opinions in this communication are believed to be reliable, but Futures International, LLC does not warrant or guarantee the accuracy of such information or opinions. Futures International, LLC and its principals and employees may take positions different from any positions described in this communication. Past results are not necessarily indicative of future results.
This email, any information contained herein and any files transmitted with it (collectively, the Material) are the sole property of OTC Global Holdings LP and its affiliates (OTCGH); are confidential, may be legally privileged and are intended solely for the use of the individual or entity to whom they are addressed. Unauthorized disclosure, copying or distribution of the Material, is strictly prohibited and the recipient shall not redistribute the Material in any form to a third party. Please notify the sender immediately by email if you have received this email by mistake, delete this email from your system and destroy any hard copies. OTCGH waives no privilege or confidentiality due to any mistaken transmission of this email.