From: Terry Reilly
Sent: Thursday, September 27, 2018 4:11:41 PM (UTC-06:00) Central Time (US & Canada)
Subject: FI Evening Grain Comments 09/27/18
PDF attached
· Frequent showers will occur in the Delta this week.
· The Midwest will also be active starting later this week which should slow harvesting before a couple more days of net drying occurs outside the Ohio River Valley region.
· HRW wheat areas will see a mixture of sunshine and rain.
· Improving weather across Europe and the CIS is bearish for wheat.
· SA weather looks good.
· Canada is seeing too much precipitation in form of snow and rain, and temperatures will remain cool.
SIGNIFICANT CORN AND SOYBEAN BELT PRECIPITATION EVENTS
WEST CORN BELT EAST CORN BELT
Fri-Sat 40% cvg of up to 0.50” 35% cvg of up to 0.30”
and local amts to 0.80”; and local amts to 0.50”;
south Ia. wettest north Il. wettest
Sun 30% cvg of up to 0.25”
and local amts to 0.40”;
wettest north
Sun-Mon 65% cvg of up to 0.75”
and local amts to 2.0”;
Ia. to Wi. wettest
Mon-Tue 60% cvg of up to 0.50”
and local amts to 1.10”;
SW and north wettest
Tue-Wed 70% cvg of up to 0.75”
and local amts to 2.0”;
wettest NE
Wed-Oct 4 75% cvg of up to 0.60”
and local amts to 1.20”;
driest SW
Oct 4-6 80% cvg of up to 0.75”
and local amts to 2.0”;
wettest south
Oct 5-7 80% cvg of up to 0.75”
and local amts to 2.0”
Oct 7-8 Up to 20% daily cvg of
up to 0.25” and locally
more each day
Oct 8-9 Up to 20% daily cvg of
up to 0.25” and locally
more each day
Oct 9-11 75% cvg of up to 0.65”
and locally more
Oct 10-12 75% cvg of up to 0.65”
and locally more
U.S. DELTA/SOUTHEAST SIGNIFICANT PRECIPITATION EVENTS
DELTA SOUTHEAST
Fri-Sat Up to 15% daily cvg of
up to 0.25” and locally
more each day; some
days may be dry
Fri-Mon 20-40% daily cvg of
up to 0.60” and locally
more each day; south
and east wettest
Sun-Tue 10-25% daily cvg of
up to 0.35” and locally
more each day
Tue-Oct 5 Up to 20% daily cvg of
up to 0.20” and locally
more each day; some
days may be dry
Wed-Oct 5 Up to 20% daily cvg of
up to 0.20” and locally
more each day; some
days may be dry
Oct 6-7 80% cvg of up to 0.75”
and local amts to 1.50”
Oct 6-8 80% cvg of up to 0.75”
and local amts to 1.50”
Oct 8-10 Up to 20% daily cvg of
up to 0.20” and locally
more each day
Oct 9-10 Up to 20% daily cvg of
up to 0.20” and locally
more each day
Oct 11-12 60% cvg of up to 0.60” 60% cvg of up to 0.50”
and locally more and locally more
Source: World Weather Inc. and FI
FRIDAY, SEPT. 28:
- USDA grain stockpiles for 3Q, including corn, soy, wheat, barley, noon
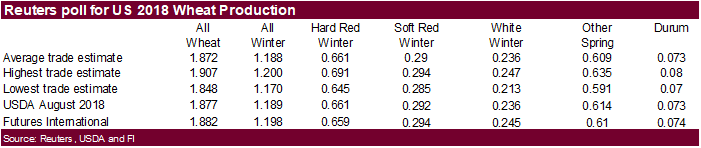
- USDA wheat production report for September, noon
- Polish crop estimates
- FranceAgriMer weekly updates on French crop conditions
- Globoil vegetable oil conference in Mumbai, final day
- ICE Futures Europe commitments of traders weekly report on coffee, cocoa, sugar positions, ~1:30pm ET (~6:30pm London)
- CFTC commitments of traders weekly report on positions for various U.S. futures and options, 3:30pm
Weekly Bloomberg Bull/Bear Survey (taken Wed)
· Raw sugar survey results: Bullish: 2 Bearish: 7 Neutral: 0
· White sugar: Bullish: 2 Bearish: 7 Neutral: 0
· White-sugar premium: Widen: 2 Narrow: 6 Neutral: 1
· Wheat: Bullish: 4 Bearish: 2 Neutral: 6
· Corn: Bullish: 7 Bearish: 2 Neutral: 3
· Soybeans: Bullish: 3 Bearish: 6 Neutral: 3
· US Crude Oil Futures Settle At $72.12/Bbl Up 55 Cents
· US Durables Goods Aug: 4.5% (est 2.0%, prev R -1.2%)
– US Durables Ex-Transport Aug:0.1% (est 0.5%, prev R 0.2%)
– US Durables Ex-Defence (MM)(Aug): 2.6% (prev R -0.6%%)
– US Non Def Cap Ex-Air (Aug): -0.5% (est 0.4%, prev R 1.5%)
· US GDP Final Q2: 4.2% (est 4.2%, prev 4.2%)
– US GDP Cons Spending Final Q2: 3.8% (prev 3.8%)
– US GDP Deflator Final Q2: 3.3% (est 3.0%, prev 3.2%)
· US Core PCE Prices Final Q2: 2.1% (est 2.0%, prev 2.0%)
· US PCE Prices Final Q2: 2.0% (est 1.9%, prev 1.9%)
· US Adv Goods Trade Balance Aug; -75.83Bln (prev -72.05Bln)
· US Wholesale Inventories Adv Aug: 0.8% (prev 0.6%)
· US Initial Jobless Claims: 214K (est 210K, prev R 202K)
· US Jobless Claims 4-WK Avg: 206.25K (prev R 206K)
· US Continue Jobless Claims: 1.661M (est 1.684M, prev 1.645M)
· US Durables Goods Aug: 4.5% (est 2.0%, prev R -1.2%)
Corn.
- Corn saw a two-sided trade, ending higher. December is up 5 out of the past 6 session.
- News was light after the day session open.
- Funds bought an estimated 7,000 corn contracts.
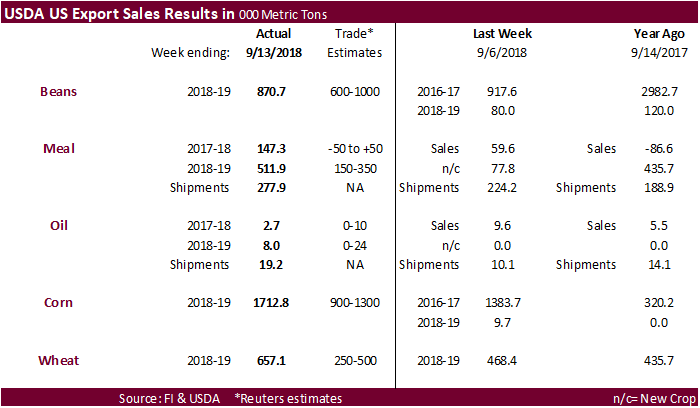
- US USDA 2018-19 corn export sales of 1.713 million tons were well above expectations.
- The White House is considering restricting biofuel credit trading. This might be rolled in the E15-all year bill.
- IGC: world corn +10MMT to 1.074
· China sold 2,903,808 tons of corn at auction of state reserves at an average price of 1,550 yuan ($225.49) per ton, 73.49 percent of total corn available at the auction.
· China will sell 4 million tons of corn on Friday.
· China sold about 85 million tons of corn out of reserves this season and some are predicting up to 100 million tons will be sold by the end of the marketing season.
USDA Export Sales Text
· Corn: Net sales of 1,712,800 MT for 2018/2019 were reported for Mexico (623,200 MT, including decreases of 4,100 MT), Guatemala (161,400 MT), Japan (124,500 MT, including 124,000 MT switched from unknown destinations and decreases of 70,400 MT), Egypt (110,500 MT, including 55,000 MT switched from unknown destinations), and Peru (92,900 MT, including 21,500 MT switched from unknown destinations and decreases of 1,000 MT). Reductions were reported for Vietnam (60,000 MT), Nicaragua (6,800 MT), and Jamaica (1,500 MT). For 2019/2020, net sales reductions of 9,700 MT were reported for Mexico. Exports of 1,358,800 MT were primarily to Mexico (342,700 MT), Japan (272,500 MT), Egypt (163,500 MT), Taiwan (139,300 MT), and South Korea (129,700 MT). Optional Origin Sales: For 2018/2019, new optional origin sales of 68,000 MT were reported for South Korea. The current outstanding balance of 1,157,000 MT is for South Korea (549,000 MT), unknown destinations (353,000 MT), Vietnam (130,000 MT), Saudi Arabia (70,000 MT), and Malaysia (55,000 MT).
· Barley: Net sales of 2,100 MT for 2018/2019 were for South Korea (1,600 MT) and Taiwan (500 MT). Exports 900 MT were primarily to Japan.
· Sorghum: No net sales were reported for the week. Exports of 1,300 MT were reported to Mexico.
· Beef: Net sales of 16,000 MT reported for 2018 were up 1 percent from the previous week, but down 10 percent from the prior 4-week average. Increases were reported for South Korea (4,800 MT, including decreases of 400 MT), Japan (4,500 MT, including decreases of 600 MT), Mexico (1,900 MT, including decreases of 100 MT), Canada (1,500 MT, including decreases of 100 MT), and Hong Kong (1,500 MT, including decreases of 200 MT). For 2019, net sales of 400 MT were reported for South Korea (300 MT) and Taiwan (100 MT). Exports of 16,200 MT were down 7 percent from the previous week and 5 percent from the prior 4-week average. The primary destinations were South Korea (4,300 MT), Japan (4,200 MT), Mexico (1,900 MT), Hong Kong (1,800 MT), and Canada (1,300 MT).
· Pork: Net sales of 28,300 MT reported for 2018 were up 24 percent from the previous week and 26 percent from the prior 4-week average. Increases were reported primarily for Mexico (18,200 MT), Japan (3,200 MT), Canada (2,200 MT), South Korea (1,700 MT), and Hong Kong (900 MT). Reductions were reported for Colombia (100 MT). For 2019, net sales of 2,300 MT were primarily for Australia (1,900 MT) and South Korea (300 MT). Exports of 17,600 MT were down 15 percent from the previous week and from the prior 4-week average. The primary destinations were Mexico (7,200 MT), Japan (3,000 MT), Hong Kong (1,700 MT), Canada (1,500 MT), and South Korea (1,500 MT).
· December corn may now trade in a $3.35-$3.80 range.
· March corn in a $3.15-$4.15 range.
· Soybeans ended higher on fund short covering and strong export demand as indicated in the USDA export sales report. Soybean meal was also strong during the session but sold off before the close. Soybean oil recovered after getting pressure early to close 35-38 points higher.
· A Chinese representative from the Commerce Ministry said they are open to negotiations with the US to resolve trade issues but added China will not cave to extreme US pressure.
· Funds bought an estimated 4,000 soybean contracts, bought 3,000 soybean meal and bought 5,000 soybean oil.
· US harvesting delays are in the spotlight but we think US harvest progress could advance a healthy 11 points to 25 percent, 6 points above average.
· USDA US export sales were good for meal, corn, wheat, soybeans and slow for soybean oil.
· US 2018-19 soybean meal sales were 511,900 tons. Traders started rolling positions from old to new-crop.
· Soybean export sales of 870,700 tons were within expectations and included 96,100 tons for Argentina.
· Soybean oil export sales were poor at 2,700 tons and there were 8,000 tons booked for 2018-19.
· The US and Japan agreed to bilateral trade talks.
· India’s SOPA is optimistic India could increase soybean meal exports to 2.5-3.0 million tons in 2018-19, up from 1.75 million tons in 2017-18. Soybean production is up and India has been campaigning to open exports of oilmeal to China. Recently 300,000 tons of soybean meal has been contracted for Japan, Europe, and Vietnam at around $370/ton.
· Univia estimates France’s rapeseed area will decline 150,000-200,000 hectares to 1.5 million hectares this year, in part to drought.
- IGC: world soybeans +4MMT to 370MMT
· Next week China is on a week-long holiday.
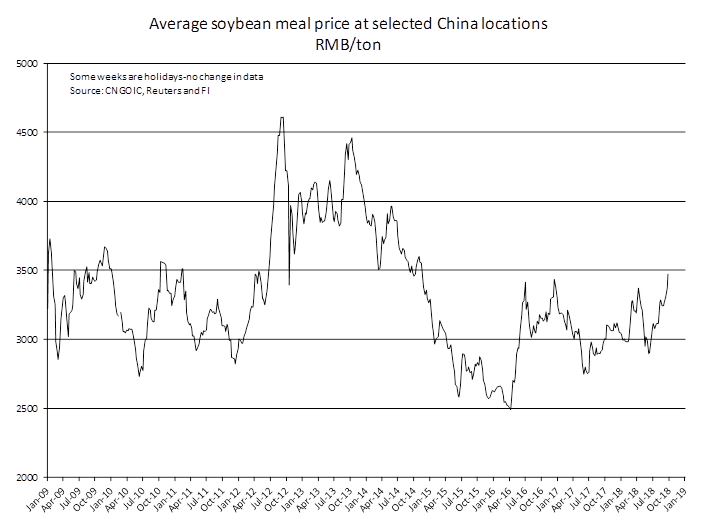
· China soybean meal futures hit a 5-month high. It was up 0.1% or 2 yuan/ton to 3298, and leading CBOT meal $1.60 lower.
The average domestic price of cash China soybean meal is near its highest level since November 2014
· An Indonesia government official sees 2019 Indonesia biodiesel production up to 7 million tons from 5 million tons. They are asking India to lower its import tariff on the product. They see Indonesia palm production at 40 million tons.
· Indonesia will leave its palm export tax unchanged at zero percent (will be left there as long as palm prices remain below $750/ton).
· Several bearish comments emerged out of a conference in Asia. One analyst thinks the price of crude palm oil when imported into Rotterdam will decline to $590/ton and soybean oil at $700/ton. Another thinks an ongoing trade war will reduce the price of soybeans below $8.00/bu.
- China sold 200 tons of imported 2011 soybean oil out of reserves at 5,000 yuan per ton ($727.08/ton), 0.7 percent of the total offered.
- China sold about 2.5MMT of soybean out of reserves this season.
- China will offer 100,000 tons of soybeans out of reserves on October 10.
- Results awaited: Iran seeks 30,000 tons of sunflower oil on September 24.
USDA Export Sales Text
· Soybeans: Net sales of 870,700 MT for 2018/2019 were reported for unknown destinations (351,700 MT), Spain (104,600 MT, including 100,000 MT switched from unknown destinations), the Netherlands (103,200 MT, including 96,000 MT switched from unknown destinations), Argentina (96,100 MT, including 40,000 MT switched from unknown destinations and decreases of 4,200 MT), and Japan (61,500 MT, including 24,700 MT switched from unknown destinations and decreases of 2,000 MT). Reductions were reported for China (64,000 MT), Egypt (3,200 MT), and Costa Rica (200 MT). For 2019/2020, net sales of 1,500 MT were reported for Japan. Exports of 819,200 MT were primarily to Spain (104,600 MT), Mexico (103,300 MT), the Netherlands (103,200 MT), Egypt (81,800 MT), and Saudi Arabia (72,000 MT). Optional Origin Sales: For 2018/2019, new optional origin sales of 60,000 MT were reported for unknown destinations. The current outstanding balance of 123,000 MT is unknown destinations. Export for Own Account: The current exports for own account outstanding balance is 61,600 MT, all Canada.
· Soybean Cake and Meal: Net sales of 147,300 MT for 2017/2018 were up noticeably from the previous week and from the prior 4-week average. Increases were reported for Vietnam (42,900 MT, including decreases of 200 MT), Japan (24,400 MT, including 2,900 MT switched from unknown destinations), the Philippines (20,200 MT), Canada (17,800 MT), and Mexico (11,200 MT, including decreases of 1,200 MT). Reductions were reported for Thailand (3,000 MT), Costa Rica (700 MT), and Jamaica (700 MT). For 2018/2019, net sales of 511,900 MT were reported for unknown destinations (179,400 MT), Guatemala (77,000 MT), the Dominican Republic (54,000 MT), and Indonesia (54,000 MT). Exports of 277,800 MT were up 24 percent from the previous week and 31 percent from the prior 4-week average. The primary destinations were the Philippines (114,900 MT), Mexico (36,100 MT), Colombia (27,000 MT), Canada (26,100 MT), and the Dominican Republic (23,500 MT).
· Soybean Oil: Net sales of 2,700 MT for 2017/2018 were down 72 percent from the previous week and 69 percent from the prior 4-week average. Increases were reported for Mexico (1,000 MT), El Salvador (700 MT), Colombia (500 MT), and Canada (300 MT). For 2018/2019, net sales of 8,000 MT were reported for South Korea (4,500 MT), the Dominican Republic (2,500 MT), and Colombia (1,000 MT). Exports of 19,200 MT were up 91 percent from the previous week and 16 percent from the prior 4-week average. The primary destinations were the Dominican Republic (9,500 MT), Guatemala (4,500 MT), Jamaica (3,000 MT), and Mexico (1,800 MT).
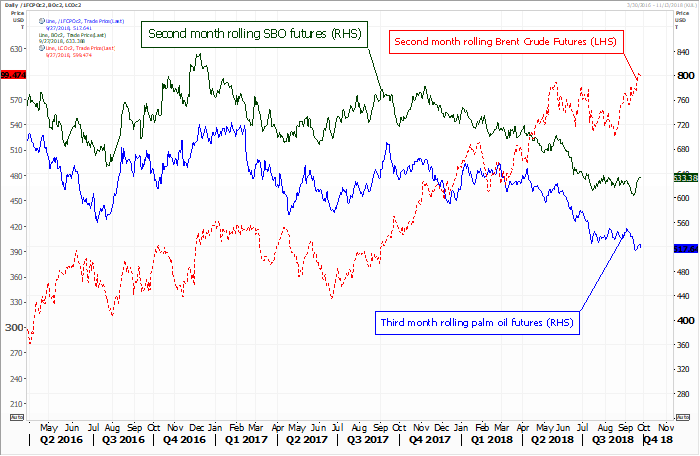
We think palm prices are nearing a bottom. Rising palm production and India’s import tariff on selected vegetable oils are bearish, but higher SBO and Brent Crude may eventually stop the medium-term erosion of palm prices.
Source: Reuters and FI
· November soybeans are seen in a $8.00-$8.70 range
· December soybean meal $285-320 range
· December soybean oil 27.10-28.60 range
· US wheat ended lower by 3.50-6.00 cents in Chicago and KC and higher by 0.50-2.50 cents in Minneapolis.
· An improvement in USDA export sales trimmed losses in all three US markets early but prices were lower in Chicago and KC by mid-morning. MN was higher on good global demand for high protein wheat.
- Funds sold 4,000 SRW wheat contracts.
· Note CBOT rice fell to its lowest level since May 2017.
- US USDA all-wheat export sales were 657,100 tons, an improvement from 468,400 tons from last week.
- IGC: world wheat +1MMT to 717MMT
· Paris wheat ended lower by 0.50 euro basis December.
· China sold 6,584 tons of imported 2013 wheat at auction of state reserves at an average price of 2,130 yuan ($309.74) per ton, 0.70 percent of total wheat available at the auction.
- Jordan passed on 120,000 tons of feed wheat, optional origin. They are back in on October 4.
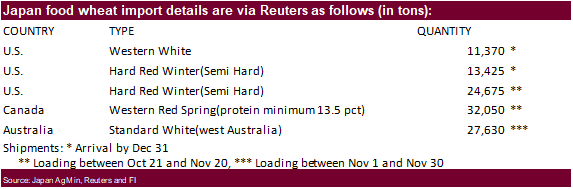
- Japan bought 109,150 tons of food wheat. Original details as follows.
- Postponed: UAE seeks 60,000 tons of wheat for Oct/Nov shipment.
- Results awaited: Ethiopia seeks 200,000 tons of milling wheat for shipment two months after contract signing. Ethiopia got offers from 7 firms. Lowest offer was for 100,000 tons at $272.05/ton, c&f.
- Morocco seeks 336,364 tons of US durum wheat on September 28 for arrival by December 31.
- Bahrain seeks 25,000 tons of wheat on October 2 for Nov shipment.
- Taiwan seeks 110,000 tons of US wheat on October 2 for Nov-Dec shipment.
- Jordan retendered for another 100,000 tons of feed barley on October 3.
- Bangladesh seeks 50,000 tons of 12.5 percent wheat on October 9, optional origin.
- Japan in a SBS import tender seeks 120,000 tons of feed wheat and 200,000 tons of barley on October 10 for arrival by late February.
Rice/Other
· Mauritius seeks 9,000 tons of rice for delivery between Nov. 15, 2018, and March 31, 2019, set to close is Sept. 27.
· Thailand seeks to sell 120,000 tons of sugar on October 3.
USDA Export Sales Text
· Wheat: Net sales of 657,100 metric tons for 2018/2019 were up 40 percent from the previous week and 59 percent from the prior 4-week average. Increases were reported for Japan (140,600 MT), the Philippines (94,400 MT, including 30,000 MT switched from unknown destinations), Mexico (91,100 MT, including decreases of 700 MT), unknown destinations (88,200 MT), and Venezuela (60,000 MT, including 30,000 MT switched from Uruguay). Reductions were for Uruguay (30,000 MT), French West Indies (13,000 MT), and Taiwan (11,800 MT). Exports of 483,700 MT–a marketing-year high–were up 54 percent from the previous week and 35 percent from the prior 4-week average. The destinations were primarily to Mexico (79,400 MT), Italy (59,400 MT), Thailand (58,200 MT), Taiwan (48,800 MT), and Guatemala (40,000 MT).
· Cotton: Net sales of 70,300 RB for 2018/2019–a marketing-year low–were down 28 percent from the previous week and 33 percent from the prior 4-week average. Increases were reported for Vietnam (36,300 RB, including 3,800 RB switched from China), Japan (13,900 RB, including decreases of 1,800 RB), Pakistan (13,800 RB), Taiwan (11,900 RB, including 1,000 RB switched from Japan and 600 RB switched from China), and Guatemala (6,700 RB). Reductions were reported for China (46,800 RB). For 2019/2020, net sales of 58,200 RB were reported for China (56,400 RB) and Thailand (1,800 RB). Exports of 138,900 RB were down 7 percent from the previous week and 13 percent from the prior 4-week average. Exports were primarily to Vietnam (34,600 RB), Bangladesh (17,900 RB), Mexico (15,000 RB), Indonesia (14,900 RB), and China (12,900 RB). Net sales of Pima totaling 7,300 RB for 2018/2019 were up noticeably from the previous week, but down 4 percent from the prior 4-week average. Increases reported for China (2,200 RB), Peru (2,200 RB), India (1,100 RB), and Thailand (900 RB), were partially offset by reductions for Japan (100 RB). Exports of 4,800 RB were down 45 percent from the previous week and 22 percent from the prior 4-week average. The primary destinations were India (2,700 RB), Egypt (900 RB), and Peru (800 RB). Optional Origin Sales: For 2018/2019, new optional origin sales of 600 RB were reported for Pakistan. Options were exercised to export 600 RB to Pakistan from the United States. The current outstanding balance of 1,800 RB is for Vietnam. Exports for Own Account: The current exports for own account outstanding balance is 7,400 RB, all China.
9/12/18. Trading ranges:
- December Chicago wheat $4.90-$5.45 range.
- December KC $4.90-$5.55 range.
- December MN $5.45-$6.00 range.
U.S. EXPORT SALES FOR WEEK ENDING 9/20/2018
|
|
CURRENT MARKETING YEAR |
NEXT MARKETING YEAR |
||||||
|
COMMODITY |
NET SALES |
OUTSTANDING SALES |
WEEKLY EXPORTS |
ACCUMULATED EXPORTS |
NET SALES |
OUTSTANDING SALES |
||
|
CURRENT YEAR |
YEAR |
CURRENT YEAR |
YEAR |
|||||
|
|
THOUSAND METRIC TONS |
|||||||
|
WHEAT |
|
|
|
|
|
|
|
|
|
HRW |
175.7 |
1,384.9 |
1,450.6 |
187.2 |
1,755.6 |
3,614.4 |
0.0 |
0.0 |
|
SRW |
96.5 |
635.5 |
543.2 |
14.3 |
721.6 |
788.6 |
0.0 |
0.0 |
|
HRS |
244.9 |
1,419.6 |
1,383.0 |
174.5 |
1,912.7 |
2,268.0 |
0.0 |
0.0 |
|
WHITE |
129.5 |
1,118.1 |
1,376.9 |
49.9 |
1,649.3 |
1,842.1 |
0.0 |
0.0 |
|
DURUM |
10.5 |
123.0 |
101.8 |
57.8 |
144.0 |
149.8 |
0.0 |
0.0 |
|
TOTAL |
657.1 |
4,681.2 |
4,855.5 |
483.7 |
6,183.2 |
8,663.0 |
0.0 |
0.0 |
|
BARLEY |
2.1 |
41.7 |
27.3 |
0.9 |
13.8 |
9.6 |
0.0 |
0.0 |
|
CORN |
1,712.8 |
15,104.3 |
9,204.4 |
1,358.8 |
3,163.7 |
2,145.7 |
-9.7 |
71.1 |
|
SORGHUM |
0.0 |
61.8 |
914.0 |
1.3 |
3.9 |
283.1 |
0.0 |
0.0 |
|
SOYBEANS |
870.7 |
16,287.2 |
19,232.9 |
819.2 |
2,515.9 |
3,081.7 |
1.5 |
81.5 |
|
SOY MEAL |
147.3 |
882.0 |
529.4 |
277.8 |
11,858.8 |
9,899.5 |
511.9 |
2,523.0 |
|
SOY OIL |
2.7 |
76.0 |
50.2 |
19.2 |
998.2 |
1,089.0 |
8.0 |
63.6 |
|
RICE |
|
|
|
|
|
|
|
|
|
L G RGH |
79.4 |
255.4 |
118.0 |
0.1 |
152.6 |
185.9 |
0.0 |
0.0 |
|
M S RGH |
0.0 |
4.7 |
12.1 |
0.0 |
0.0 |
0.0 |
0.0 |
0.0 |
|
L G BRN |
1.1 |
5.6 |
1.2 |
0.3 |
2.7 |
1.0 |
0.0 |
0.0 |
|
M&S BR |
30.1 |
30.2 |
4.1 |
0.0 |
0.7 |
0.3 |
0.0 |
0.0 |
|
L G MLD |
13.4 |
119.9 |
145.8 |
4.2 |
105.3 |
138.4 |
0.0 |
0.0 |
|
M S MLD |
14.5 |
26.7 |
57.9 |
3.5 |
77.7 |
38.9 |
0.0 |
0.0 |
|
TOTAL |
138.5 |
442.5 |
339.1 |
8.1 |
339.0 |
364.6 |
0.0 |
0.0 |
|
COTTON |
|
THOUSAND RUNNING BALES |
||||||
|
UPLAND |
70.3 |
7,789.2 |
5,960.5 |
138.9 |
1,214.2 |
1,272.9 |
58.2 |
1,479.1 |
|
PIMA |
7.3 |
227.6 |
260.5 |
4.8 |
47.1 |
30.9 |
0.0 |
25.3 |
Terry Reilly
Senior Commodity Analyst – Grain and Oilseeds
Futures International │190 S LaSalle St., Suite 410│Chicago, IL 60603
W: 312.604.1366
AIM: fi_treilly
ICE IM: treilly1
Skype: fi.treilly

Trading of futures, options, swaps and other derivatives is risky and is not suitable for all persons. All of these investment products are leveraged, and you can lose more than your initial deposit. Each investment product is offered only to and from jurisdictions where solicitation and sale are lawful, and in accordance with applicable laws and regulations in such jurisdiction. The information provided here should not be relied upon as a substitute for independent research before making your investment decisions. Futures International, LLC is merely providing this information for your general information and the information does not take into account any particular individual’s investment objectives, financial situation, or needs. All investors should obtain advice based on their unique situation before making any investment decision. The contents of this communication and any attachments are for informational purposes only and under no circumstances should they be construed as an offer to buy or sell, or a solicitation to buy or sell any future, option, swap or other derivative. The sources for the information and any opinions in this communication are believed to be reliable, but Futures International, LLC does not warrant or guarantee the accuracy of such information or opinions. Futures International, LLC and its principals and employees may take positions different from any positions described in this communication. Past results are not necessarily indicative of future results.
This email, any information contained herein and any files transmitted with it (collectively, the Material) are the sole property of OTC Global Holdings LP and its affiliates (OTCGH); are confidential, may be legally privileged and are intended solely for the use of the individual or entity to whom they are addressed. Unauthorized disclosure, copying or distribution of the Material, is strictly prohibited and the recipient shall not redistribute the Material in any form to a third party. Please notify the sender immediately by email if you have received this email by mistake, delete this email from your system and destroy any hard copies. OTCGH waives no privilege or confidentiality due to any mistaken transmission of this email.