From: Terry Reilly
Sent: Monday, October 01, 2018 4:03:02 PM (UTC-06:00) Central Time (US & Canada)
Subject: FI Evening Grain Comments 10/01/18
PDF attached includes:
- China corn and soybean balances
- Our latest US crop estimates for October USDA report
- End of month USDA crush, corn for ethanol, and biodiesel updates
Weather and crop conditions
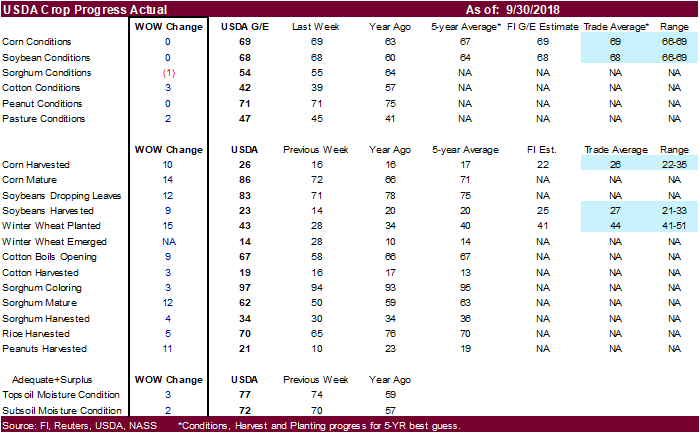
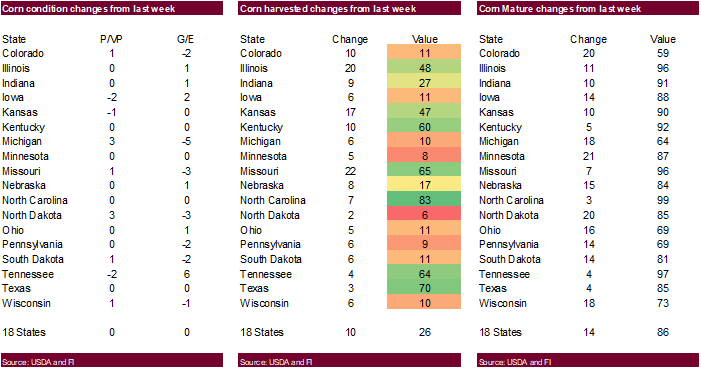
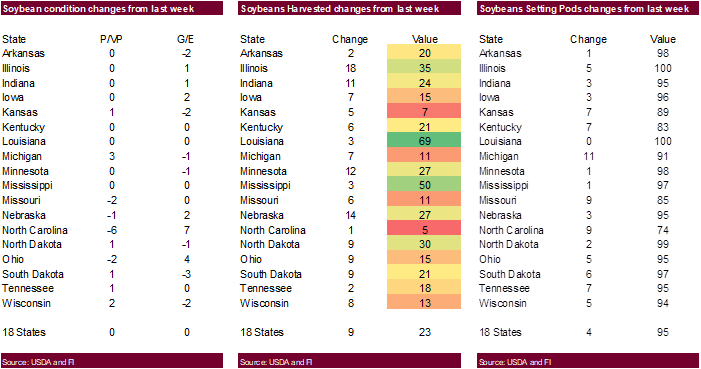
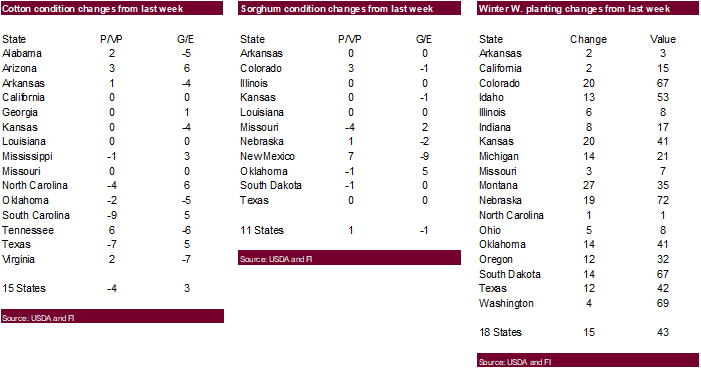
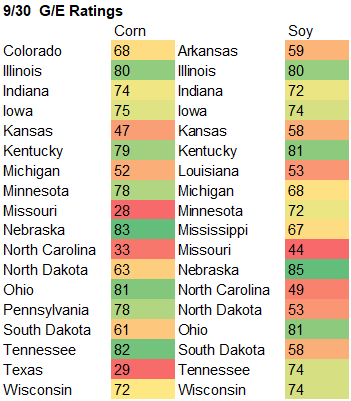
・ US crop conditions were unchanged in soybeans and corn, down one in sorghum, and up 3 for cotton. Corn harvest progress was up 10 points to 26, at trade expectations. Soybean harvest were 23 percent, up 9 points, and 4 points below expectations. Winter wheat plantings were 15 percent, one point below trade expectations.
・ Some areas of the WCB saw flash flooding over the weekend. Risk was thought to be corn related more so than soybeans. 0.25 to 0.75 inch occurred in southeastern Wisconsin and central Lower Michigan with some locally heavy rain occurred in northern Missouri near the Iowa border.
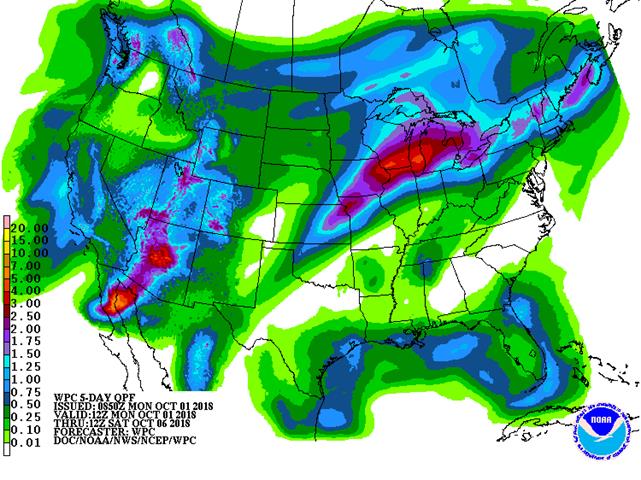
・ The Midwest weather outlook is wetter this morning.
・ The Midwest will be wet Thursday into mid-next week, bias WCB. The rain will delay harvesting efforts and raise concerns over quality for corn and soybeans. There will be an importance period of drier weather October 10-15, which will be needed for producers.
・ This week the Delta will be on the drier side. Showers will fall in the lower Midwest and Tennessee River Basin. Overall fieldwork activity across the Delta should improve.
・ Rain will fall from the southwestern desert areas through the northern Plains early to mid-week this week.
・ The Canada Prairies will be cold this week.
SIGNIFICANT CORN AND SOYBEAN BELT PRECIPITATION EVENTS
WEST CORN BELT EAST CORN BELT
Tdy-Tue 65% cvg of up to 0.70”
and local amts to 1.20”;
wettest north; south and
west-central Il. to
central In. driest
Tue-Wed 55% cvg of up to 0.50”
and local amts to 1.10”;
far SW and north
wettest
Wed-Thu 70% cvg of up to 0.60”
and local amts to 1.15”;
far south driest
Thu-Sat 80% cvg of up to 0.75”
and local amts to 2.0”
with some bands of
2.0-3.50” and locally
more in the south;
S.D. driest
Fri-Sun 80% cvg of up to 0.75”
and local amts to 2.0”;
driest SE
Sun-Oct 9 80% cvg of up to 0.75”
and local amts over 2.0”
with a few bands of
2.0-3.50” and locally
more
Oct 8-10 80% cvg of up to 0.75”
and local amts to 2.0”;
driest SE
Oct 10-15 5-20% daily cvg of up
to 0.25” and locally
more each day
Oct 11-15 5-20% daily cvg of up
to 0.25” and locally
more each day
U.S. DELTA/SOUTHEAST SIGNIFICANT PRECIPITATION EVENTS
DELTA SOUTHEAST
Tdy-Tue 5-20% daily cvg of up 10-20% daily cvg of
to 0.30” and locally up to 0.40” and locally
more each day more each day; west
and south wettest
Wed-Fri Up to 20% daily cvg of Up to 20% daily cvg of
up to 0.20” and locally up to 0.20” and locally
more each day; some more each day; some
days may be dry days may be dry
Sat 75% cvg of up to 0.75”
and local amts to 1.50”;
wettest south
Sat-Oct 9 5-20% daily cvg of up
to 0.30” and locally
more each day
Sun-Oct 8 5-20% daily cvg of up
to 0.30” and locally
more each day
Oct 9-10 80% cvg of up to 0.50”
and local amts to 1.10”
Oct 10-11 55% cvg of up to 0.35”
and local amts to 0.60”
Oct 11-15 Up to 20% daily cvg of
up to 0.20” and locally
more each day
Oct 12-15 Up to 20% daily cvg of
up to 0.20” and locally
more each day
Source: World Weather Inc. and FI
- New Zealand dairy auction on Global Dairy Trade online market starts ~7am ET (~noon London, ~11pm Wellington)
- EARNINGS: PepsiCo
WEDNESDAY, OCT. 3:
- EIA U.S. weekly ethanol inventories, output, 10:30am
THURSDAY, 0CT. 4:
- FAO food index for September, 4am ET (9am London)
- USDA weekly net-export sales for corn, wheat, soy, cotton, 8:30am
- Port of Rouen data on French grain exports
- Buenos Aires Grain Exchange weekly crop report
- Bloomberg weekly survey of analysts’ expectations on grain, sugar prices
FRIDAY, OCT. 5:
- FranceAgriMer weekly updates on French crop conditions
- ICE Futures Europe commitments of traders weekly report on coffee, cocoa, sugar positions, ~1:30pm ET (~6:30pm London)
- CFTC commitments of traders weekly report on positions for various U.S. futures and options, 3:30pm
Source: Bloomberg and FI
Brazil’s selected commodities exports for September
Commodity September 2018 August 2018 September 2017
COFFEE(60 KG BAG) 2,992,294 2,255,585 2,177,170
CRUDE OIL (TNS) 5,895,713 4,354,096 3,966,399
ETHANOL (LTR) 176,418,537 262,470,277 144,437,482
SOYBEANS (TNS) 4,610,804 8,127,228 4,272,462
IRON ORE 33,903,927 35,621,273 31,934,166
FROZEN ORANGE JUICE (TNS) 20,195 29,197 57,214
NON-FROZEN ORANGE JUICE (TNS) 123,734 112,279 177,512
SUGAR RAW (TNS) 2,288,633 1,444,137 2,947,262
Source: Reuters, FI, Brazil AgMin
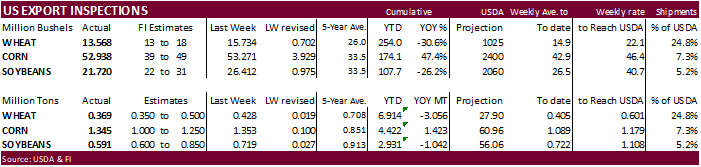
USDA inspections versus Reuters trade range
Wheat 369,270 versus 350000-500000 range
Corn 1,344,689 versus 1000000-1250000 range
Soybeans 591,115 versus 450000-850000 range
Corn.
- News on a NAFTA trade deal (Canada, Mexico and US) and lower outlook for China’s corn output by the USDA Attaché brought bull traders back to the market. USDA corn inspections were very high this week, adding to the bullish sentiment.
- December corn ended near its session high, up 9.50 cents on the day.
- Funds bought an estimated 21,000 corn contracts.
- President Trump will announce a successor soon. Leaders from Canada and US held press conferences today. This deal will not have too much to do with the agriculture products we follow, but it did lift concerns for some that thought a trade war between the US and Canada could develop. Canadian dairy producers are not happy with the deal. US gets to send more milk to Canada.
・ In 2018, the US exported about $3.2 billion of corn and corn products to Mexico and Canada, according to Bloomberg. US January through July corn exports to both of those countries are running at 9.921 million tons, up from 8.669 million tons during the same period in 2017.
- We like owning March/May/July corn. Demand remains good.
- Unfavorable rains fell over the weekend bias WCB over the weekend. Today was also new month/new money.
- China will see heavy rain this week across the NE growing areas.
- USDA’s Attaché updated their China corn situation and outlook. Data compiled in mid-September called for 2018 China corn production to end up at 221 million tons, 4 million below USDA’s official forecast due to unfavorable weather lowering yields. Imports were left unchanged at 5 million tons. They have China corn stocks dropping to 56 million tons (USDA @ 58.5MMT, down from 79.6MMT at the end of 2016-17).
- We are looking for a massive drop in China corn stocks by 2021-22, resulting in a STU below 5 percent. If China’s use for corn continues to grow even at a slow 1.5-1.6 percent per year, they still will need to import a lot of corn. By 2021-22, we think China could potentially import 25 million tons of corn per year. China could help solve supply constraints by adopting GMO corn.
- China wants E10 nationwide by 2020. We can’t see how this could be achieved as that will require a huge amount of corn.
- India has a tougher plan of attack to achieve E20 and B5 by 2030.
- See attached China charts and table.
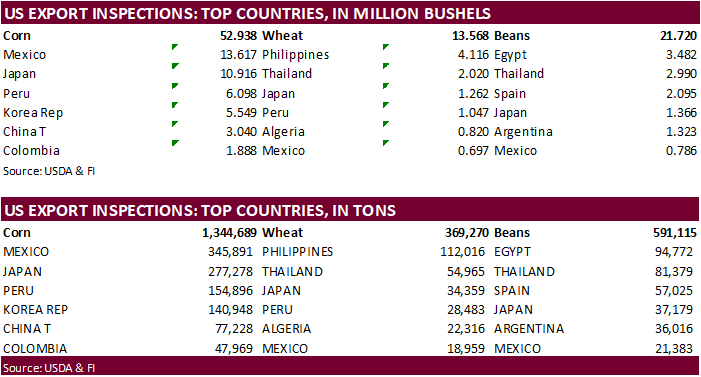
- USDA US corn export inspections as of September 27, 2018 were 1,344,689 tons, above a range of trade expectations, below 1,353,137 tons previous week and compares to 853,700 tons year ago. Major countries included Mexico for 345,891 tons, Japan for 277,278 tons, and Peru for 154,896 tons.
- Indonesia sees their corn production at 30.05 million tons versus 28.92 MMT last year.
- China reported a H5N6 bird flu case in Guizhou province.
- China is relaxing on some hog transport restrictions in areas where African Swine fever cases dropped.
・ The European Commission lowered its estimate for corn production to 61.9 million tons from 64.2 million previously and compares to 64.5MMT last year.
・ FC Stone estimated the corn crop at 14.940 billion bushels (+408 previous month) and yield at 182.7 (+5.0 bu/ac p/m). USDA is at 14.827 and 181.3.

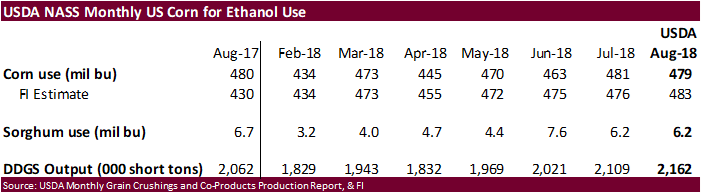
USDA NASS corn for ethanol grind for August was 479 million bushels, 4 million below our estimate, 2 million below July and 1 million below August 2017.
- 2017-18 corn for ethanol use ended up at 5.601 billion bushels, only one million above USDA’s official forecast.
- Sorghum use was unchanged from the previous month at 6.2 million bushels.
- DDGS production increased to 2.162 million short tons from 2.109 million in July.
- Earlier today we raised our 2018-19 estimate for corn for ethanol use by 25 million bushels to 5.750 billion, 150 million above USDA, and compares to 5.601 million (revised 10/1/18) we are using for the 2017-18.
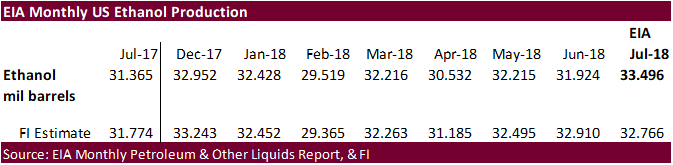
EIA monthly ethanol data was better than what we expected at 33.496 million barrels for the month of July, above 31.365 million a year earlier. Separately we raised our 2018-19 estimate for corn for ethanol use by 25 million bushels to 5.750 billion, 150 million above USDA, and compares to 5.601 million (revised 10/1/18) we are using for the 2017-18.
・ China will sell 8 million tons of corn for the week ending October 5.
・ China sold about 85.5 million tons of corn out of reserves this season and some are predicting up to 100 million tons will be sold by the end of the marketing season.
Corn basis rebounded last week
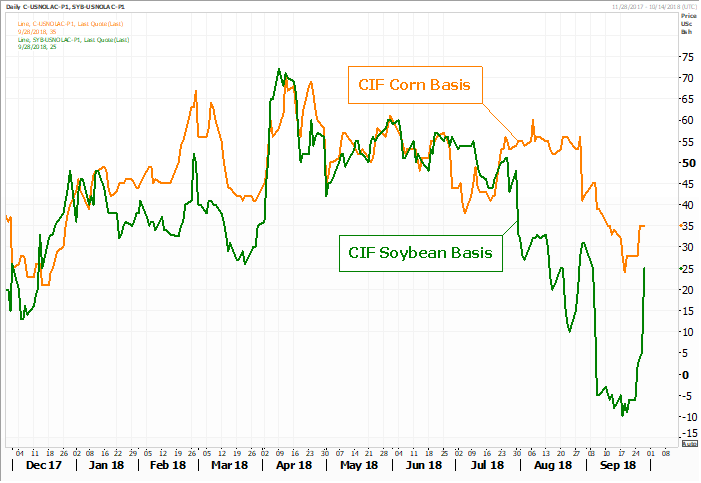
Source: Reuters and FI
・ December corn may trade in a $3.50-$3.80 range; March $3.25-$4.00
・ Traders cheered the Mexico/Canada/US trade agreement by buying commodities across the board.
・ November soybeans hit their highest level since August 23, settling 12.25 cents higher. Meal was up $4.80 basis the Dec and soybean oil 32 higher.
・ Funds bought an estimated 7,000 soybean contracts, bought 4,000 soybean meal and bought 6,000 soybean oil.
・ Soybean meal led the products higher. Soybean oil traded higher, but gains were limited on meal/oil spreading despite friendly data released by the EIA. Offshore and outside markets were supportive for soybean products. WTI crude was sharply higher.
・ BOZ is back near its 100-day MA. Last time it was above it was May 24th. Look for buy stops it trades through it this week.
・ Soybean and corn basis across several US locations were steady to easier on Monday. Council Bluffs soybean basis fell 25 points to 100 under.
・ US January through July soybean exports to both Mexico and Canada are running at 2.692 million tons, up from 2.374 million tons during the same period in 2017.
・ Next on the trade list for the US should be China, but President Trump said it’s too soon to talk with China on trade.
・ Brazil exported only 4.61 million tons of soybeans in September, down from 8.13 million tons in August and 4.27 million tons a year ago. Brazil also exported 1.29 MMT of soybean meal (1.46MMT in Aug and 1.16 Sep ’17) and 84,599 tons of soybean oil (209,268 tons in August & 10,443 tons a year ago).
・ Argentina soybean export commitments surged last week to over 350,000 tons.
- USDA US soybean export inspections as of September 27, 2018 were 591,115 tons, within a range of trade expectations, below 718,825 tons previous week and compares to 897,384 tons year ago. Major countries included Egypt for 94,772 tons, Thailand for 81,379 tons, and Spain for 57,025 tons.
- USDA reported another 36k of soybeans to Argentina. There were no shipments out of the PNW for the week ending September 27.
・ China is on holiday all week.
・ GAPKI reported August Indonesia palm exports at 2.99 million tons, up from 2.81MMT previous month and 2.98 million during August 2017.
・ The European Commission increased its estimate for the rapeseed crop to 19.7MMT t from 19.2 last month, below 21.95 in 2017-18.
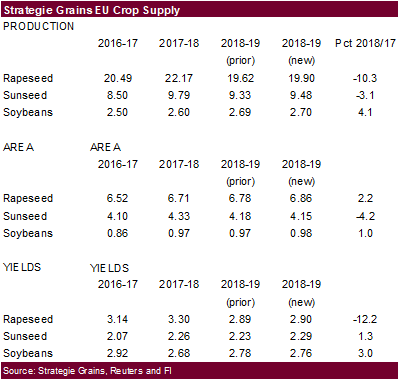
・ Strategie Grains estimated EU rapeseed production for 2018-19 at 19.9 million tons, up from 19.62MMT previously and compares to their forecast of 22.17 million tons in 2017-18.
・ FC Stone estimated the Brazil 2018-19 soybean crop at 119.35 million tons, up from prior 119.17 MMT. The soybean planted area was estimated at 35.892 million hectares from previous 35.855 million. Exports were estimated at 71.50 MMT with bulk of the share going to China. If Brazil can handle it, they can export more than that amount, in our opinion, and import US soybeans to crush.
・ A Reuters poll calls for the soybean crop area in Brazil to average 36.14 million hectares (+2.8% yoy), and production at 120.4 million tons versus 119.76 million seen in August.
・ FC Stone estimated the soybean crop at 4.796 billion bushels (+14 previous month) and yield at 54.0 (+0.2 p/m). USDA is at 4.693 and 52.8.

- China will offer 100,000 tons of soybeans out of reserves on October 10.
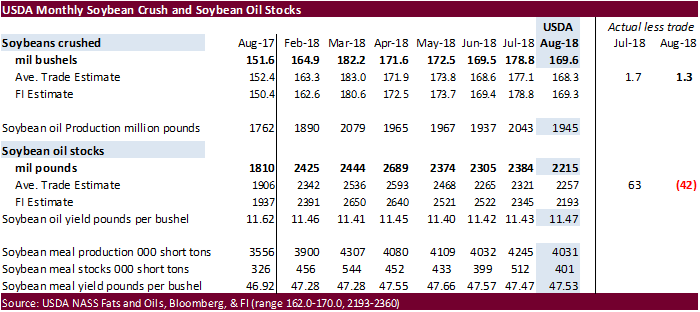
・ The August crush came in at 169.6 million bushels, putting September through August crush at 2.055 billion bushels, same as USDA WASDE.
・ The crush was 1.3 million bushels higher than expectations.
・ Soybean oil stocks were 2.215 billion pounds, 42 million below the trade guess.
・ Soybean meal stocks fell to 401,000 short tons from 512,000 short tons on good demand and lower crush rate.
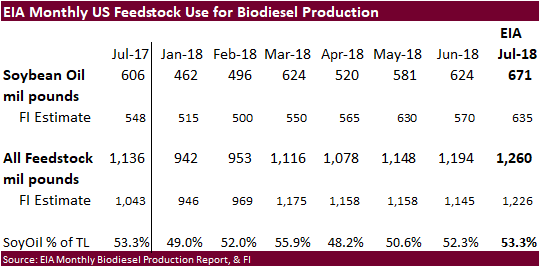
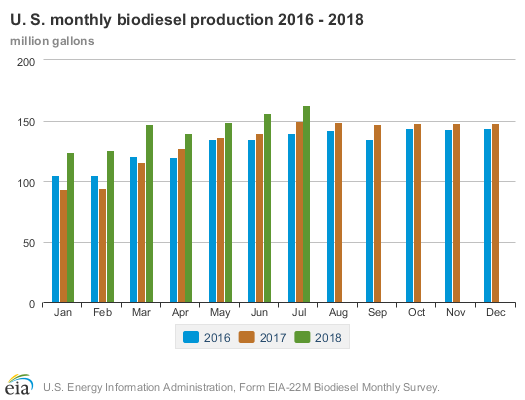
US production of biodiesel was 163 million gallons in July 2018, 7 million gallons higher than production in June 2018. There was a total of 1,260 million pounds of feedstocks used to produce biodiesel in July 2018, up from 1,145 million in June 2018 and 1,043 million in July 2017. Soybean oil remained the largest biodiesel feedstock during July 2018 with 671 million pounds consumed, 47 million higher than June, and 65 million above July 2017. The soybean oil use was much higher than our 635-million-pound projection.
We raised our soybean oil for biodiesel use for 2017-18 by 50 million pounds to 7.050 billion pounds, 50 million pounds above USDA. Our 2018-19 soybean oil for biodiesel use is 7.600 billion pounds. USDA is at 7.800 billion pounds for new-crop.
Major soybean exporters
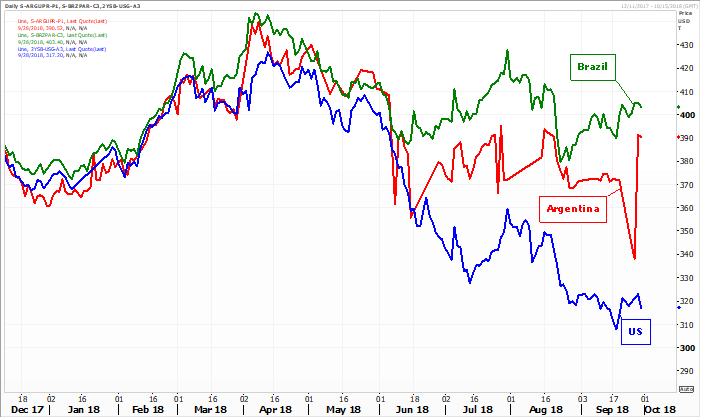
Source: Reuters and FI
・ November soybeans are seen in a $8.05-$8.85 range, March $7.85-$9.15
・ December soybean meal $305-$340 range; March $295-$400
・ December soybean oil 27.80-30.50; March 28.60-31.50
- Wheat traded two-sided before rallying 4-7 cents by afternoon trading. Chicago old off at the close, ending 0.50-4.75 cents higher led by bear spreading. KC finished in similar fashion, 0.25-3.75 cents higher. MN was up 3.0-4.75 cents.
- Funds bought 2,000 SRW wheat contracts.
- USDA US all-wheat export inspections as of September 27, 2018 were 369,270 tons, within a range of trade expectations, below 428,214 tons previous week and compares to 739,246 tons year ago. Major countries included Philippines for 112,016 tons, Thailand for 54,965 tons, and Japan for 34,359 tons.
・ Paris December wheat ended at 201.25, down 0.25 euro.
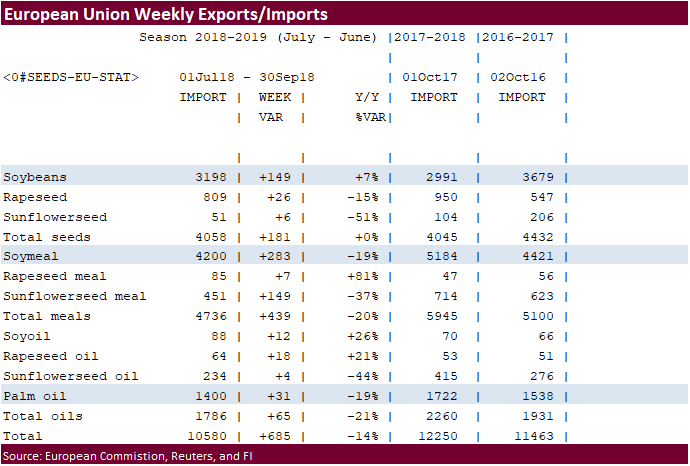
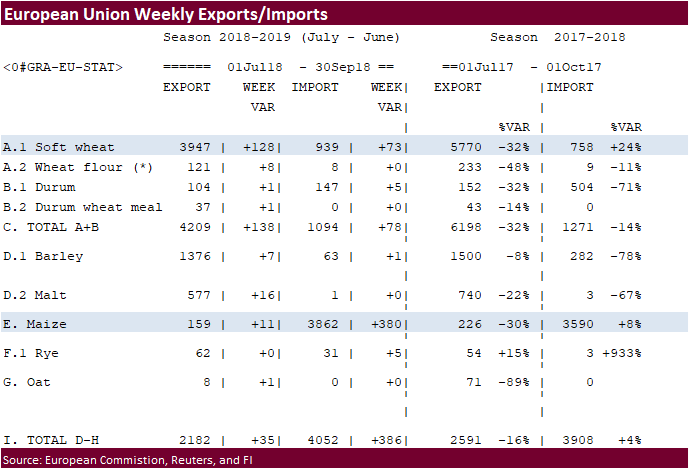
・ The European Union granted export licenses for 128,000 tons of soft wheat imports, bringing cumulative 2018-19 soft wheat export commitments to 3.947 million tons, well down from 5.770 million tons committed at this time last year.
・ IKAR reported 12.5% Russian wheat export prices up $4/ton to $224/ton from the previous week. SovEcon reported prices up $4/ton to $226/ton.
・ Russia collected 98.4 million tons of grains so far this season, down from 124.3 million tons last year.
・ Saudi Arabia will allow private importers to buy feed barley.
- Libya seeks 1 million tons of Russian wheat.
- There are no offers in Morocco’s import tender for 336,364 tons of US durum wheat for arrival by December 31.
- Bahrain seeks 25,000 tons of wheat on October 2 for Nov shipment.
- Taiwan seeks 110,000 tons of US wheat on October 2 for Nov-Dec shipment.
- Jordan retendered for another 100,000 tons of feed barley on October 3.
- Bangladesh seeks 50,000 tons of 12.5 percent wheat on October 9, optional origin.
- Japan in a SBS import tender seeks 120,000 tons of feed wheat and 200,000 tons of barley on October 10 for arrival by late February.
- Postponed: UAE seeks 60,000 tons of wheat for Oct/Nov shipment.
Rice/Other
・ Argentina rice was the lowest offer for Iraq at $562.75/ton.
・ Thailand seeks to sell 120,000 tons of sugar on October 3.
・ The Philippines seek 250,000 tons of rice on October 18 for arrival by late November.
・ Mauritius seeks 9,000 tons of rice for delivery between Nov. 15, 2018, and March 31, 2019, set to close is Sept. 27.
9/28/18. Trading ranges:
- December Chicago wheat $4.95-$5.25; March $5.10-$5.90.
- December KC $5.00-$5.35; March $5.00-$6.00. (remain tight with Chicago)
- December MN $5.60-$6.25 range; March $5.75-$7.00
Terry Reilly
Senior Commodity Analyst C Grain and Oilseeds
Futures International │190 S LaSalle St., Suite 410│Chicago, IL 60603
W: 312.604.1366
AIM: fi_treilly
ICE IM: treilly1
Skype: fi.treilly

Trading of futures, options, swaps and other derivatives is risky and is not suitable for all persons. All of these investment products are leveraged, and you can lose more than your initial deposit. Each investment product is offered only to and from jurisdictions where solicitation and sale are lawful, and in accordance with applicable laws and regulations in such jurisdiction. The information provided here should not be relied upon as a substitute for independent research before making your investment decisions. Futures International, LLC is merely providing this information for your general information and the information does not take into account any particular individual’s investment objectives, financial situation, or needs. All investors should obtain advice based on their unique situation before making any investment decision. The contents of this communication and any attachments are for informational purposes only and under no circumstances should they be construed as an offer to buy or sell, or a solicitation to buy or sell any future, option, swap or other derivative. The sources for the information and any opinions in this communication are believed to be reliable, but Futures International, LLC does not warrant or guarantee the accuracy of such information or opinions. Futures International, LLC and its principals and employees may take positions different from any positions described in this communication. Past results are not necessarily indicative of future results.
This email, any information contained herein and any files transmitted with it (collectively, the Material) are the sole property of OTC Global Holdings LP and its affiliates (OTCGH); are confidential, may be legally privileged and are intended solely for the use of the individual or entity to whom they are addressed. Unauthorized disclosure, copying or distribution of the Material, is strictly prohibited and the recipient shall not redistribute the Material in any form to a third party. Please notify the sender immediately by email if you have received this email by mistake, delete this email from your system and destroy any hard copies. OTCGH waives no privilege or confidentiality due to any mistaken transmission of this email.