From: Terry Reilly
Sent: Wednesday, September 12, 2018 12:22:16 PM (UTC-06:00) Central Time (US & Canada)
Subject: FI Grain Market Snapshot 09/12/18
See attached PDF for trade versus actual results
USDA released their September supply and demand report
USDA report initial reaction
· Bearish CBOT grain and oilseeds commodities.
· In August soybeans had their month for a large upward revision in the US yield. In September it was corn’s turn.
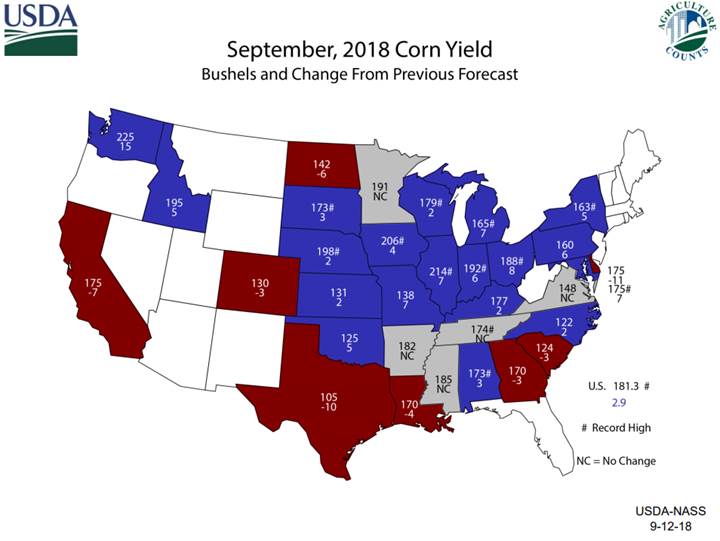
· US corn yield 181.3, up 2.9 mom, and 3.5 above average
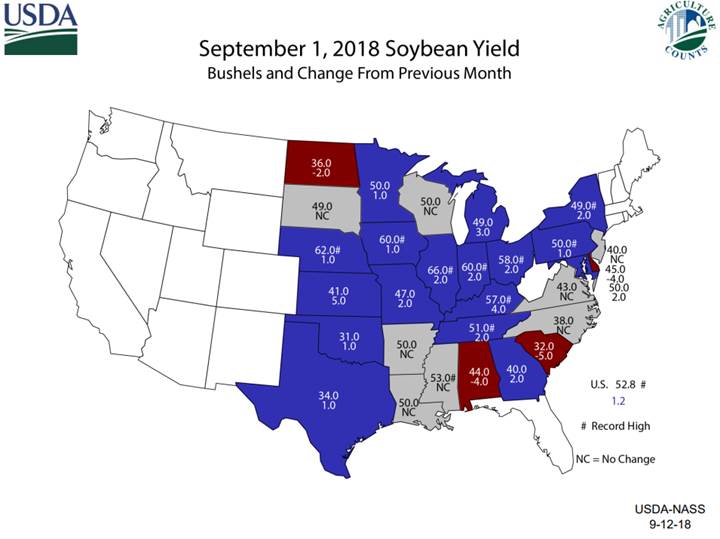
· US soybean yield 52.8, up 1.2 mom, and 0.6 above average
· USDA’s second survey of the 2018 corn and soybean production were released and both crops again came in well above expectations.
· The 2018-19 US soybean outlook this month is higher supplies, greater use, and record stocks.
· The 2018-19 US corn outlook is for larger supplies, greater use, and larger ending stocks.
· The 2018-19 US wheat outlook this month is unchanged supplies, unchanged use, and unchanged stocks.
· Soybeans traded higher post report on unwinding of corn/soybean spreads.
· CBOT crush margins are getting hammered.
· We could soon see November soybeans trade at $8.00-$8.05, a contract low.
· USDA reported a US soybean yield of 52.8, a record (52.0 in 2016). Eight states are projected at a record, up from six last month.
· US 2018-19 soybean production was estimated at 4.693 billion bushels, 44 million above an average trade guess and 107 million higher than last month. This is 301 million bushels above last year.
· US stocks of soybean for 2017-18 were lowered 35 million bushels (0.95MMT) to 395 million by USDA from last month due to an increase in crush (15) and exports (20).
· The US 2017-18 carryout came in 31 million bushels less than a Reuters trade estimate.
· The result decreased the STU to 9.1% versus 10.0% last month.
· The reduction is stocks for old-crop was more than offset by larger new-crop supplies.
· US 2018-19 soybean stocks were estimated at a record 845 million bushels, 15 million above a Reuters trade estimate, 60 million greater than last month, and 119% above 2017-18. The 2018-19 crush was increased 10 million bu, exports were unchanged, and residual up 1 million. The result increased the carryout by 60 million bushels.
· The 2018-19 US STU increased to 19.8% from 18.4 percent last month. Note the US corn STU is at 11.7% for new-crop and wheat 42.9%.
· US soybean oil food usage for 2017-18 was increased 100 million pounds and biodiesel by 100. Exports were left unchanged. SBO production was increased 185 million pounds after USDA increased its crush. Current year soybean oil stocks are down 15 million pounds from previous month, friendly bull spreads in our opinion.
· For new-crop, USDA increased US soybean oil production by 115 million pounds and increased stocks by 100 million pounds. The demand categories were left unchanged at 2.166 billion pounds, above 2.156 billion for 2017-18.
· USDA increased US 2017-18 soybean meal production by 400,000 short tons and increased domestic use by 100,000 and increased exports by a large 300,000 short tons (up 900,000 over last two months), resulting in the “new normal” unchanged carryout of 400,000 short tons.
· Look for the final 2017-18 carryout to end up larger than 400,000 short tons.
· New-crop US soybean meal production was increased 250,000 short tons to 48.950 million, now above 2017-18. The increased exports by 150,000 short tons to 13.500 million, below 14.400 for 2017-18. Domestic use is 100,000 short tons higher at 35.8 million, 800,000 above 2017-18.
2017-18 world balance highlights:
· Argentina soybean production was upwardly revised 0.8MMT to 37.8 and Brazil unchanged at 119.5MMT.
· Brazil soybean exports were increased 1.2MMt to 76.7 million tons, 13.6MMT above 2016-17.
· China soybean imports for 2017-18 were lowered 2.0 million tons to 94.0 million.
· 2017-18 world production increased 0.1MMT to 336.8MMT, 11.3MMT below 2016-17, and 2017-18 global ending stocks decreased 0.9 million tons.
2018-19 world balance highlights:
· 2018-19 world soybean production was increased 2.2 million tons to 369.3 million, 32.5 million above 2017-18.
· 2018-19 global soybean ending stocks were increased 2.3 million tons to a record 108.3 million, 13.5 million above the current year. US soybean stocks increased 2.9 million tons.
· USDA left new-crop Brazil and Argentina production unchanged.
· USDA: The U.S. season-average soybean price is forecast between $7.35-$9.85 versus $7.65 to $10.15 per bushel last month. Soybean meal prices are forecast between $290-$330/short ton versus $295 to $335 last month. The soybean oil price forecast between 28.0-32.0 cents per pound, unchanged from the previous month and July.
Corn
· We could soon see December corn trade at $4.45-$4.50, a contract low.
· New-crop US corn production below away analysts estimates by increasing 241 million bushels from last month to 14.827 billion bushels, 298 million above the trade average and 223 million above 2017.
· US stocks of corn for 2017-18 were lowered 25 million to 2.002 billion by USDA from last month. USDA took US old crop corn exports 25 million higher.
· USDA increased new-crop US ending stocks by 90 million bushels to 1.774 billion, 135 million above an average trade guess.
· The result increased the new-crop STU to 11.7 percent versus 11.2% last month, down from 13.4 at the end of 2017-18.
· 2018-19 corn for feed was taken up 50 million and ethanol was revised higher by 25 million 5.650 billion bushels. They are still at least 50 million bushels too low on corn for ethanol use. Exports were raised 50 million bushels to 2.400 billion, 25 below 2017-18.
· 2017-18 world corn production and stocks were increased 0.3 million tons and 0.8MMT, respectively. USDA cut 2017-18 Brazil and Argentina corn output by 1.0 million tons, each, to 82.0 and 32.0 million tons.
· New-crop 2018-19 world corn production was increased 6.8 million tons and stocks were revised higher by 3.5 million tons.
· 2018-19 EU corn production was increased 1.0 (they lowered it 1.7 million tons last month) to 60.8 million, 1.5MMT below 2017-18.
· There were no changes to China’s new-crop production of 225 million tons, despite other reports suggesting lower output. However, CASDE raised production today from last month, but they are at 213 million tons, a big discrepancy.
· USDA: The season-average corn price received by producers is lowered 10 cents at the midpoint for a range of $3.00-$4.00 per bushel from $3.10-$4.10 last month.
· An increase in world wheat stocks by 3.4 million tons from last month sent wheat futures lower. At 261.3 million tons, its 3.7 million tons above the average trade guess.
· Chicago December wheat could retest $4.90, and trade down to $4.80 sometime by mid-October.
· USDA left its all-wheat S&D unchanged for 2017-18 and 2018-19.
· By class, high protein wheat stocks of HRW and durum increased.
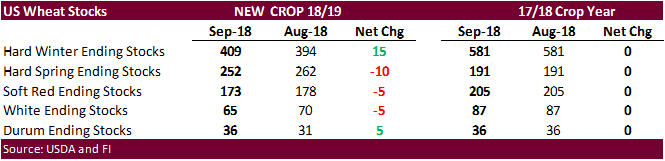
· The US STU is currently at 25.5% versus 29.9% last month.
· The bearish case in wheat is tied with the world balance.
· 2018 world production was increased unexpectedly by 3.4 million tons to 733 million tons, 25.3 million below 2017.
· World ending stocks were increased 2.3 million to million tons to 261.3MMT, 3.7MMT above the average trade guess, and 13.1 million below 2017-18.
· Production reductions were noted for Australia (2.0 to 20.0) and Canada (1.0 to 31.5).
· Russia was taken up 3.0 million tons and India by 2.7 million tons.
· The EU wheat crop was left unchanged at 137.5 million tons.
· USDA: The 2018/19 season-average farm price was narrowed $0.10 per bushel on both ends to $4.70-$5.50 from $4.60 to $5.60 last month.
https://www.nass.usda.gov/Newsroom/Executive_Briefings/2018/09-12-2018.pdf
FI Price Projections:
· December corn may now trade in a $3.35-$3.80 range.
· November soybeans are seen in a $8.00-$9.00 range
· December soybean meal $300-340 range
· December soybean oil 27.25-29.00
- December Chicago wheat $4.90-$5.45 range.
- December KC $4.90-$5.55 range.
- December MN $5.45-$6.00 range.
See attached PDF for trade versus actual results
Terry Reilly
Senior Commodity Analyst – Grain and Oilseeds
Futures International │190 S LaSalle St., Suite 410│Chicago, IL 60603
W: 312.604.1366
AIM: fi_treilly
ICE IM: treilly1
Skype: fi.treilly

Trading of futures, options, swaps and other derivatives is risky and is not suitable for all persons. All of these investment products are leveraged, and you can lose more than your initial deposit. Each investment product is offered only to and from jurisdictions where solicitation and sale are lawful, and in accordance with applicable laws and regulations in such jurisdiction. The information provided here should not be relied upon as a substitute for independent research before making your investment decisions. Futures International, LLC is merely providing this information for your general information and the information does not take into account any particular individual’s investment objectives, financial situation, or needs. All investors should obtain advice based on their unique situation before making any investment decision. The contents of this communication and any attachments are for informational purposes only and under no circumstances should they be construed as an offer to buy or sell, or a solicitation to buy or sell any future, option, swap or other derivative. The sources for the information and any opinions in this communication are believed to be reliable, but Futures International, LLC does not warrant or guarantee the accuracy of such information or opinions. Futures International, LLC and its principals and employees may take positions different from any positions described in this communication. Past results are not necessarily indicative of future results.
This email, any information contained herein and any files transmitted with it (collectively, the Material) are the sole property of OTC Global Holdings LP and its affiliates (OTC); are confidential, may be legally privileged and are intended solely for the use of the individual or entity to whom they are addressed. Unauthorized disclosure, copying or distribution of the Material, is strictly prohibited and the recipient shall not redistribute the Material in any form to a third party. Please notify the sender immediately by email if you have received this email by mistake, delete this email from your system and destroy any hard copies. OTC waives no privilege or confidentiality due to any mistaken transmission of this email.