From: Terry Reilly
Sent: Thursday, July 12, 2018 12:54:59 PM (UTC-06:00) Central Time (US & Canada)
Subject: FI Grain Market Update 07/12/18
PDF attached
USDA released their July supply and demand report
Initial reaction
· The report concentrated on changes to demand, not so much to supply.
· The report is bullish corn, friendly wheat, and bearish soybeans and soybean products.
· The corn buying post report maybe short lived. We look for US inventories to increase next month when USDA reports their initial 2018 survey based yield estimate.
· Note USDA did not change its US corn and soybean yields from June. Current crop conditions suggest the August yields will be higher than USDA’s current working estimates.
· Some of the changes in US demand were the largest we have ever seen.
USDA Executive Briefing
https://www.usda.gov/oce/commodity/wasde/Secretary_Briefing.pdf
https://www.nass.usda.gov/Newsroom/Executive_Briefings/2018/07-12-2018.pdf
Soybeans
· A bullish corn outlook limited losses for US soybean futures.
· US stocks of soybean for 2017-18 were lowered 40 million bushels (1.09MMT) to 465 million by USDA from last month due to an increase in crush (15) and exports (20), along with higher residual and lower imports (3).
· The US 2017-18 carryout came in 42 million bushels less than a Reuters trade estimate.
· The result decreased the STU to 10.9% versus 12% last month.
· Sounds bullish? Well USDA made big changes for 2018-19 assuming no change in the US/China trade tariff situation.
· US 2018-19 soybean stocks were estimated at 580 million bushels, largest since 2006-07, 109 million above a Reuters trade estimate, and 195 million greater than last month.
· USDA increased production by 30 million bushels to 4.310 billion, after incorporating the June Acreage report.
· Considering China absent from the US soybean export market, USDA lowered exports by 250 million bushels to 2.040 billion, 45 million below 2017-18.
· The crush for 2018-19 was raised 45 million bushels to 2.045 billion, 15 above 2017-18.
· This resulted in a US carryout expanding 54 percent from 2017-18.
· US soybean oil for biodiesel for 2017-18 was increased 100 million pounds and exports raised 50 million. SBO production was increased 290 million pounds after USDA increased its crush. Current year soybean oil stocks are up 140 million pounds from previous month, bearish in our opinion.
· For new-crop, USDA increased US soybean oil production by 520 million pounds. With a higher carry in, USDA decided to stuff 500 million pounds in biodiesel and another 100 million in exports, resulting in a 60-million-pound increase in SBO 2018-19 ending stocks.
· USDA increased US 2017-18 soybean meal production by 600,000 short tons, and increased domestic use by 100,000 and exports by 400,000 short tons. This increased the carryout by 100,000 short tons to 400,000 short tons. Note new-crop ending stocks were also raised 100,000 short tons to 400,000. This might become the new norm. USDA traditionally used 300,000 short tons as a benchmark carryout.
· New-crop US soybean meal production was increased 1 million short tons. USDA’s 1.1 million short ton increase in 2018-19 meal supply allowed them to increase domestic use by 300,000 and exports by 700,000 tons. 2018-19 US soybean meal exports of 13.100 million short tons are still 400,000 below 2017-18.
· USDA lowered 2016-17 Argentina soybean production by 2.8 million tons but global stocks decreased only 700,000 tons.
· 2017-18 world ending stocks increased 3.5 million tons. USDA increased Brazil’s soybean production by 0.5 million tons to 119.5 million. Argentina was left unchanged.
· 2018-19 world soybean production was increased 4.3 million tons to 359.5 million, 22.8 million above 2017-18.
· What was most surprising was a 11.3 million ton increase in 2018-19 world soybean stocks to 93.8 million, 2.3 million above the current year, which is a record. US soybean stocks increased 5.3 million tons.
· USDA took new-crop Brazil and Argentina production up 2.5 and 1.5 million tons, respectively.
· USDA increased 2018-19 Brazil soybean exports by 2.1 million tons to 75 million tons, 0.3MMT higher than 2017-18.
Corn
· US stocks of corn for 2017-18 were decreased 75 million bushels to 2.027 billion by USDA from last month due to a 50-million-bushel downward revision in US corn for feed usage to 5.450 million bushels, offset by a 25-million-bushel increase in ethanol and 100 million increase in exports.
· 2017-18 corn exports are projected at 2.400 billion. 2018-19 on the other hand are 2.225 billion. We assume Brazil’s soybean area will increase 3.2 percent for 2018-19, resulting in a lower corn area. This could allow USDA a cushion of about 400-500 million bushels of an increase in exports for new-crop should the market realize a 600 to 800 million bushel increase in 2018 US production in light from a higher August yield, if good crop conditions remain. We are at 180.5 bushels per acre versus USDA’s 174.0 bushels for the 2018 yield.
· USDA increased new-crop US production by 190 million after incorporating the higher harvested area.
· 2018-19 feed was taken up 75 million and ethanol lowered 50 to 5.625 billion bushels. USDA is looking for new-crop US ethanol to expand only 25 million. With all the new high efficiency ethanol plants coming online, new and existing expansion, we think USDA is way too low on current and new-crop corn for ethanol usage.
· USDA lowered new-crop US corn stocks by an unexpected 25 million bushels to 1.552 billion, 160 million below the trade average. Stocks are projected down 23 percent from 2017-18.
· The result decreased the new-crop STU to 10.5 percent versus 10.8% last month.
· 2017-18 world corn production and stocks were lowered 1.0 million tons each. USDA cut 2017-18 Brazil corn output by 1.5 million tons to 83.5 million, 15 million below 2016-17.
· New-crop 2018-19 world corn production was increased 1.9 million tons but stocks were revised down 2.7 million tons (US, EU and Mexico part of that reduction in stocks).
· 2018-19 Eu corn production was increased 500,000 tons to 61.5 million, 700,000 below 2016-17. This could go lower next month.
· There were no changes to China’s new-crop production of 225 million tons, despite other reports suggesting lower output.
Wheat
· USDA increased US 2018-19 wheat stocks by 39 million bushels to 985 billion, 12 million above an average trade guess.
· US wheat production was increased 54 million bushels to 1.881 billion, 23 million above a Reuters trade guess. Winter wheat was taken down 5 million bushels, with higher HRW (7), lower SRW (13), and higher White (1).
· US other spring was estimated at 614 million bushels, 15 million above the trade and well above 416 million bushels in 2017.
· US durum was pegged at 75 million, 3 million above the trade and up from 55 million in 2017.
· USDA adjusted their all-wheat US carry in stocks by increasing it by 20 million (June 1 stocks), resulting in 74 million bushels increase in total supply. So, USDA increased its 2018-19 feed use by 10 million and lifted exports 25 million higher to 975 million, 74 million above 2017-18. US exports need to improve to reach USDA’s export target.
· By class, USDA in its initial estimate, projected a decline in US HRW, SRW, and White stocks from the previous year. HRW and Durum US stocks are expected to increase from 2017-18.
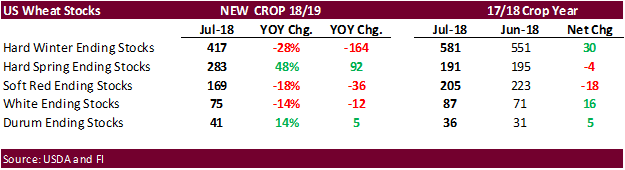
· The US STU is currently at 46.2% versus 45.1% last month.
· The bullish case in wheat is tied with the world balance.
· 2018 world production was lowered 8.4 million tons to 736.3 million tons, 21.7 million below 2017.
· World ending stocks were decreased 5.3 million to 260.9 million tons, 12.6 million below 2017-18.
· Production for Australia (2.0), Ukraine (1.0), Russia (1.5), EU (4.4), and China (1.0) were lowered from the previous month.
FI Price Projections:
· September corn may now trade in a large $3.00-$3.90 range. December corn is seen in a $3.00-4.50 range. If the US good/excellent US corn condition hold over through July, look for December corn to possibly test the $2.90 area.
· August soybeans are seen in a $8.00-$8.75 range; November $7.75-$9.50 range.
· August soybean meal $290-355 range; December $280-$400 range.
· August soybean oil 28.00-30.00 range; December 27.00-30.50 range.
- September Chicago wheat $4.50-$5.25 range.
- September KC $4.50-$5.30 range.
- September MN $5.00-$5.90 range.
See attached PDF for trade versus actual results
Terry Reilly
Senior Commodity Analyst – Grain and Oilseeds
Futures International │190 S LaSalle St., Suite 410│Chicago, IL 60603
W: 312.604.1366
AIM: fi_treilly
ICE IM: treilly1
Skype: fi.treilly

Trading of futures, options, swaps and other derivatives is risky and is not suitable for all persons. All of these investment products are leveraged, and you can lose more than your initial deposit. Each investment product is offered only to and from jurisdictions where solicitation and sale are lawful, and in accordance with applicable laws and regulations in such jurisdiction. The information provided here should not be relied upon as a substitute for independent research before making your investment decisions. Futures International, LLC is merely providing this information for your general information and the information does not take into account any particular individual’s investment objectives, financial situation, or needs. All investors should obtain advice based on their unique situation before making any investment decision. The contents of this communication and any attachments are for informational purposes only and under no circumstances should they be construed as an offer to buy or sell, or a solicitation to buy or sell any future, option, swap or other derivative. The sources for the information and any opinions in this communication are believed to be reliable, but Futures International, LLC does not warrant or guarantee the accuracy of such information or opinions. Futures International, LLC and its principals and employees may take positions different from any positions described in this communication. Past results are not necessarily indicative of future results.