From: Terry Reilly
Sent: Friday, September 28, 2018 12:38:25 PM (UTC-06:00) Central Time (US & Canada)
Subject: FI Grain Market Update 09/28/18
PDF attached
USDA released their Grain Stocks as of September 1 and Small Grains Summary
USDA Links to reports
http://usda.mannlib.cornell.edu/MannUsda/viewDocumentInfo.do?documentID=1079
http://usda.mannlib.cornell.edu/MannUsda/viewDocumentInfo.do?documentID=1268
Executive Briefings
https://www.nass.usda.gov/Newsroom/Executive_Briefings/index.php
USDA report initial reaction
· Bearish CBOT grain and oilseeds commodities.
· September 1 grain stocks were all above trade expectations, and prices were quickly to respond. After wheat began to stabilize, buyers rushed to the market which turned prices around, but then wheat prices turned lower in afternoon trading. Corn and soybean futures began to pair losses shortly after the report but made new session lows after buying activity dried.
Summary
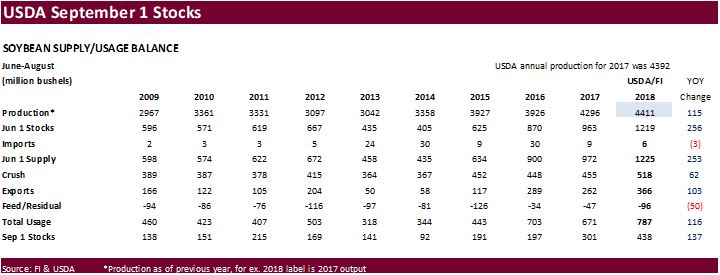
2017 soybean production is revised up 19.1 million bushels from the previous estimate. USDA noted the planted area was unchanged at 90.1 million acres, and harvested area is unchanged at 89.5 million acres. The 2017 yield, at 49.3 bushels per acre, is up 0.2 bushel from the previous estimate.
For state changes, USDA increased 2017 soybean production for IA by 5.0 million bushels, KS by 2.6, MN by 4.0, Missouri by 3.0, and ND at 3.5 million bushels.
See table after the text…
US soybean stocks as of September 1 were reported at 428 million bushels, 37 million above a Reuters trade guess (last year soybeans were reported 37 million below the trade guess), and above 302 million at the end of 2016-17. We estimate the crop-year residual at 13 million bushels versus 32 million by USDA.
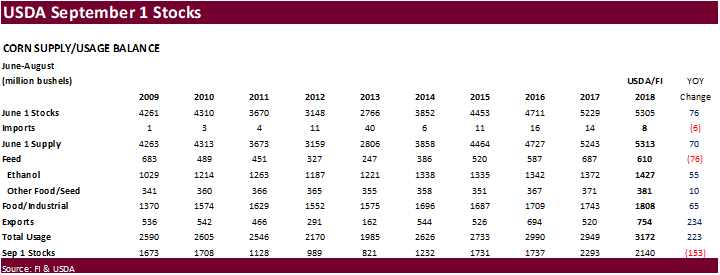
USDA September 1 corn stocks came in 130 million bushels above the trade guess at 2.140 billion bushels (last year 58 below), down from 2.293 billion at the end of 2016-17. Our 2017-18 US corn for feed is estimated at 5.308 billion bushels, versus 5.450 billion for USDA.
September 1 all wheat stocks of 2.379 billion bushels were 36 million above trade expectations (trade missed last year’s number, with it 48 higher). We look for USDA to lower its 2018-19 US wheat for feed by 5 million bushels on October 11 to 125 million bushels.
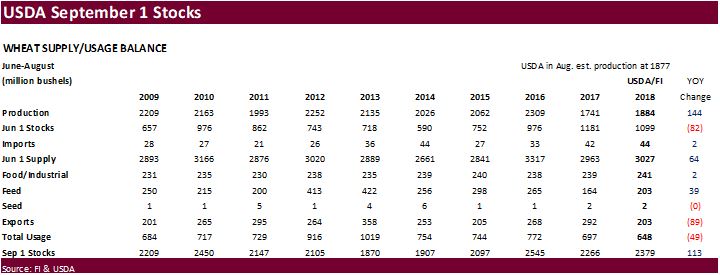
2018 all-wheat production was upward revised 7 million bushels but came in 12 million bushels above trade expectations. USDA upward revised the other spring wheat crop by 9 million bushels to 623 million, 14 million above expectations. USDA also took up the durum crop by 4 million bushels from its August estimate and revised lower the winter wheat crop by 5 million bushels.
As a result, wheat prices took a hit, but rebounded, only to trade lower gain in afternoon trading. We look for a good area expansion in 2019 amid expansion in winter wheat plantings. Prices are higher than this time last year.
See attached PDF for tables/charts
FI Price Projections:
· December corn may trade in a $3.50-$3.80 range; March $3.25-$4.00
· November soybeans are seen in a $8.05-$8.85 range, March $7.85-$9.15
· December soybean meal $305-$340 range; March $295-$400
· December soybean oil 27.80-30.50; March 28.60-31.50
- December Chicago wheat $4.95-$5.25; March $5.10-$5.90.
- December KC $5.00-$5.35; March $5.00-$6.00. (remain tight with Chicago)
- December MN $5.60-$6.25 range; March $5.75-$7.00
Terry Reilly
Senior Commodity Analyst – Grain and Oilseeds
Futures International │190 S LaSalle St., Suite 410│Chicago, IL 60603
W: 312.604.1366
AIM: fi_treilly
ICE IM: treilly1
Skype: fi.treilly

Trading of futures, options, swaps and other derivatives is risky and is not suitable for all persons. All of these investment products are leveraged, and you can lose more than your initial deposit. Each investment product is offered only to and from jurisdictions where solicitation and sale are lawful, and in accordance with applicable laws and regulations in such jurisdiction. The information provided here should not be relied upon as a substitute for independent research before making your investment decisions. Futures International, LLC is merely providing this information for your general information and the information does not take into account any particular individual’s investment objectives, financial situation, or needs. All investors should obtain advice based on their unique situation before making any investment decision. The contents of this communication and any attachments are for informational purposes only and under no circumstances should they be construed as an offer to buy or sell, or a solicitation to buy or sell any future, option, swap or other derivative. The sources for the information and any opinions in this communication are believed to be reliable, but Futures International, LLC does not warrant or guarantee the accuracy of such information or opinions. Futures International, LLC and its principals and employees may take positions different from any positions described in this communication. Past results are not necessarily indicative of future results.
This email, any information contained herein and any files transmitted with it (collectively, the Material) are the sole property of OTC Global Holdings LP and its affiliates (OTCGH); are confidential, may be legally privileged and are intended solely for the use of the individual or entity to whom they are addressed. Unauthorized disclosure, copying or distribution of the Material, is strictly prohibited and the recipient shall not redistribute the Material in any form to a third party. Please notify the sender immediately by email if you have received this email by mistake, delete this email from your system and destroy any hard copies. OTCGH waives no privilege or confidentiality due to any mistaken transmission of this email.