From: Terry Reilly
Sent: Friday, January 10, 2020 8:28:21 AM (UTC-06:00) Central Time (US & Canada)
Subject: FI Morning Grain Comments 01/10/20
PDF attached
Morning.
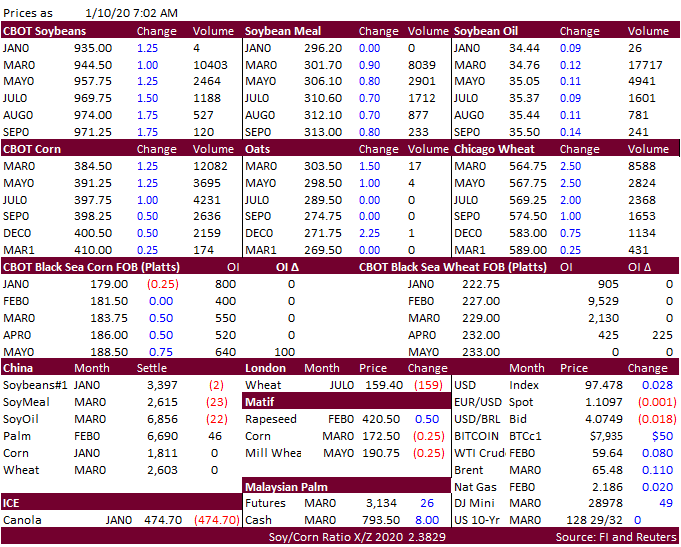
MPOB Malaysian palm S&D was bullish and China CASDE neutral. USDA export sales were flat out poor and one of the worst reports I have seen in a while. USDA weekly export commitments were a marketing year low for wheat, corn, rice, and soybean meal.
![]()

Reuters
Estimates
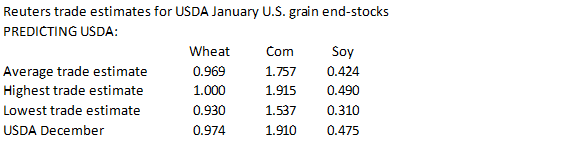
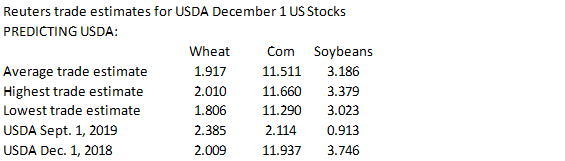
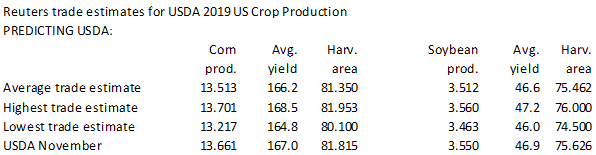
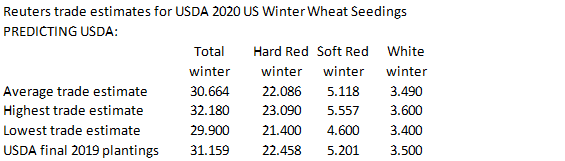
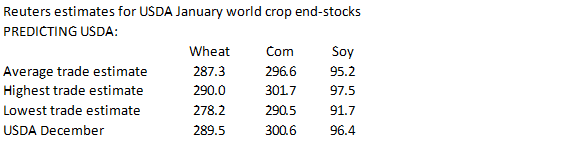
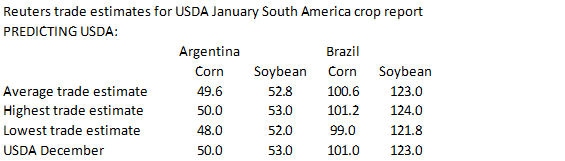
Source:
Reuters and FI