From: Terry Reilly
Sent: Thursday, March 19, 2020 8:08:35 AM (UTC-06:00) Central Time (US & Canada)
Subject: FI Morning Grain Comments 03/19/20

PDF attached


Morning.
Green
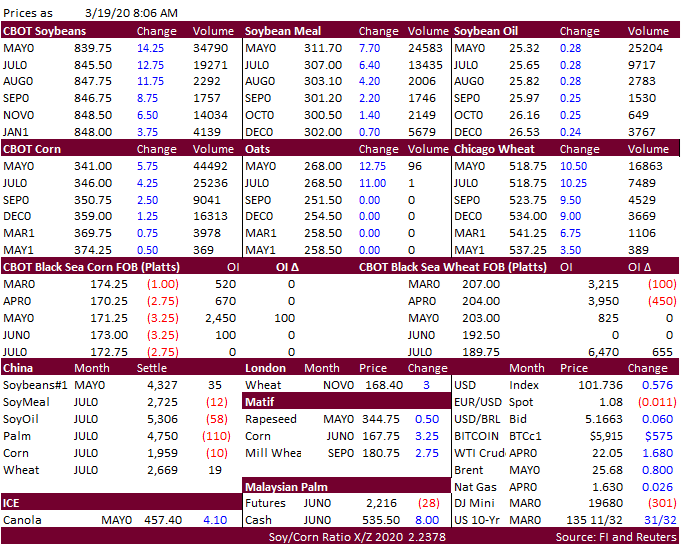
on the screen this morning driven by soybean meal and high protein wheat.  USD is screaming higher. Global import tender demand remains strong with SK picking up at least 3 cargoes of corn and South Korean millers buying 136,000 tons of US wheat.  Short covering
in corn seen after funds sold an estimated net 143,000 corn contracts over the past 6 business days.
Soybean
crush margins are on fire again.  On our analysis, China crush margins are up 10 cents to $1.45 from the previous day, which promotes import business. 


We remain
bearish corn based on US demand destruction, bullish meal and bullish high protein wheat. 


Weather


MARKET
WEATHER MENTALITY FOR CORN AND SOYBEANS: 

Today’s
weather will not provide much bullish support except from the United States where a wet bias will continue in the Delta and Tennessee River Basin as well as in parts of central and eastern crop areas of Texas into late this month. South Texas moisture will
be welcome and dry conditions in the far southeastern U.S. will support planting.

World
Weather, Inc.’s outlook for April and May were released today and offers some hope for better planting conditions in the second half of spring.

South
America weather is still advertised to be mostly good for Argentina and southern Brazil, although the distribution of rain over the next two weeks will have much to say about second season corn production in Brazil. Argentina has had enough rain in central
and southern areas recently that many crops will finish out the growing season without much potential for additional losses even though the next two weeks look dry and some warmer than usual weather will be returning.

South
Africa weather will be favorably mixed over the next two weeks supporting late season crop development. Limited rain in eastern Australia will be supportive of early season sorghum and other coarse grain and oilseed crop maturation and harvesting.

India
winter crops are still poised for excellence this year and drier weather will be needed in late March and especially April to protect crop quality.         

China’s
winter weather has spring planting prospects looking very good. Rain in Spain and Portugal will improve spring planting potentials and support improved winter crop conditions.

Rain
is still needed throughout Southeast Asia, but mostly in the mainland areas and in some of the northern palm oil and coconut production areas of Indonesia. Peninsular Malaysia also needs a boost in rain.

Overall,
weather today will maintain a mixed influence on market mentality, although a bullish move in the markets will likely continue for other reasons.


MARKET
WEATHER MENTALITY FOR WHEAT:
 

Weather
conditions around the world have not changed much and will not likely change much for a while. U.S. Plains crop areas have benefited from recent precipitation and will help improve early season crop development, although more rain is needed in the west central
parts of hard red winter wheat country. Some areas in the Midwest are too wet.

            Canada’s
Prairies are expected to experience a good start to spring planting this year, but May could trend wetter.

            Europe
winter crops are quite mixed with some areas in the northwest too wet. Improving soil moisture is expected in southeastern Europe which may improve crops after a poor environment for establishment last autumn. Lower area planted in parts of Europe will still
pull down production, but crops that did get planted may perform better than previously expected. That statement also pertains to Ukraine.

            Dryness
in Kazakhstan and eastern parts of Russia’s Southern Region will need to be closely monitored.

            China
has huge potential for crop improvements this spring. India’s winter crop will be very large as well. Rain is needed in southern Australia to improve planting potentials for late April through June.

            North
Africa’s rain and that in Spain will help improve some crops, but Morocco’s production losses because of drought will not be fully recoverable.

            Overall
weather today will likely contribute a mixed influence on market mentality, although recent reports of lower production because of dryness last autumn may give the market a little boost.

Source:
World Weather Inc. and FI


Source:
World Weather Inc. and FI


Source:
World Weather Inc. and FI


Bloomberg
Ag Calendar

THURSDAY,
MARCH 19:

  • USDA
    weekly crop net-export sales for corn, soybeans, wheat, cotton, 8:30am
  • Port
    of Rouen data on French grain exports
  • USDA
    total milk, red meat production, 3pm

FRIDAY,
MARCH 20:

  • ICE
    Futures Europe weekly commitments of traders report on coffee, cocoa, sugar positions ~1:30pm (~6:30pm London)
  • CFTC
    commitments of traders weekly report on positions for various U.S. futures and options, 3:30pm
  • FranceAgriMer
    weekly update on crop conditions
  • AmSpec,
    Intertek, SGS release palm oil export data for March 1-20
  • U.S.
    cattle on feed, 3pm

Source:
Bloomberg and FI


USDA
export sales

        
US sorghum sales were 366,000 tons with China taking 202,300 and unknown 128,000 tons.

        
Pork sales were 35,700 tons (China 15,700 tons).

        
Soybean sales were 631,600 tons, low end of trade expectations.

        
Soybean meal sales slipped to 129,100 tons but shipments were 291,400 tons.

        
Soybean oil sales were down from the previous week at 18,900 tons but shipments were good at 39,100 tons. 

        
Corn export sales fell to 904,500 tons, below 1.471 million tons last week.

        
All-wheat sales were 338,300 tons, below 452,300 tons last week. 


Macros

        
USD is sharply higher. 

        
US Initial Jobless Claims Mar 14: 281K (est 220K ; prev 211K)

US
Continuing Claims Mar 7: 1701K (est 1738K ; prevR 1699K; prev 1722K)

        
US Tsy Sec Mnuchin: Tsy, Fed Working Around Clock On COVID-19 Response

                       
-Wants $1000 Per Person, $500 Per Child In Direct Checks


Corn.

        
Corn prices rallied overnight on short covering after funds sold an estimated net 143,000 contracts over the past six business days. 

        
There were rumors China may have bought four cargoes of US corn.

        
South Korea was active again overnight picking up a couple cargos. 

        
US sorghum export sales were 366,000 tons with China taking 202,300 and unknown 128,000 tons.  Pork sales were 35,700 tons (China 15,700 tons).  Corn export sales fell to 904,500 tons, below 1.471 million tons last week.

        
Last we heard D4 RINs were at 42 cents and D6 at 17 cents.  This was as of Wednesday.  Some western US ethanol plants were pulling corn bids yesterday. 

  • Yesterday
    corn basis fell by 10 cents at Burns Harbor, IN and by 7 cents in Lincoln, NE.  Decatur, Il was down 10 cents at 5 over.  Annawan, IL fell 17 cents to 25 under. 
  • USDA
    Attaché estimated Mexico will produce 27.1 million tons of corn and import 18.25 million tons, up from 25.6MMT and 17.3MMT, respectively. 
  • Japan’s
    usage of corn in animal feed fell to 48.6% in January, compared with 48.8% a year earlier.
  • We
    were told IEG Vantage will be out today with updated acreage numbers for the US.  Below is a preview. Note the combined corn, soybeans and wheat area is projected lower than a 5-year 2014 through 2018 average.  That’s because US winter wheat area is projected
    to decline to lowest in more than a century, using USDA’s projection. 

        
Yesterday Allendale estimated the corn area at 94.6 million acres and soybean area at 83.7 million acres.  All wheat was pegged at 44.5 million acres. 

        
South Korea’s imports of pork declined about 22% to 26,300 tons in February from a year earlier.

        
China number of breeding sows increased 1.7% in February from January, its 5th consecutive monthly increase.  Hog inventories rose 2.8% from January. 

        
China looks to auction off 20,000 tons of pork from state reserves on March 20.  They released 210,000 tons of pork from reserves since December.  It’s not a large amount compared to daily consumption rates but is a positive indicator the
country continues to move agriculture goods. 

        
The USDA Broiler Report showed eggs set in the US up 3 percent and chicks placed up 3 percent.  Cumulative placements from the week ending January 4, 2020 through March 14, 2020 for the United States were 2.10 billion. Cumulative placements
were up 4 percent from the same period a year earlier.

        
Weekly US ethanol production declined 9,000 barrels per day to 1.035 million barrels.  Traders were looking for a 2,000-barrel decline.  Weekly ethanol stocks were up 264,000 barrels to 24.598 million barrels.  Traders were looking for
an 18,000-barrel increase.  We project US weekly ethanol production could drop to around 950,000 barrels by early or mid-April.  That would put weekly corn for ethanol use below 100 million bushels per week, compared to about 109 million this week, assuming
a 2.8 yield.  Corn crop year to date ethanol production is running 0.4 percent above the same period a year ago.  We may lower our corn for ethanol use by as much as 75 million bushels by the end of this week. 


Export
Developments

  • South
    Korea’s FLC bought 134,000 tons of corn at $192.41/ton and $191.20 c&f for August arrival. 
  • South
    Korea’s KFA bought 60,000 tons of corn at $190.99/ton c&f for around September 5 arrival.  Offers for a second cargo for late September arrival were rejected. 
  • Yesterday
    South Korea’s KOCOPIA bought 60,000 tons of corn at $206.98/ton c&f for June 10 arrival. 
  • Yesterday
    South Korea’s MFG bought 69,000 tons of corn at $1929.99/ton c&f for August 21 arrival. 
  • Results
    awaited:

    Algeria seeks 40,000 tons of corn from Argentina on March 19 for FL April shipment.


Soybean
complex
.

  • CBOT
    soybeans

    are higher led by strength in soybean meal amid slowdown in Argentina meal shipments and good US domestic demand.  Soybean oil is higher led by higher WTI. 

        
Soybean US export sales were 631,600 tons, low end of trade expectations.  Soybean meal sales slipped to 129,100 tons but shipments were 291,400 tons.  Soybean oil sales were down from the previous week at 18,900 tons but shipments were
good at 39,100 tons. 

https://apps.fas.usda.gov/newgainapi/api/Report/DownloadReportByFileName?fileName=Oilseeds%20and%20Products%20Annual_Beijing_China%20-%20Peoples%20Republic%20of_03-15-2020

“China’s
soybean imports are forecast to reach 86 MMT in MY20/21, based on a recovery in crush volume for animal feed as the swine herd rebuilding continues. The MY20/21 forecast is up from an estimated 84 MMT in MY19/20 and 82.5 MMT in MY18/19.”

  • Late
    yesterday the day president of operators group Sopesp told Reuters they plant to keep the Santos port operating at normal levels. 
  • Rosario
    Exchange: March-Feb corn exports projected at 33.5MMT, down from 37.0 in 2019-20.
  • Offshore
    values are leading CBOT soybean oil 20 points lower and meal $6.50 lower.

        
Rotterdam vegetable oils this morning were mixed. Rotterdam meal when imported from SA were mixed. 

        
China:

        
China cash crush margins as of this morning, using our calculation, were 145 cents per bushel (135 previous), and compares to 128 cents a week ago and negative 28 cents around this time last year. 

        
Malaysian palm markets:
 5-month
low.


Oilseeds
Export Developments


Wheat

        
US wheat
is
mostly higher on strong domestic demand across the globe.

        
US all-wheat export sales were 338,300 tons, below 452,300 tons last week. 

        
Up in Canada, flour for bread baking is flying off the shelf. For one miller, they told us individuals are visiting milling plants asking for bags of milling wheat, which they can’t provide. 

        
Egypt said they have enough wheat to last 3.5 months.  Earlier this week they announced a temporarily suspension on wheat inspections until March 31. 

        
USDA Attaché pegged Egypt wheat imports for 2020-21 at 12.85 million tons, up from 12.80 million projected for 2019-20. 

        
Rain is need for the Black Sea region. 

        
Ukraine’s grain crop fell 10.3 percent to 67.4 million tons, in large part to a decrease in wheat production to 24.2 million tons, a 12.5% decrease from 2019, according to Ukraine’s national research institute IAE. 

        
May Paris wheat futures were up 3.50 euros as of early this morning to 187.75 euros.


Export
Developments.

  • Syria seeks 200,000 tons of wheat from Russia by March 23.  No
    purchase was made that closed on February 17. 
  • Ethiopia seeks 400,000 tons of wheat on April 7.  IN a separate
    tender, they seek 200,000 tons of wheat on April 1.  Both are optional origin. 


Rice/Other

  • Egypt said they have enough sugar reserves to last until year end. 
  • South Korea seeks 73,664 tons of rice on March 25 for arrival around end of Sep. to Oct 31. 


Export Sales Highlights  

This summary is based on reports from exporters for the period March 6-12, 2020.

  • Wheat:  Net sales of 338,300 metric tons for 2019/2020 were down 25 percent from the previous week and
    21 percent from the prior 4-week average.  Increases primarily for Mexico (83,300 MT, including decreases of 13,100 MT), Japan (62,000 MT, including decreases of 500 MT), the Philippines (54,000 MT, including decreases of 5,700 MT), Nigeria (52,000 MT, switched
    from unknown destinations), and Indonesia (37,500 MT), were offset by reductions primarily for unknown destinations (31,400 MT).  For 2020/2021, net sales of 143,800 MT were primarily for Malaysia (32,000 MT), Italy (20,000 MT), Peru (18,800 MT), Mexico (18,200
    MT), and the Philippines (15,000 MT).  Exports of 371,800 MT were down 17 percent from the previous week and 29 percent from the prior 4-week average.  The destinations were primarily to Japan (58,300 MT), Nigeria (52,000 MT), the Philippines (43,000 MT),
    Mexico (41,800 MT), and Peru (33,400 MT). 
  • Corn:  Net sales of 904,500 MT for 2019/2020 were down 39 percent from the previous week and 17 percent from
    the prior 4-week average.  Increases primarily for Japan (386,200 MT, including 161,900 MT switched from unknown destinations and decreases of 3,200 MT), South Korea (269,500 MT, including 68,000 MT switched from unknown destinations and decreases of 2,200
    MT), Mexico (241,300 MT, including decreases of 16,300 MT), Colombia (169,000 MT, including 82,000 MT switched from unknown destinations and decreases of 2,900 MT), and El Salvador (40,700 MT, including 7,500 MT switched from Guatemala), were offset by reductions
    primarily for unknown destinations (265,300 MT).  For 2020/2021, net sales of 56,100 MT resulting in increases for Mexico (79,300 MT), were offset by reductions for Guatemala (23,200 MT).  Exports of 970,200 MT–a marketing-year high–were up 14 percent from
    the previous week and 16 percent from the prior 4-week average.  The destinations were primarily to Mexico (290,600 MT), Japan (283,800 MT), Colombia (92,000 MT), South Korea (67,200 MT), and Guatemala (44,900 MT).  
    Optional Origin Sales:  For 2019/2020, the current outstanding balance of 711,000 MT is for South Korea (651,000 MT) and Israel (60,000 MT). 
  • Barley: No net sales for 2019/2020 were reported for the week.  Exports of 200 MT–a marketing-year low–were unchanged from the previous week, but
    down 40 percent from the prior 4-week average.  The destination was Taiwan.
  • Sorghum:  Net sales of 366,000 MT for 2019/2020 were up 41 percent from the previous week and 77 percent
    from the prior 4-week average.  Increases were for China (202,300 MT, including 66,000 MT switched from unknown destinations), unknown destinations (128,000 MT), Mexico (22,500 MT, including decreases of 11,400 MT), and Japan (13,200 MT, including decreases
    of 3,000 MT).  Exports of 74,900 MT were up noticeably from the previous week and up 55 percent from the prior 4-week average.  The destinations were China (71,300 MT), Japan (3,200 MT), and Mexico (400 MT). 
  • Rice:  Net sales of 48,100 MT for 2019/2020 were up 13 percent from the previous week, but down 16 percent from the prior 4-week average.  Increases
    primarily for Japan (19,300 MT), Haiti (15,300 MT), Costa Rica (8,000 MT), Canada (7,400 MT), and Saudi Arabia (2,100 MT), were offset by reductions for Mexico (6,000 MT). 
    Exports of 20,700 MT were down 67 percent from the previous week and 68 percent from the prior 4-week average.  The destinations were primarily to Mexico (7,200 MT), Canada (4,000 MT), South Korea (3,400 MT), Saudi
    Arabia (3,200 MT), and Japan (1,200 MT).
  • Soybeans:  Net sales of 631,600 MT for 2019/2020 were up noticeably from the previous week and up 71 percent from the prior 4-week average.  Increases
    primarily for unknown destinations (211,500 MT), Egypt (108,800 MT, including 102,000 MT switched from unknown destinations), Mexico (67,600 MT, including decreases of 1,300 MT), the Netherlands (64,800 MT, including 65,000 MT switched from unknown destinations
    and decreases of 200 MT), and Japan (64,300 MT, including 37,400 MT switched from unknown destinations and decreases of 5,300 MT), were offset by reductions for Niger (400 MT) and Peru (300 MT).  For 2020/2021, net sales of 69,600 MT were for unknown destinations
    (68,000 MT), Canada (1,100 MT), and Japan (500 MT).  Exports of 483,400 MT were down 15 percent from the previous week and 31 percent from the prior 4-week average.  The destinations were primarily to Egypt (171,700 MT), Mexico (87,100 MT), the Netherlands
    (64,800 MT), Japan (41,800 MT), and Thailand (21,000 MT).  Exports for Own Account:  For 2019/2020, the current exports for own account outstanding balance is 2,100 MT, all Canada.
  • Soybean Cake and Meal:  Net sales of 129,100 MT for 2019/2020 were down 25 percent from the previous week and 37 percent from the prior 4-week average. 
    Increases primarily for Canada (34,200 MT, including decreases of 3,500 MT), Mexico (34,100 MT), Ecuador (22,000 MT), Colombia (18,000 MT, including decreases of 200 MT), and Venezuela (13,900 MT, including 14,000 MT switched from unknown destination and decreases
    of 300 MT), were offset by reductions for unknown destinations (17,000 MT), the Dominican Republic (7,700 MT), French West Indies (3,000 MT), Chile (1,500 MT), and Burma (1,400 MT).  Exports of 291,400 MT were down 15 percent from the previous week and 2 percent
    from the prior 4-week average.  The destinations were primarily to the Philippines (52,900 MT), the Dominican Republic (37,300 MT), Canada (24,200 MT), Venezuela (23,900 MT), and Colombia (21,600 MT).
  • Soybean Oil: 
    Net sales of 18,900 MT for 2019/2020 primarily for Guatemala (8,500 MT), Canada (4,800 MT), the Dominican Republic (4,000 MT), El Salvador (1,000 MT), and Mexico (600 MT, including decreases of 300 MT), were offset
    by reductions for Colombia (200 MT).  For 2020/2021, total net sales of 2,000 MT were for Canada.  Exports of 39,100 MT were up noticeably from the previous week, but down 1 percent from the prior 4-week average.  The destinations were primarily to South Korea
    (15,000 MT), the Dominican Republic (13,400 MT), Venezuela (5,500 MT), Colombia (3,000 MT), and Mexico (1,800 MT). 
  • Cotton:  Net sales of 340,700 RB for 2019/2020 were down 30 percent from the previous week, but up 3 percent
    from the prior 4-week average.  Increases primarily for Pakistan (96,000 RB), China (61,700 RB, including 1,300 RB switched from Vietnam and decreases of 4,400 RB), Turkey (60,800 RB), Vietnam (41,300 RB, including 400 RB switched from Japan and decreases
    of 5,400 RB), and Bangladesh (23,600 RB), were offset by reductions for Japan (4,500 RB) and Honduras (100 RB).  For 2020/2021, net sales of 78,500 RB were primarily for Turkey (32,600 RB), Pakistan (22,000 RB), China (18,500 RB), Mexico (5,000 RB), and Thailand
    (2,600 RB), were offset by reductions for Taiwan (4,400 RB).  Exports of 369,500 RB were down 13 percent from the previous week and 8 percent from the prior 4-week average.  Exports were primarily to Pakistan (103,600 RB), Vietnam (88,700 RB), Turkey (40,900
    RB), China (25,900 RB), and Indonesia (21,500 RB).  Net sales of Pima totaling 17,200 RB were down 1 percent from the previous week, but up 7 percent from the prior 4-week average.  Increases were primarily for China (14,100 RB), Peru (3,100 RB), Bangladesh
    (800 RB, switched from Pakistan), Austria (700 RB, switched from Switzerland), and Honduras (300 RB), were offset by reductions for Egypt (900 RB), Pakistan (800 RB), and Switzerland (700 RB).  Exports of 15,700 RB were up 6 percent from the previous week
    and 7 percent from the prior 4-week average.  The primary destinations were primarily to India (3,100 RB), Pakistan (2,300 RB), Egypt (2,200 RB), Turkey (1,600 RB), and Austria (1,300 RB).  
    Exports for Own Account:  For 2019/2020, new exports for own account totaling 2,000 RB were for Bangladesh (1,100 RB) and Pakistan (900 RB).  Exports for own account totaling 1,600 RB to Indonesia were applied to new or outstanding sales.  Decreases
    were reported for Pakistan (300 RB).  The current exports for own account outstanding balance of 39,400 RB is for Indonesia (27,100 RB), Bangladesh (6,500 RB), China (2,500 RB), India (1,700 RB), Pakistan (500 RB), South Korea (400 RB), Malaysia (400 RB),
    and Vietnam (300 RB).

        
Hides and Skins:
Net sales of 458,800 pieces for 2020 were up 29 percent from the previous
week and 40 percent from the prior 4-week average.  Increases primarily for China (231,700 whole cattle hides, including decreases of 9,700 pieces), Indonesia (64,700 whole cattle hides, including decreases of 700 pieces), South Korea (55,300 whole cattle
hides, including decreases of 4,900 pieces), Brazil (35,400 whole cattle hides, including decreases of 100 pieces), and Mexico (35,100 whole cattle hides, including decreases of 2,800 pieces).  In addition, there were net sales for Italy (2,100 calf sins)
and Canada (1,400 kip skins).  Exports of 323,200 pieces reported for 2020 were down 14 percent from the previous week and 10 percent from the prior 4-week average.  Whole cattle hide exports were primarily to China (183,600 pieces), South Korea (45,200 pieces),
Thailand (43,800 pieces), Mexico (30,600 pieces), and Indonesia (10,000 pieces). 

        
Net sales of 94,600 wet blues
for 2020 were down 5 percent from the previous week and
15 percent from the prior 4-week average.  Increases primarily for Italy (36,200 unsplit, including decreases of 100 grain splits), China (24,800 unsplit), India (8,300 grain splits and 2,000 unsplit), the Dominican Republic (9,600 unsplit), and Vietnam (9,200
unsplit), were offset by reductions for Brazil (200 grain splits), Mexico (100 grain splits), and Taiwan (100 unsplit).  Exports of 165,000 wet blues for 2020 were up 27 percent from the previous week and 13 percent from the prior 4-week average.  The destinations
were primarily to Italy (46,200 unsplit and 5,100 grain splits), Vietnam (45,900 unsplit), China (27,100 unsplit), Thailand (24,800 unsplit), and Taiwan (6,700 unsplit).  Total net sales of 778,700 splits were for Vietnam.  Exports of 404,300 pounds were to
Vietnam.

        
Beef:

Net sales of 21,200 MT reported for 2020 were up 20 percent from the previous week and 33 percent from the prior 4-week average.  Increases were primarily for South Korea
(7,300 MT, including decreases of 400 MT), Japan (4,000 MT, including decreases of 700 MT), Canada (2,700 MT, including decreases of 100 MT), Taiwan (2,300 MT, including decreases of 100 MT), and Mexico (1,700 MT).  Exports of 16,600 MT were up  2 percent
from the previous week, but down 3 percent from the prior 4-week average.  The destinations were primarily to Japan (5,600 MT), South Korea (4,400 MT), Mexico (1,500 MT), Taiwan (1,300 MT), and Canada (1,300 MT).

  • Pork:
    Net sales of 35,700 MT reported for 2020 were down noticeably from the previous week, but up noticeably and from the prior 4-week average.  Increases were primarily for China (15,700 MT), Mexico (8,600
    MT), Japan (3,900 MT), South Korea (2,300 MT), and Chile (1,200 MT).  Exports of 43,000 MT were down 4 percent from the previous week, but unchanged from the prior 4-week average.  The destinations were primarily to China (15,600 MT), Mexico (10,400 MT), Japan
    (5,500 MT), South Korea (4,200 MT), and Canada (3,100 MT).


U.S. EXPORT SALES FOR WEEK ENDING 3/12/2020


CURRENT MARKETING YEAR

NEXT MARKETING YEAR

COMMODITY

NET SALES

OUTSTANDING SALES

WEEKLY EXPORTS

ACCUMULATED EXPORTS

NET SALES

OUTSTANDING SALES

CURRENT YEAR

YEAR
AGO

CURRENT YEAR

YEAR
AGO


THOUSAND METRIC TONS

WHEAT


   HRW    

106.9

1,746.6

2,415.0

139.7

7,133.3

5,675.4

43.2

143.3

   SRW    

36.8

306.2

875.3

67.3

2,031.4

2,186.3

35.8

117.5

   HRS     

128.4

1,614.3

1,334.3

121.0

5,490.4

5,103.3

29.8

171.7

   WHITE   

65.9

1,070.4

1,023.9

41.4

3,748.7

4,048.7

15.1

36.0

   DURUM  

0.4

146.4

120.7

2.4

682.2

360.4

20.0

131.0

     TOTAL

338.3

4,883.9

5,769.1

371.8

19,086.0

17,374.1

143.8

599.4

BARLEY

0.0

14.7

26.6

0.2

34.4

32.7

0.0

31.0

CORN

904.5

12,815.7

13,934.2

970.2

16,202.1

27,819.3

56.1

1,657.8

SORGHUM

366.0

1,206.9

228.5

74.9

1,158.0

718.7

0.0

33.0

SOYBEANS

631.6

4,315.7

13,188.9

483.4

30,684.0

28,234.1

69.6

414.4

SOY MEAL

129.1

3,089.7

3,530.7

291.4

5,370.3

5,515.2

0.0

100.8

SOY OIL

18.9

236.9

133.7

39.1

539.2

402.6

2.0

2.5

RICE


   L G RGH

8.5

385.2

349.3

0.0

879.6

699.8

0.0

0.0

   M S RGH

-6.6

37.7

42.5

6.6

24.1

25.0

0.0

0.0

   L G BRN

2.3

14.5

6.5

1.0

35.9

28.8

0.0

0.0

   M&S BR

0.1

66.0

80.9

3.7

41.8

60.2

0.0

0.0

   L G MLD

20.7

76.6

92.1

4.7

651.9

577.4

0.0

0.0

   M S MLD

23.1

212.5

187.7

4.7

390.0

337.8

0.0

0.0

     TOTAL

48.1

792.5

759.0

20.7

2,023.4

1,729.0

0.0

0.0

COTTON


THOUSAND RUNNING BALES      

   UPLAND

340.7

7,028.1

6,000.4

369.5

7,839.7

6,346.2

78.5

1,775.0

   PIMA

17.2

234.2

227.0

15.7

287.4

356.8

0.0

35.3


Terry Reilly

Senior Commodity Analyst C Grain and Oilseeds

Futures International │190 S LaSalle St., Suite 410│Chicago, IL  60603

W: 312.604.1366

treilly@futures-int.com

AIM: fi_treilly

ICE IM: 
treilly1

Skype: fi.treilly


Description: Description: Description: Description: FImail


Trading of futures, options, swaps and other derivatives is risky and is not suitable for all persons.  All of these investment products are leveraged, and you can lose more than your initial deposit.  Each investment product is offered
only to and from jurisdictions where solicitation and sale are lawful, and in accordance with applicable laws and regulations in such jurisdiction.  The information provided here should not be relied upon as a substitute for independent research before making
your investment decisions.  Futures International, LLC is merely providing this information for your general information and the information does not take into account any particular individual’s investment objectives, financial situation, or needs.  All investors
should obtain advice based on their unique situation before making any investment decision.  The contents of this communication and any attachments are for informational purposes only and under no circumstances should they be construed as an offer to buy or
sell, or a solicitation to buy or sell any future, option, swap or other derivative.  The sources for the information and any opinions in this communication are believed to be reliable, but Futures International, LLC does not warrant or guarantee the accuracy
of such information or opinions.  Futures International, LLC and its principals and employees may take positions different from any positions described in this communication.  Past results are not necessarily indicative of future results.


This email, any information contained herein and any files transmitted with it (collectively, the Material) are the sole property of OTC Global Holdings LP and its affiliates (OTCGH); are confidential, may be legally privileged and are intended solely for
the use of the individual or entity to whom they are addressed. Unauthorized disclosure, copying or distribution of the Material, is strictly prohibited and the recipient shall not redistribute the Material in any form to a third party. Please notify the sender
immediately by email if you have received this email by mistake, delete this email from your system and destroy any hard copies. OTCGH waives no privilege or confidentiality due to any mistaken transmission of this email.