From: Terry Reilly
Sent: Thursday, June 28, 2018 8:22:07 AM (UTC-06:00) Central Time (US & Canada)
Subject: FI Morning Grain Comments 06/28/18
PDF attached

- 6-10 is unchanged for the US for precipitation but temperatures are warmer in the northern Midwest and northeastern Great Plains. 11-15 day is wetter in the Delta and southeastern Great Plains and drier for the northern Great Plains.
- The US trends warmer this week.
- The forecast calls for limited precipitation during the second week of July, but the northern and eastern Midwest may pick up on rain.
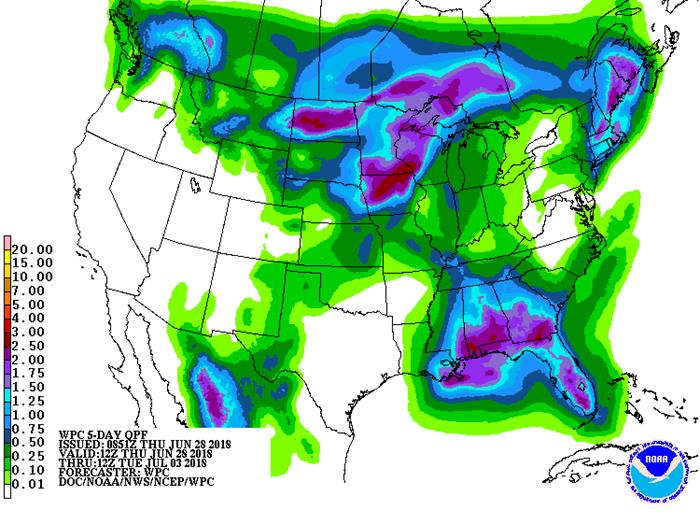
- U.S. northern Plains will receive daily rainfall through the next ten days.
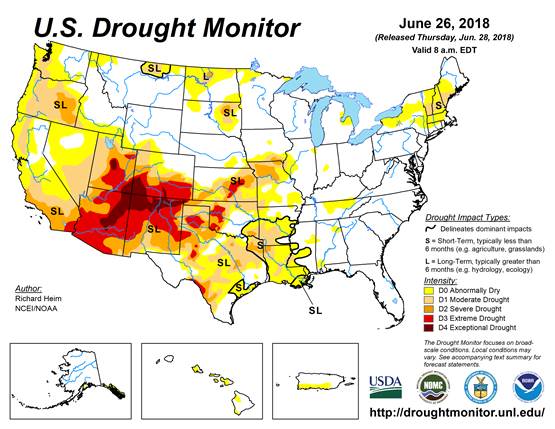
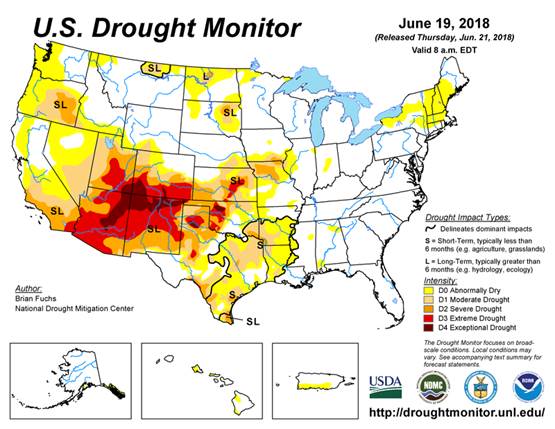
- The Texas Blacklands, West Texas and parts of the Delta where dryness will continue to see crop stress due to net drying through early July.
- Eastern Australia will receive needed rain today and Wednesday.
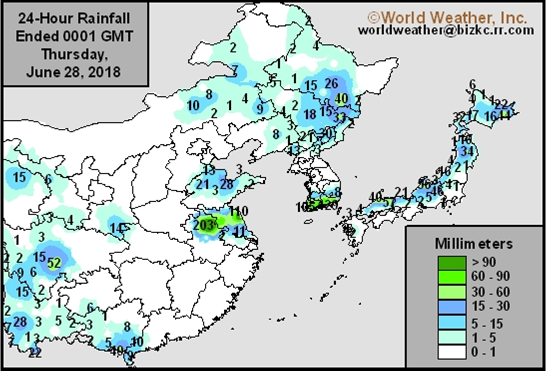
- Shandong, China, saw beneficial rain Monday into Tuesday. Southern Shanxi, extreme northern Henan and central Shaanxi saw rain as well.
- Northeast China rainfall will be frequent through July 4.
- Western Europe will continue to see a high-pressure ridge in place through Friday, limiting rainfall and keeps temperatures warm.
- Eastern Ukraine through Kazakhstan will see drought conditions for a while. Eastern portions of Russia’s Southern Region into Kazakhstan will see some relief from warm temperatures this weekend.
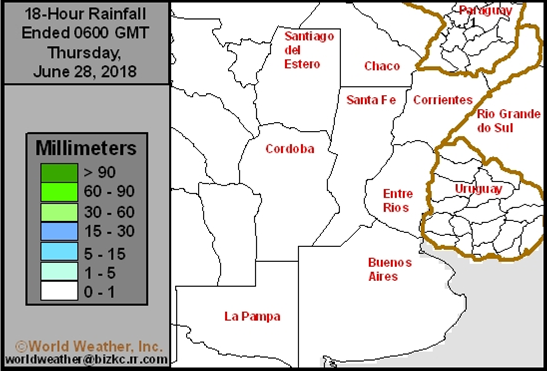
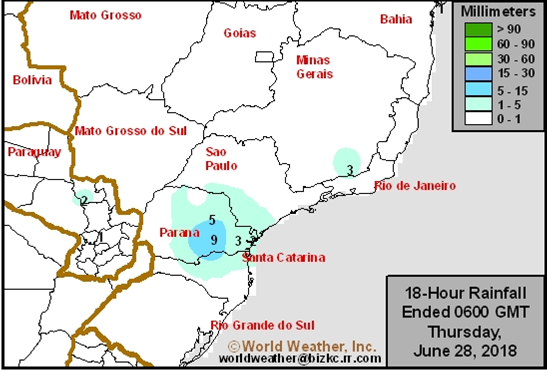
- Brazil and Argentina will see net drying through at least July 8.
Source: World Weather Inc. and FI


SIGNIFICANT CORN AND SOYBEAN BELT PRECIPITATION EVENTS
WEST CORN BELT EAST CORN BELT
Thu 15% cvg of up to 0.75” 15% cvg of up to 0.50”
and local amts to 1.75”; and local amts to 1.0”;
far NW wettest wettest SW
Fri 10% cvg of up to 0.25”
and locally more;
wettest SW
Fri-Sat 75% cvg of up to 0.75”
and local amts to 1.50”
with some 1.50-3.0”
amts from Ia. to west
Wi.; far SE and far NW
driest
Sat-Sun 80% cvg of up to 0.60”
and local amts to 1.30”
Sun-Mon 50% cvg of up to 0.65”
and local amts to 1.35”;
wettest NW
Mon-Tue 40% cvg of up to 0.35”
and local amts to 0.65”
Tue-Jul 4 5-20% daily cvg of up
to 0.40” and locally
more each day;
wettest north
Jul 4 20% cvg of up to 0.30”
and locally more
Jul 5-6 45% cvg of up to 0.40” 45% cvg of up to 0.30”
and local amts to 1.0”; and local amts to 0.65”
wettest north
Jul 7-11 5-20% daily cvg of up 5-20% daily cvg of up
to 0.25” and locally to 0.25” and locally
more each day more each day
U.S. DELTA/SOUTHEAST SIGNIFICANT PRECIPITATION EVENTS
DELTA SOUTHEAST
Tdy-Fri 5-20% daily cvg of up
to 0.25” and locally
more each day
Tdy-Mon 20-40% daily cvg of
up to 0.60” and locally
more each day
Sat-Jul 4 20-40% daily cvg of
up to 0.60” and locally
more each day;
wettest south
Tue-Jul 5 25-50% daily cvg of
up to 0.75” and locally
more each day
Jul 5-6 5-20% daily cvg of up
to 0.30” and locally
more each day
Jul 6-11 20-40% daily cvg of
up to 0.60” and locally
more each day
Jul 7-11 10-25% daily cvg of
up to 0.30” and locally
more each day
Source: World Weather Inc. and FI
Source: World Weather Inc. and FI
Source: World Weather Inc. and FI
Source: World Weather Inc. and FI
- USDA weekly crop net-export sales for corn, wheat, soy, cotton, 8:30am
- USDA hogs & pigs inventory data for 2Q, 3pm
- U.S. agriculture prices received for May, 3pm
- Buenos Aires Grain Exchange weekly crop report
- EU weekly grain, oilseed import and export data
- Port of Rouen data on French grain exports
- Bloomberg weekly survey of analysts’ expectations on grain, sugar prices
FRIDAY, JUNE 29:
- Statistics Canada to release June seeded area for wheat, soy, barley, canola, durum 8:30am
- USDA annual plantings data for corn, soy, wheat, cotton, noon
- USDA grain stockpiles data for 2Q, noon
- Traders’ estimates for July raw sugar delivery on ICE Futures
- ICE Futures Europe commitments of traders weekly report on coffee, cocoa, sugar positions, ~1:30pm ET (~6:30pm London)
- CFTC commitments of traders weekly report on positions for various U.S. futures and options, 3:30pm
- Honduran Coffee Institute releases monthly exports, 4pm
- FranceAgriMer weekly updates on French crop conditions
SATURDAY, JUNE 30:
- AmSpec data on Malaysia’s June 1-30 palm oil exports, 11pm ET Friday (11am Kuala Lumpur Saturday)
Source: Bloomberg and FI
· USD is lower, WTI crude lower, and gold lower, at the time this was written.
· President Donald Trump and Russian President Vladimir Putin will meet in Helsinki, Finland, July 16, the White House and Kremlin have announced.
· US Initial Jobless Claims: 227k (est 220k prev 218k)
– US Continuing Claims: 1.705mln (est 1.717mln prev R 1.726mln)
– US Personal Consumption Q1 T: 0.9% (est 1.0% prev 1.0%)
– US Core PCE Q1 T Q/Q: 2.3% (prev 2.3%)
· US GDP Annualized Q1 T Q/Q: 2.0% (est 2.2% prev 2.2%)
– US GDP Price Index Q1 T Q/Q: 2.2% (est 1.9% prev 1.9%)
Corn.
- CBOT corn is lower on positioning ahead of the USDA report due out Friday.
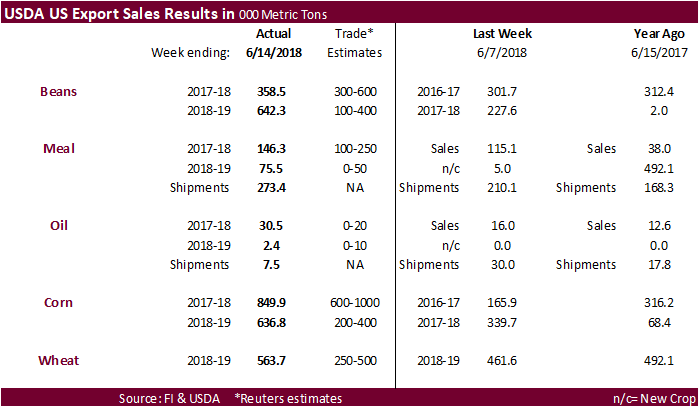
- USDA US corn export sales were good on a combined old and new-crop basis.
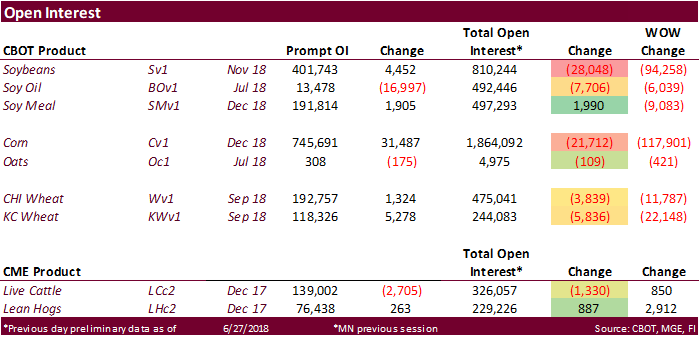
- Total corn OI was down 21,712 contracts.
- Baltic Dry Index was up 20 points to 1,329, or 1.5%.
- US weekly ethanol production increased 8,000 barrels per day to 1.072 million. A Bloomberg survey was looking for a decline to 1.059 million.
- US ethanol stocks increased 27,000 barrels to 21.674 million, near the Bloomberg trade average.
- The USDA Broiler Report showed eggs set in the US up 3 percent from a year ago and chicks placed up 3 percent. Cumulative placements from the week ending January 6, 2018 through June 23, 2018 for the United States were 4.58 billion. Cumulative placements were up 1 percent from the same period a year earlier.
- South Africa reported the 2018 corn crop up 297,000 tons or 2 percent to 13.207 million tons from its May estimate of 12.91 million tons. Traders were looking for 12.99 million tons.
· China sold 1.060 million tons of corn out of reserves, 26.5% of what was offered at an average price of 1514 yuan per ton ($228.89/ton). China sold an estimated 48 million tons of corn out of reserves since April 12.
USDA Export Sales Text
- Corn: Net sales of 849,900 MT for 2017/2018 were up noticeably from the previous week and up 16 percent from the prior 4-week average. Increases were reported for South Korea (206,700 MT, including 130,000 MT switched from unknown destinations and decreases of 1,000 MT), Mexico (195,200 MT, including decreases of 3,400 MT), Japan (163,600 MT, including 58,300 MT switched from unknown destinations and decreases of 14,900 MT), Colombia (79,600 MT), and Peru (78,200 MT, including decreases of 3,500 MT). Reductions were primarily for unknown destinations (188,100 MT). For 2018/2019, net sales of 636,800 MT were reported for South Korea (132,000 MT), Japan (125,000 MT), Panama (117,000 MT), and Mexico (108,800 MT). Exports of 1,479,900 MT were down 16 percent from the previous week and 9 percent from the prior 4-week average. The destinations were primarily to South Korea (275,500 MT), Mexico (275,100 MT), Japan (237,800 MT), Taiwan (91,500 MT), and Tunisia (84,500 MT). Optional Origin Sales: For 2017/2018, the current optional origin outstanding balance of 417,000 MT is for South Korea (206,000 MT), unknown destinations (91,000 MT), Saudi Arabia (70,000 MT), and Egypt (50,000 MT). For 2018/2019, the current outstanding balance of 138,000 MT is for Saudi Arabia (70,000 MT) and South Korea (68,000 MT).
- Barley: No net sales were reported for the week. Exports of 600 MT were to Japan (500 MT) and Taiwan (100 MT).
- Sorghum: There were no net sales or exports reported during the week.
Soybean complex.
· US soybean complex is mixed and crush margins were higher before the day session.
- Total soybeans OI was down 28,048 contracts.
- Brazilian real took another hit on Wednesday and is down again this morning.
- USDA soybean export sales were within expectations for this crop-year and above for new-crop. Iran bought 60k tons (switched from China). There were a few other countries that posted increases that were switched from unknown or China.
- Soybean oil export sales were above expectations for the current marketing year.
- Soybean meal export sales were within expectations.
· China September soybean futures increased 12 yuan per ton or 0.3%, September meal was up 20 or 0.6%, China soybean oil up 0.3% and China September palm up 34 at 4802 yuan/ton or 0.7%.
· September China cash crush margins were last running at 75 cents, up 13 cents from the previous day, and compares to 52 cents last week and 27 a year ago.
· Rotterdam vegetable oils were mixed and SA soybean meal when delivered into Rotterdam were lower as of early morning CT time.
· Malaysian palm oil rebounded. September Malaysian palm was 28 higher at MYR2343 and cash up $6.25 at $602.50.
· Dorab Mistry estimated palm prices will decline over the next two months to 2100/ton ($560/ton) due to larger supplies. He added palm oil could also benefit from the U.S.-China trade war.
· Felda Global Ventures annual report showed the forecast average price of crude palm oil at 2,400 ringgit to 2,600 ringgit per ton in 2018.
· Offshore values were leading the soybean oil flat and soybean meal also flat.
· Egypt seeks 30,000 tons of soybean oil and 10,000 tons of sunflower on June 28 for arrival around Aug 15-31. GASC will also accept offers for at least 10,000 tons of soyoil and 5,000 tons of sunflower oil in Egyptian pounds. (Reuters)
o The lowest offer at a tender for vegetable oils being held by Egypt’s state-buyer GASC on Thursday was for $711.93 a ton for 30,000 tons of soybean oil and $777 a ton for 10,000 tons of sunflower oil.
- Iran seeks 30,000 tons of sunflower oil on July 10.
- Iran seeks 30,000 tons of palm olein oils on July 10.
- Iran seeks 30,000 tons of soybean oil on August 1.
· China sold 376,965 tons of soybeans out of reserves so far, this season.
USDA Export Sales Text
- Soybeans: Net sales of 358,500 MT for 2017/2018 were up 19 percent from the previous week and 14 percent from the prior 4-week average. Increases were reported for Vietnam (79,700 MT, including 65,000 MT switched from unknown destinations), the Netherlands (76,700 MT, including 66,000 MT switched from unknown destinations), Bangladesh (64,000 MT, including 63,000 MT switched from China), Iran (60,000 MT, switched from China), and Peru (34,500 MT, including 35,000 MT switched from unknown destinations and decreases of 500 MT). Reductions were for China (120,000 MT). For 2018/2019, net sales of 642,300 MT were primarily for Pakistan (207,000 MT), Thailand (148,000 MT), and Mexico (135,000 MT). Exports of 500,500 MT were down 50 percent from the previous week and 27 percent from the prior 4-week average. The destinations included the Netherlands (76,700 MT), Vietnam (75,500 MT), China (71,700 MT), Pakistan (69,300 MT), and Mexico (39,900 MT). Optional Origin Sales: For 2018/2019, the current optional origin outstanding balance of 228,000 MT is for China (165,000 MT) and unknown destinations (63,000 MT). Export for Own Account: The current outstanding balance of 71,400 MT is for Canada.
- Soybean Cake and Meal: Net sales of 146,300 MT for 2017/2018 were up 27 percent from the previous week and from the prior 4-week average. Increases were reported for Mexico (37,200 MT, including decreases of 500 MT), the Philippines (29,600 MT, including decreases of 100 MT), Canada (26,600 MT), Colombia (14,000 MT), and Guatemala (12,000 MT, including 12,900 MT switched from unknown destinations, 2,000 MT switched from Panama, 2,000 MT switched from El Salvador, and decreases of 100 MT). Reductions were reported for unknown destinations (13,100 MT). For 2018/2019, net sales of 75,500 MT were primarily for Panama (48,500 MT), El Salvador (12,000 MT), and Canada (4,200 MT). Exports of 273,400 MT were up 30 percent from the previous week and 19 percent from the prior 4-week average. The primary destinations were the Philippines (71,300 MT), Mexico (32,000 MT), Morocco (31,800 MT), Venezuela (22,000 MT), and Guatemala (21,100 MT).
- Soybean Oil: Net sales of 30,500 MT for 2017/2018 were up 91 percent from the previous week and up noticeably from the prior 4-week average. Increases were primarily for Peru (13,900 MT), Mexico (7,600 MT), Jamaica (3,500 MT), Colombia (2,200 MT, including decreases of 2,000 MT), and the Dominican Republic (1,600 MT). For 2018/2019, net sales of 2,400 MT were reported for Mexico. Exports of 7,500 MT were down 75 percent from the previous week and 77 percent from the prior 4-week average. The primary destinations were Guatemala (5,000 MT) and Mexico (2,200 MT).
- All three US wheat markets are trying to trade higher in part to positioning and lower USD.
- All wheat export sales improved from last week to 563,700 tons. HRW amounted to 208.8k and White 117.6k. HRS were 179.1k while soft wheat was only 32.2k.
- The General Director of The Institute for Agricultural Market Studies (IKAR) said early harvesting of some wheat in Russia’s main growing areas are more optimistic than expected, and the crop could reach 70 million tons or higher.
- Yesterday SovEcon warned the Russian wheat crop could end up being the smallest in decades.
Export Developments.
· China sold 3,000 tons of imported wheat out of reserves, 0.2% of what was offered at an average price of 2210 yuan per ton ($333.58/ton).
· Jordan seeks 120,000 tons of barley on July 4 for Oct-Nov shipment.
· Jordan seeks 120,000 tons of wheat on July 8 for Oct-Nov shipment.
- Japan in a SBS import tender seeks 120,000 tons of feed wheat and 200,000 tons of barley on July 4 for arrival by December 28.
- Syria seeks 200,000 tons of wheat on July 2 for Aug 1-Sep 30 shipment. Origins include Russian, Romania and/or Bulgaria.
- Iraq seeks 50,000 tons of wheat from the US, Australia and/or Canada on July 2, valid until July 8.
- Bangladesh seeks 50,000 tons of wheat on July 3 for shipment within 40 days of contract signing.
Rice/Other
- Results awaited: South Korea seeks 102,800 tons of rice for September-February arrival on June 27.
TONNES(M/T) GRAIN TYPE ARRIVAL/PORT
20,000 Brown Short Sept. 15, 2018/Incheon
20,000 Brown Short Sept. 15, 2018/Ulsan
20,000 Brown Short Sept. 15, 2018/Masan
10,000 Brown long Sept. 30, 2018/Mokpo
10,000 Brown long Sept. 30, 2018/Donghae
2,800 Milled Medium Dec. 1-31, 2018/Busan
10,000 Milled Medium Feb. 28, 2019/Busan
10,000 Milled Medium Feb. 28, 2019/Busan
- Iran seeks 50,000 tons of rice from Thailand on July 3.
USDA Export Sales Text
- Wheat: Net sales of 563,700 metric tons were reported for delivery in marketing year 2018/2019. Increases were primarily for unknown destinations (205,700 MT), Mexico (86,700 MT, including decreases of 3,600 MT), South Korea (84,800 MT), the Philippines (45,200 MT, including 32,000 MT switched from unknown destinations and decreases of 12,000 MT), and El Salvador (27,700 MT). Reductions were reported for Japan (1,900 MT). Exports of 356,800 MT were reported to the Philippines (101,200 MT), Indonesia (55,000 MT), Mexico (51,700 MT), Japan (35,700 MT), and South Korea (31,600 MT).
- Rice: Net sales of 31,400 MT for 2017/2018 were up noticeably from the previous week, but down 38 percent from the prior 4-week average. Increases reported for Haiti (15,300 MT), Costa Rica (6,000 MT), Honduras (4,200 MT), Canada (3,500 MT, including decreases of 100 MT), and Mexico (1,400 MT, including decreases of 300 MT), were partially offset by reductions for El Salvador (500 MT), Jordan (300 MT), the Dominican Republic (200 MT), and Nicaragua (200 MT). Exports of 56,900 MT were up 57 percent from the previous week, but down 22 percent from the prior 4-week average. The destinations were primarily to Honduras (17,000 MT), Haiti (15,000 MT), Japan (7,900 MT), Mexico (6,400 MT), and Guatemala (5,900 MT).
U.S. EXPORT SALES FOR WEEK ENDING 6/21/2018
|
|
CURRENT MARKETING YEAR |
NEXT MARKETING YEAR |
||||||
|
COMMODITY |
NET SALES |
OUTSTANDING SALES |
WEEKLY EXPORTS |
ACCUMULATED EXPORTS |
NET SALES |
OUTSTANDING SALES |
||
|
CURRENT YEAR |
YEAR |
CURRENT YEAR |
YEAR |
|||||
|
|
THOUSAND METRIC TONS |
|||||||
|
WHEAT |
|
|
|
|
|
|
|
|
|
HRW |
208.8 |
1,067.3 |
1,887.5 |
93.8 |
264.8 |
886.7 |
0.0 |
0.0 |
|
SRW |
32.2 |
499.8 |
718.6 |
31.0 |
160.4 |
128.0 |
0.0 |
0.0 |
|
HRS |
179.1 |
1,549.5 |
1,618.0 |
105.4 |
298.0 |
583.4 |
0.0 |
0.0 |
|
WHITE |
117.6 |
1,215.9 |
1,436.8 |
126.5 |
368.9 |
554.1 |
0.0 |
0.0 |
|
DURUM |
26.0 |
125.8 |
169.3 |
0.0 |
1.6 |
34.8 |
0.0 |
0.0 |
|
TOTAL |
563.7 |
4,458.2 |
5,830.2 |
356.8 |
1,093.7 |
2,187.0 |
0.0 |
0.0 |
|
BARLEY |
0.0 |
46.7 |
26.8 |
0.6 |
2.2 |
2.4 |
0.0 |
0.0 |
|
CORN |
849.9 |
13,601.2 |
9,159.7 |
1,479.9 |
43,651.4 |
46,302.5 |
636.8 |
4,287.7 |
|
SORGHUM |
0.0 |
320.1 |
380.1 |
0.0 |
4,840.0 |
4,051.5 |
0.0 |
38.0 |
|
SOYBEANS |
358.5 |
8,115.8 |
6,755.9 |
500.5 |
48,694.1 |
52,605.1 |
642.3 |
7,523.4 |
|
SOY MEAL |
146.3 |
2,505.3 |
2,130.8 |
273.4 |
8,869.9 |
7,827.2 |
75.5 |
390.8 |
|
SOY OIL |
30.5 |
180.1 |
103.8 |
7.5 |
754.2 |
879.2 |
2.4 |
15.5 |
|
RICE |
|
|
|
|
|
|
|
|
|
L G RGH |
11.0 |
118.7 |
163.5 |
28.6 |
1,121.8 |
1,190.2 |
0.0 |
30.0 |
|
M S RGH |
0.0 |
0.0 |
9.2 |
0.0 |
52.7 |
186.4 |
0.0 |
0.0 |
|
L G BRN |
1.6 |
3.9 |
10.1 |
0.3 |
14.6 |
15.9 |
0.0 |
0.0 |
|
M&S BR |
0.1 |
0.2 |
4.2 |
0.1 |
66.4 |
188.3 |
0.0 |
0.0 |
|
L G MLD |
17.7 |
63.7 |
210.8 |
17.1 |
851.7 |
772.9 |
0.0 |
0.0 |
|
M S MLD |
1.0 |
108.0 |
75.9 |
10.9 |
506.4 |
748.5 |
0.0 |
1.3 |
|
TOTAL |
31.4 |
294.5 |
473.6 |
56.9 |
2,613.6 |
3,102.2 |
0.0 |
31.3 |
|
COTTON |
|
THOUSAND RUNNING BALES |
||||||
|
UPLAND |
-18.9 |
3,057.1 |
2,025.3 |
367.8 |
13,111.3 |
12,340.4 |
196.2 |
5,313.2 |
|
PIMA |
2.3 |
94.6 |
67.8 |
12.7 |
541.6 |
558.8 |
56.4 |
201.1 |
Terry Reilly
Senior Commodity Analyst – Grain and Oilseeds
Futures International │190 S LaSalle St., Suite 410│Chicago, IL 60603
W: 312.604.1366
AIM: fi_treilly
ICE IM: treilly1
Skype: fi.treilly

Trading of futures, options, swaps and other derivatives is risky and is not suitable for all persons. All of these investment products are leveraged, and you can lose more than your initial deposit. Each investment product is offered only to and from jurisdictions where solicitation and sale are lawful, and in accordance with applicable laws and regulations in such jurisdiction. The information provided here should not be relied upon as a substitute for independent research before making your investment decisions. Futures International, LLC is merely providing this information for your general information and the information does not take into account any particular individual’s investment objectives, financial situation, or needs. All investors should obtain advice based on their unique situation before making any investment decision. The contents of this communication and any attachments are for informational purposes only and under no circumstances should they be construed as an offer to buy or sell, or a solicitation to buy or sell any future, option, swap or other derivative. The sources for the information and any opinions in this communication are believed to be reliable, but Futures International, LLC does not warrant or guarantee the accuracy of such information or opinions. Futures International, LLC and its principals and employees may take positions different from any positions described in this communication. Past results are not necessarily indicative of future results.