From: Terry Reilly
Sent: Friday, June 29, 2018 8:57:35 AM (UTC-06:00) Central Time (US & Canada)
Subject: FI Morning Grain Comments 06/29/18
- 6-10 is drier for the north central Delta and temperatures are unchanged. 11-15 day is drier for the northern Delta and temps are cooler for the Midwest.
- The US trends warmer into the weekend through mid-next week.
- The forecast calls for limited precipitation during the second week of July, but the northern and eastern Midwest may pick up on rain.
- U.S. northern Plains will receive daily rainfall through the next week.
- The Texas Blacklands, West Texas and parts of the Delta where dryness will continue to see crop stress due to net drying through early July.
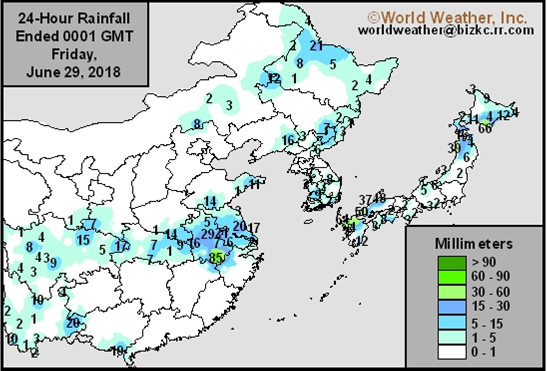
- Shandong, China, saw beneficial rain Monday into Tuesday. Southern Shanxi, extreme northern Henan and central Shaanxi saw rain as well.
- Northeast China rainfall will be frequent through July 4.
- Western Europe will continue to see a high-pressure ridge in place through Friday, limiting rainfall and keeps temperatures warm.
- Eastern Ukraine through Kazakhstan will see drought conditions for a while. Eastern portions of Russia’s Southern Region into Kazakhstan will see some relief from warm temperatures this weekend.
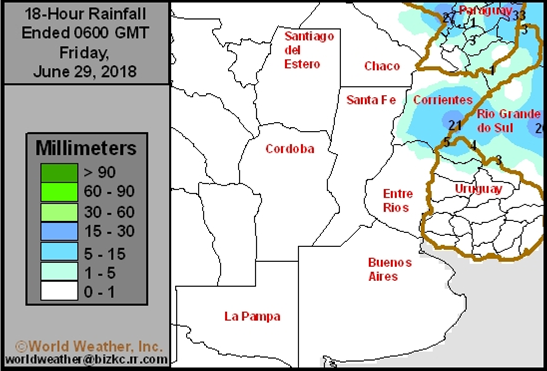
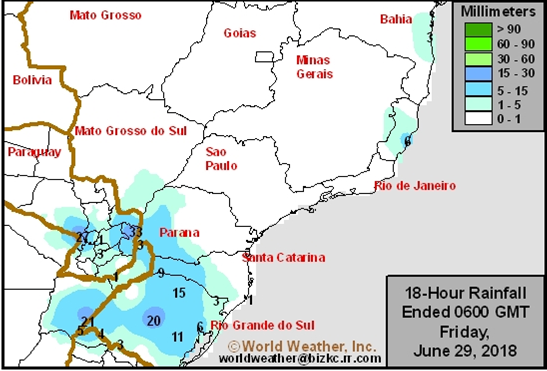
- Brazil and Argentina will see net drying through at least July 8.
Source: World Weather Inc. and FI


SIGNIFICANT CORN AND SOYBEAN BELT PRECIPITATION EVENTS
WEST CORN BELT EAST CORN BELT
Fri 15% cvg of up to 0.30” 10% cvg of up to 0.30”
and local amts to 0.75”; and locally more;
wettest NW wettest SW
Sat-Sun 80% cvg of up to 0.75” 60% cvg of up to 0.60”
and local amts to 1.50” and local amts to 1.30”;
with some 1.50-3.50” wettest west
amts in north Ia. and
south Mn.; SE and far
NW driest
Mon-Wed 10-25% daily cvg of 15-35% daily cvg of
up to 0.75” and local up to 0.40” and locally
amts to 1.50” each more each day
day; driest south
Jul 5-6 55% cvg of up to 0.75” 60% cvg of up to 0.40”
and local amts to 1.50”; and local amts to 1.0”
wettest north; driest
SW
Jul 7 15% cvg of up to 0.20”
and locally more
Jul 7-8 5-20% daily cvg of up
to 0.25” and locally
more each day
Jul 8-9 60% cvg of up to 0.60”
and locally more
Jul 9-10 60% cvg of up to 0.50”
and locally more
Jul 10-12 5-20% daily cvg of up
to 0.25” and locally
more each day
Jul 11-12 5-20% daily cvg of up
to 0.25” and locally
more each day
U.S. DELTA/SOUTHEAST SIGNIFICANT PRECIPITATION EVENTS
DELTA SOUTHEAST
-Fri 5-20% daily cvg of up
to 0.25” and locally
more each day
Tdy-Sat 20-40% daily cvg of
up to 0.60” and locally
more each day; N.C.
and Va. driest
Sat-Sun 20-40% daily cvg of
up to 0.40” and locally
more each day
Sun-Tue 70% cvg of up to 0.75”
and local amts to 1.50”
and a few 1.50-3.0”
amts; Carolinas and
Va. driest
Mon-Tue 75% cvg of up to 0.60”
and local amts to 1.35”;
wettest south
Wed-Jul 6 10-25% daily cvg of 25-50% daily cvg of
up to 0.30” and locally up to 0.75” and locally
more each day more each day
Jul 7-12 10-25% daily cvg of 15-35% daily cvg of
up to 0.30” and locally up to 0.50” and locally
more each day more each day
Source: World Weather Inc. and FI
Source: World Weather Inc. and FI
Source: World Weather Inc. and FI
Source: World Weather Inc. and FI
- Statistics Canada to release June seeded area for wheat, soy, barley, canola, durum 8:30am
- USDA annual plantings data for corn, soy, wheat, cotton, noon
- USDA grain stockpiles data for 2Q, noon
- Traders’ estimates for July raw sugar delivery on ICE Futures
- ICE Futures Europe commitments of traders weekly report on coffee, cocoa, sugar positions, ~1:30pm ET (~6:30pm London)
- CFTC commitments of traders weekly report on positions for various U.S. futures and options, 3:30pm
- Honduran Coffee Institute releases monthly exports, 4pm
- FranceAgriMer weekly updates on French crop conditions
SATURDAY, JUNE 30:
- AmSpec data on Malaysia’s June 1-30 palm oil exports, 11pm ET Friday (11am Kuala Lumpur Saturday)
SUNDAY, JULY 1:
- Mexico elects a new president. Polls show leftist Andres Manuel Lopez Obrador holds a wide lead
- Canada’s retaliatory tariffs on the U.S. begin on goods including motorboats, whiskies and strawberry jam. Click here for a list
MONDAY, JULY 2:
- Canada on holiday
- International Grains Council publishes its monthly forecasts for grains supply and markets, 8:30am ET (1:30pm London)
- ICE Futures U.S. releases delivery notice for July raw-sugar contract, ~9am
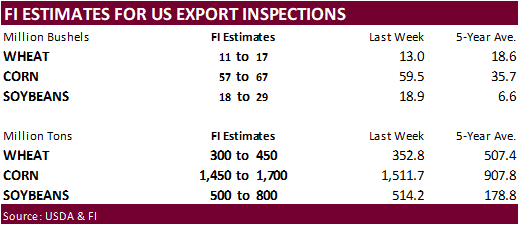
- USDA weekly corn, soybean, wheat export inspections, 11am
- Costa Rican Coffee Institute releases exports for June, 2pm
- USDA soybean crush data for May, 3pm
- USDA weekly crop progress report, 4pm
- International Cotton Advisory Committee releases monthly report on world cotton production, demand and stockpiles, 4pm
- Cargo surveyors Intertek and SGS release their respective data on Malaysia’s June palm oil exports
- Ivory Coast weekly cocoa arrivals
TUESDAY, JULY 3:
- New Zealand dairy auction on Global Dairy Trade online market starts ~7am ET Tuesday (~noon London Tuesday, ~11pm Wellington Tuesday)
- OECD-FAO annual report on agriculture outlook, 9am ET (2pm London)
WEDNESDAY, JULY 4:
- U.S. Independence Day holiday; CBOT grains trading closed
THURSDAY, JULY 5:
- Guatemala coffee exports for June
- AB Foods trading updates, 2am ET (7am London)
- FAO Food Price Index, 4am ET (9am London)
- EIA U.S. weekly ethanol inventories, output, 11am (delayed from Wednesday due to U.S. holiday)
- Andre Pessoa, head of Agroconsult, and executives from Brazil’s grain exporter group Anec speak on nation’s 2018-19 soybean and corn crops
- EU weekly grain, oilseed import and export data
- Port of Rouen data on French grain exports
- Bloomberg weekly survey of analysts’ expectations on grain, sugar prices
FRIDAY, JULY 6:
- China is set to start levying tariffs on agriculture products, in retaliation for U.S. tariffs on imports from China
- USDA weekly crop net-export sales for corn, wheat, soy, cotton, 8:30am (delayed from Thursday due to U.S. holiday)
- ICE Futures Europe commitments of traders weekly report on coffee, cocoa, sugar positions, ~1:30pm ET (~6:30pm London)
- CFTC commitments of traders report will be delayed until Monday July 9
- FranceAgriMer weekly updates on French crop conditions
Source: Bloomberg and FI
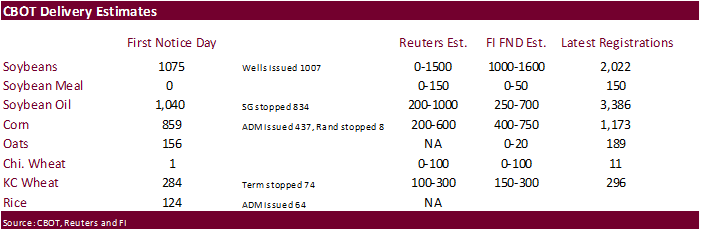
・ Corn up 437 to 1173
・ Soybeans up 436 to 2022
Weekly Bull/Bear Bloomberg Survey (taken Wed.)
・ Corn: Bullish: 10 Bearish: 6 Neutral: 3
・ Wheat: Bullish: 7 Bearish: 6 Neutral: 6
・ Soybeans: Bullish: 7 Bearish: 6 Neutral: 6
・ Raw Sugar : Bullish: 3 Bearish: 2 Neutral: 4
・ White sugar: Bullish: 3 Bearish: 2 Neutral: 4
・ White-sugar premium: Widen: 2 Narrow: 1 Neutral: 6
・ USD is sharply lower, WTI crude higher, and gold higher, at the time this was written.
・ US Personal Income May: 0.4% (est 0.4% prev R 0.2%)
– US Personal Spending May: 0.2% (est 0.4% prev R 0.5%)
– US Real Personal Spending May: 0.0% (est 0.2% prev R 0.3%)
・ US PCE Deflator May M/M: 0.2% (est 0.2% prev 0.2%)
– US PCE Deflator May Y/Y: 2.3% (est 2.2% prev 2.0%)
・ US PCE Core May M/M: 0.2% (est 0.2% prev 0.2%)
– US PCE Core May Y/Y: 2.0% (est 1.9% prev 1.8%)
Corn.
- CBOT corn is higher on a lower USD and SK corn demand.
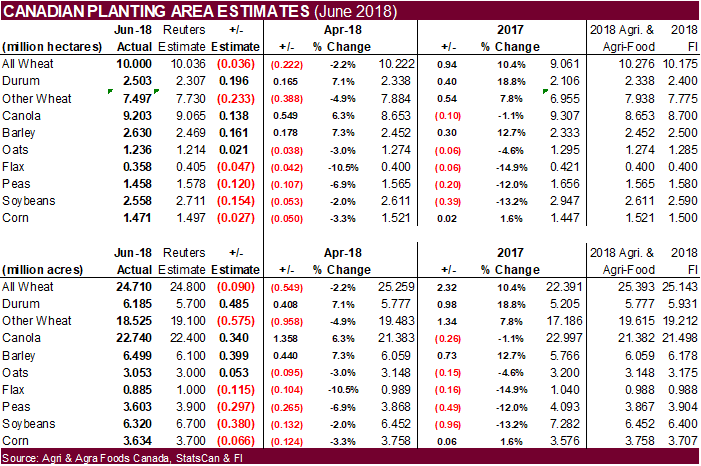
- StatsCan updated their corn and barley acreage. The Canadian corn area was downward revised 3.3% from April to 3.634 million hectares, 66,000 hectares below a Reuters trade guess. The Canadian barley area increased 7.3% from April to 6.499 million hectares, 399,000 hectares above the average trade guess.
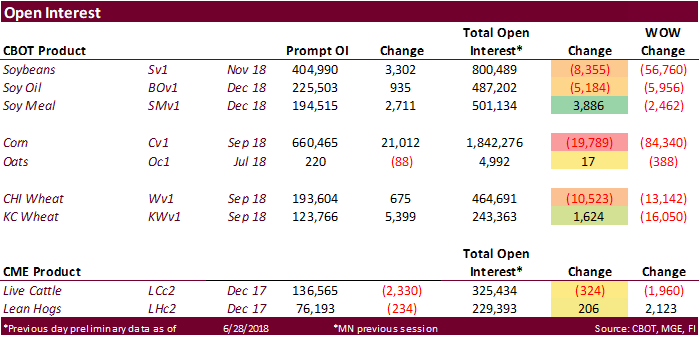
- Total corn OI was down 19,789 contracts.
- Baltic Dry Index was up 56 points to 1,385, or 4.2%.
・ FranceAgriMer corn conditions were rated 74 percent as of June 25, up two points from the previous week.
・ Parana’s AgMin, Deral, estimated the winter corn crop in Brazil’s state at 9.4 million tons, down 600,000 tons from previous.
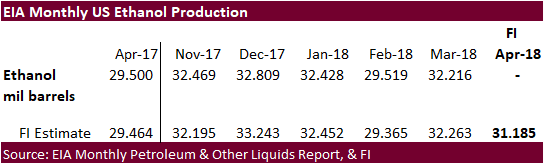
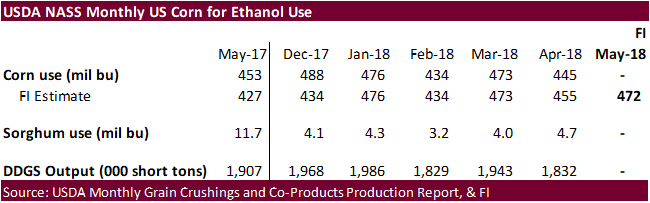
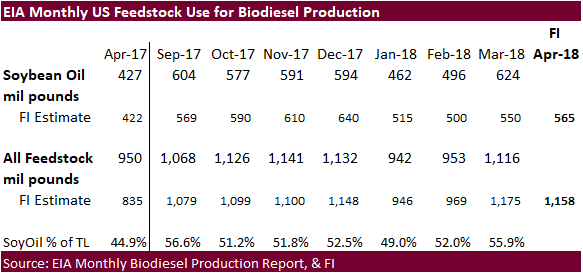
・ End of the month reports from the US government will include EIA biofuel updates (biodiesel and ethanol). The next business day, Monday, will include the USDA/NASS updated on corn and oilseed grind/crushing. Our trade estimates can be found after the export development section(s).
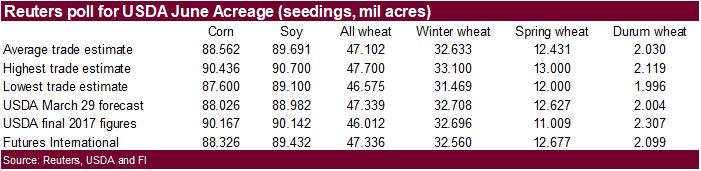
- We look for USDA to report the June US corn planted area at 88.326 million acres (300,000 acres above USDA March), below an average trade guess of 88.562 million (536,000 acres above USDA).
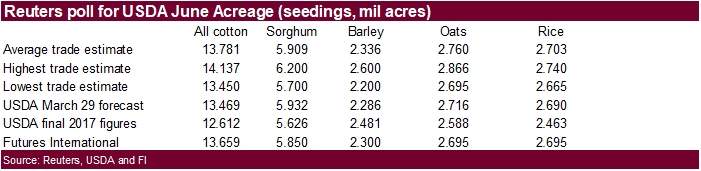
- Combining the average trade guesses for US corn, soybean, wheat, cotton, sorghum, barley, oats and rice area, the trade looks for 1.404 million acre increase from March. We are looking for this combined area to increase 0.853 million. We are looking for USDA to decrease the all-wheat area by 3,000 acres, and the trade looks for all-wheat to decrease 257,000 acres.
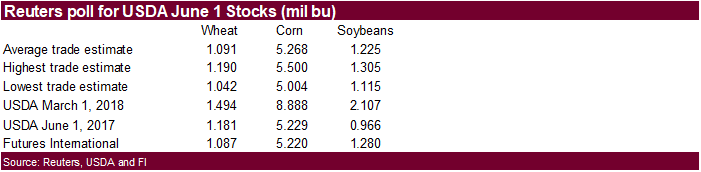
- FI looks for the June 1 US corn stocks to end up at 5.220 billion bushels, 48 million below a Reuters trade guess and 9 million below a year ago.
- The Senate passed their version of the Farm Bill 86-11. The Bill did not change the food stamp program. Negotiation between House and Senate will begin. The House version did not pass.
・ China sold 852,123 tons of corn out of reserves, 21.4% of what was offered at an average price of 1415 yuan per ton ($213.93/ton). 1.060 million tons of corn were sold on Thursday.
・ China sold an estimated 48.9 million tons of corn out of reserves since April 12.
・ China plans to auction off 8 million tons of corn on July 5 and 6.
・ South Korea’s MFG bought 70,000 tons of corn out of 140k sought, at $208.80/ton, for arrival around December 14. South Korea bought just over 1.7 million tons of corn in June.
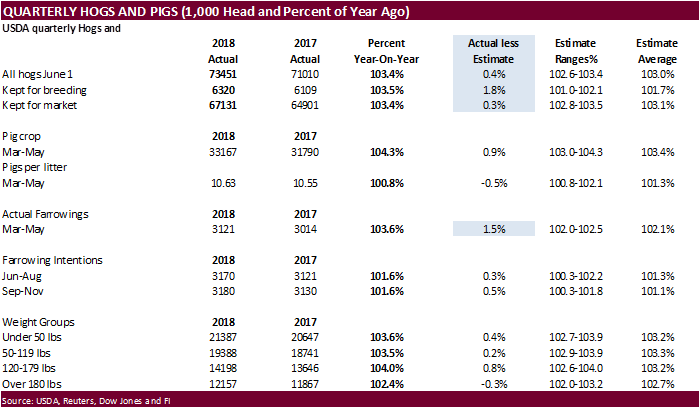
The USDA Hogs and Pigs report showed a larger than expected US herd. It came in a record 73.451 million, up 3.4 percent from a year ago. Kept for breeding rose 3.5%, 1.8 percentage points above a Reuters trade guess. Going forward, good US pork exports, excluding China, could limit a downtrend in hog prices amid large supplies. But there is a lot of uncertainty from trade spats spreading to other countries.
Soybean complex.
・ US soybean complex is mostly higher on a sharply lower USD and talk of US soybeans getting competitive against SA. Bull spreading in meal sent the back months lower after the open.
・ US exporters sold 130,632 tons of soybeans to Mexico.
・ Soybean prices are on track to end the month 13 percent lower.
- Total soybeans OI was down 8,355 contracts.
- StatsCan reported the revised Canadian 2018 canola area up 6.3% to 22.740 million hectares, 340,000 hectares above the average trade guess.
- United Oilseeds estimated EU’s rapeseed production at 19.8 million tons, a 9.2% downgrade from 21.8 million tons previously, due to drought. Last year the EU produced about 22 million tons of rapeseed.
・ End of the month reports from the US government will include EIA biofuel updates (biodiesel and ethanol). The next business day, Monday, will include the USDA/NASS updated on corn and oilseed grind/crushing. Our trade estimates can be found after the export development section(s).
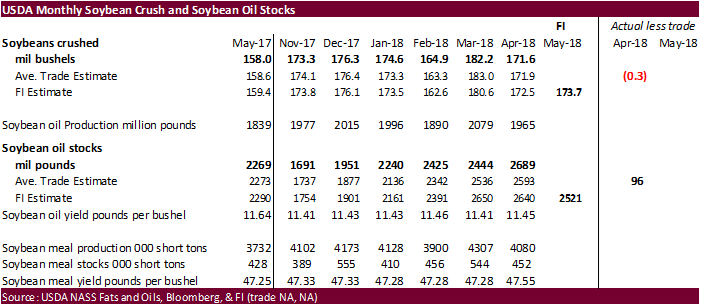
・ Reuters shows the average trade guess for the USDA/NASS US May crush at 173.9 million bushels (173.1-174.5) and stocks at 2.462 billion (2.420-2.521). We are using 173.7 and 2.521. The trade average for soybean oil implies excellent demand during May.
- We look for USDA to report the June US soybean planted area at 89.432 million acres (450,000 acres above USDA March), below an average trade guess of 89.691 million (709,000 acres above USDA).
- FI looks for the June 1 US soybean stocks to end up at 1.280 billion bushels, 55 million above a Reuters trade guess and 314 million above a year ago.
・ China soybean meal is nearly at an 8-week high. China September soybean futures increased 14 yuan per ton or 0.4%, September meal was up 12 or 0.4%, China soybean oil up 0.4% and China September palm up 54 at 4856 yuan/ton or 1.2%.
・ September China cash crush margins were last running at 78 cents, up 3 cents from the previous day, and compares to 52 cents last week and 27 a year ago.
・ Rotterdam vegetable oils were unchanged to higher and SA soybean meal when delivered into Rotterdam were mostly lower as of early morning CT time.
・ September Malaysian palm was 17 lower at MYR2326 and cash down $2.50 at $600.00.
・ Offshore values were leading the soybean oil 24 higher (46 higher for the week to date) and soybean meal $1.30 higher ($5.10 higher for the week).
・ The USDA Attaché estimated 2017-18 China soybean imports at 97.0 million tons (same as USDA), and 2018-19 at 100.5 million tons (2.5MMT below USDA official). The also reported very little soybean meal imports for new-crop. https://gain.fas.usda.gov/Recent%20GAIN%20Publications/Oilseeds%20and%20Products%20Update_Beijing_China%20-%20Peoples%20Republic%20of_6-22-2018.pdf
USDA Attaché on China soybeans
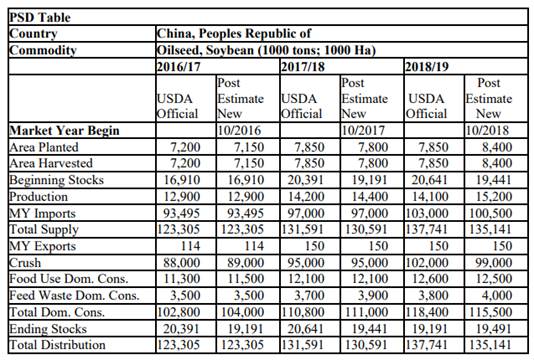
Source: USDA Attaché and FI
- USDA under the 24-hour reporting system reported private exporters sold 130,632 tons of soybeans for delivery to Mexico during the 2018-19 marketing year.
- Iran seeks 30,000 tons of sunflower oil on July 10.
- Iran seeks 30,000 tons of palm olein oils on July 10.
- Iran seeks 30,000 tons of soybean oil on August 1.
・ China sold 376,965 tons of soybeans out of reserves so far, this season.
- All three US wheat markets are higher in part to a lower USD and positioning.
- Total Chicago wheat OI was down 10,523 contracts.
- StatsCan reported a 2.2% decrease in the 2018 all-wheat Canadian wheat area to 24.710 million hectares, 90,000 hectares below a Reuters trade guess and up 10.4% from 2017. Durum area was estimated at 6.185 million hectares, 485,000 hectares above expectations.
- FranceAgriMer soft wheat conditions were rated 74 percent as of June 25, down a point from the previous week. Barley conditions for the winter crop were also down one to 72 percent while spring was unchanged at 73 percent.
- SovEcon lowered its 2018 Russian wheat production projection to 72.5 million tons from 73.1 million tons, down from their forecast of 85.8 million tons in 2017.
- We look for USDA to increase the spring wheat planted area by 50 million acres but the trade is looking for a 196,000 acre decrease. Our winter wheat planted area is 148,000 below USDA and we see durum seedings increasing 95,000 acres. The trade is looking for winter wheat to decline 75,000 acre and durum to increase 26,000 acres. Our all-wheat planted area of 47.336 million acres is 3,000 acres below USDA March. The trade is looking for a 237,000 acre decrease.
- June 1 US all-wheat stocks are estimated by FI at 1.087 million acres, 4 million below an average trade guess, and 94 million below a year ago.
Export Developments.
- Iraq seeks 50,000 tons of wheat from the US, Australia and/or Canada on July 2, valid until July 8.
・ Jordan seeks 120,000 tons of barley on July 4 for Oct-Nov shipment.
- Japan in a SBS import tender seeks 120,000 tons of feed wheat and 200,000 tons of barley on July 4 for arrival by December 28.
- Syria seeks 200,000 tons of wheat on July 2 for Aug 1-Sep 30 shipment. Origins include Russian, Romania and/or Bulgaria.
- Bangladesh seeks 50,000 tons of wheat on July 3 for shipment within 40 days of contract signing.
・ Jordan seeks 120,000 tons of wheat on July 8 for Oct-Nov shipment.
Rice/Other
- Results awaited: South Korea seeks 102,800 tons of rice for September-February arrival on June 27.
TONNES(M/T) GRAIN TYPE ARRIVAL/PORT
20,000 Brown Short Sept. 15, 2018/Incheon
20,000 Brown Short Sept. 15, 2018/Ulsan
20,000 Brown Short Sept. 15, 2018/Masan
10,000 Brown long Sept. 30, 2018/Mokpo
10,000 Brown long Sept. 30, 2018/Donghae
2,800 Milled Medium Dec. 1-31, 2018/Busan
10,000 Milled Medium Feb. 28, 2019/Busan
10,000 Milled Medium Feb. 28, 2019/Busan
- Iran seeks 50,000 tons of rice from Thailand on July 3.
Terry Reilly
Senior Commodity Analyst C Grain and Oilseeds
Futures International │190 S LaSalle St., Suite 410│Chicago, IL 60603
W: 312.604.1366
AIM: fi_treilly
ICE IM: treilly1
Skype: fi.treilly

Trading of futures, options, swaps and other derivatives is risky and is not suitable for all persons. All of these investment products are leveraged, and you can lose more than your initial deposit. Each investment product is offered only to and from jurisdictions where solicitation and sale are lawful, and in accordance with applicable laws and regulations in such jurisdiction. The information provided here should not be relied upon as a substitute for independent research before making your investment decisions. Futures International, LLC is merely providing this information for your general information and the information does not take into account any particular individual’s investment objectives, financial situation, or needs. All investors should obtain advice based on their unique situation before making any investment decision. The contents of this communication and any attachments are for informational purposes only and under no circumstances should they be construed as an offer to buy or sell, or a solicitation to buy or sell any future, option, swap or other derivative. The sources for the information and any opinions in this communication are believed to be reliable, but Futures International, LLC does not warrant or guarantee the accuracy of such information or opinions. Futures International, LLC and its principals and employees may take positions different from any positions described in this communication. Past results are not necessarily indicative of future results.