From: Terry Reilly
Sent: Tuesday, July 10, 2018 8:35:17 AM (UTC-06:00) Central Time (US & Canada)
Subject: FI Morning Grain Comments 07/10/18
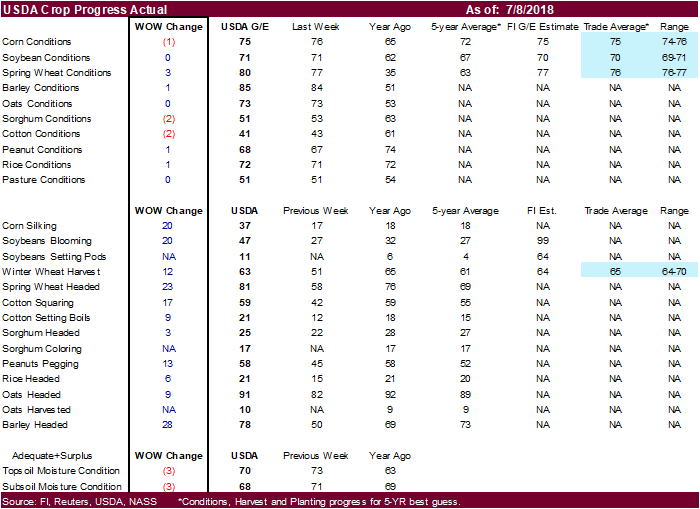
· This week’s crop progress has no implications on our winter and spring wheat crop production forecasts for the upcoming July USDA S&D supply side estimates.
· Winter wheat conditions were not reported as 63 percent of the crop had been harvested. 81 percent of the spring wheat crop was headed as of Sunday. Conditions for spring wheat improved 3 points from last week in the G/E categories.
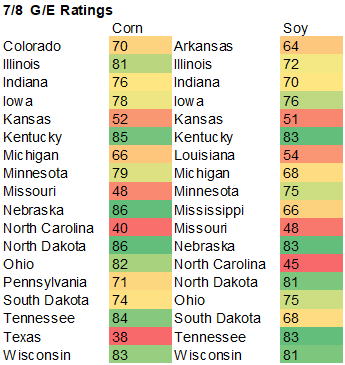
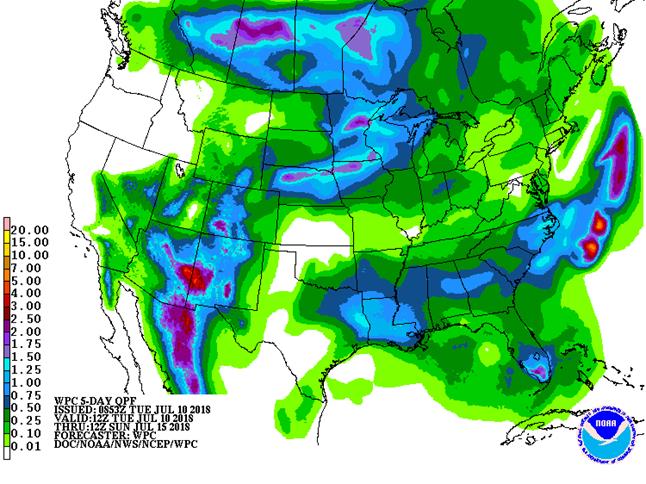
· 37 percent of the US corn crop reached the silking stage as of Sunday. With one-third of it pollinating, US corn is in good shape after milder temperatures over the weekend slowed evaporation rates. Dry weather this week appears to be less threatening for the US crop. Note the US Midwest will see 70-75 percent coverage Wed into Sat and 80 percent Sat into Tue of next week. More rain is expected July 17-20th. US G/E corn conditions decline one point, as expected.
· 47 percent of the US soybean crop is blooming, 20 points above average. 11 percent is already setting pods, 7 points above average. US soybean crop conditions for the combined good and excellent categories were unchanged at 71 percent, 9 points above a year ago.
- 6-10 day is wetter for the southern Midwest and northern Delta, and drier for the northwestern Midwest and northern Plains. Temps are cooler in the central Midwest and parts of the Plains.
- The 11-15 day is drier for the northeastern Delta and eastern Midwest, and slightly wetter for the north central Plains. Temps are unchanged.
- The US will see net drying through Thursday from central Plains to Michigan. Rain will fall from the eastern Dakotas to upper Michigan Wednesday into Thursday. IA may see some of this rain.
- Temperatures will be warmer than normal across the US this week but trend cooler by the end of the week.
- US weather Friday will include rain in the northwestern half of the Corn Belt with 0.20 to 0.80 inch and local totals of 1.00 to 2.00 inches. Showers will also occur in the eastern Midwest, Delta, Tennessee River Basin, southeastern states and from southern California to the central and southern Rocky Mountains.
- US weather during the July 14-24 period will include a couple of waves of rain moving from northwest to southeast through the Midwest and northern and central Plains. These rains will become important as 0.20-0.75”, local 1-2”, will occur for each event.
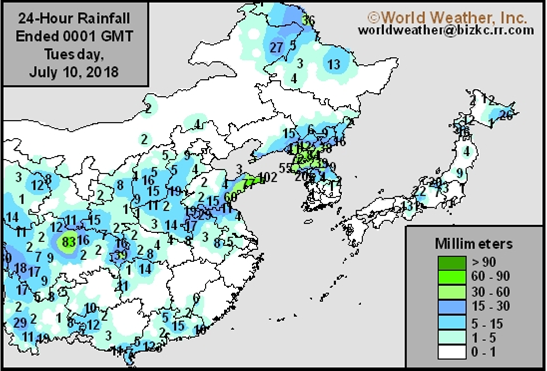
- The Canadian Prairies will see rain early this week.
- Australia will see an increase in net drying.
Source: World Weather Inc. and FI
SIGNIFICANT CORN AND SOYBEAN BELT PRECIPITATION EVENTS
WEST CORN BELT EAST CORN BELT
-Tue 5-15% daily cvg of up 10-25% daily cvg of
to 0.25” and locally up to 0.25” and locally
more each day; far SE more each day
and NW wettest
Wed-Thu Up to 15% daily cvg of
up to 0.20” and locally
more each day; some
days may be dry
Wed-Fri 75% cvg of up to 0.75”
and local amts to 2.0”;
far south and far NW
driest
Fri-Sat 70% cvg of up to 0.65”
and local amts to 1.30”;
driest south
Sat-Jul 16 80% cvg of up to 0.75”
and local amts to 1.50”;
far south driest
Sun-Jul 17 80% cvg of up to 0.75”
and local amts to 1.75”;
far south driest;
driest west
Jul 17-19 75% cvg of up to 0.65”
and local amts to 1.30”
Jul 18-20 50% cvg of up to 0.50”
and local amts to 1.10”;
driest south
Jul 20 15% cvg of up to 0.25”
and locally more
Jul 21 15% cvg of up to 0.25”
and locally more
Jul 21-23 60% cvg of up to 0.40”
and locally more
Jul 22-23 60% cvg of up to 0.40”
and locally more
U.S. DELTA/SOUTHEAST SIGNIFICANT PRECIPITATION EVENTS
DELTA SOUTHEAST
Tue-Wed 15-35% daily cvg of 5-20% daily cvg of up
up to 0.60” and locally to 0.50” and locally
more each day; more each day; wettest
driest north west Tuesday and NE
wettest Wednesday
Thu-Sun 10-25% daily cvg of 15-35% daily cvg of
up to 0.35” and locally up to 0.50” and locally
more each day more each day
Jul 16-17 60% cvg of up to 0.50”
and local amts to 1.10”;
wettest north
Jul 16-18 65% cvg of up to 0.75”
and local amts to 2.0”
Jul 18-23 5-20% daily cvg of up
to 0.30” and locally
more each day
Jul 19-23 10-25% daily cvg of
up to 0.40” and locally
more each day
Source: World Weather Inc. and FI
Source: World Weather Inc. and FI
- Cargo surveyors Intertek and AmSpec release their respective data on Malaysia’s July 1-10 palm oil exports, 11pm ET Monday (11am Kuala Lumpur Tuesday); SGS data during same period, 3am ET Tuesday (3pm local time Tuesday)
- Brazil’s crop agency Conab releases soy, corn output for July, 8am ET (9am Sao Paulo), along with 2017-18 grain and oilseed crop report
- Unica bi-weekly data on Brazil Center-South sugar production, 9am ET (10am Sao Paulo)
- Malaysian Palm Oil Board (MPOB) data on stockpiles, exports, production for June, 12:30am ET (12:30pm Kuala Lumpur)
- French Agriculture Ministry publishes crop areas, production forecasts
- FAO bi-annual food outlook report, which includes food import bill
- Global Ethanol Focus conference in Singapore, 1st day of 2
- EARNINGS: PepsiCo
WEDNESDAY, JULY 11:
- EIA U.S. weekly ethanol inventories, output, 10:30am
- USDA weekly crop net-export sales for corn, wheat, soy, cotton, 8:30am
- FranceAgriMer updates cereals balance sheets
- Global Ethanol Focus conference in Singapore, final day
THURSDAY, JULY 12:
- USDA weekly net-export sales for corn, wheat, soy, cotton, 8:30am
- U.S. National Weather Service’s Climate Prediction Center will release its latest forecast for El Nino, 9am
- USDA’s monthly World Agricultural Supply and Demand Estimates (WASDE) report for July, noon
- Brazil coffee exporters group Cecafe releases data on shipments in June and the prospect for exports in 2018-19 crop
- Strategie Grains publishes monthly EU grains report
- Port of Rouen data on French grain exports
- Buenos Aires Grain Exchange weekly crop report
- Bloomberg weekly survey of analysts’ expectations on grain, sugar prices
- EARNINGS: Suedzucker
FRIDAY, JULY 13:
- China’s General Administration of Customs releases preliminary commodity trade data for June, including soy and palm oil, 10pm ET Thursday (10am Beijing Friday)
- ICE Futures Europe commitments of traders weekly report on coffee, cocoa, sugar positions, ~1:30pm ET (~6:30pm London)
- CFTC commitments of traders weekly report for period ending July 10 on positions for various U.S. futures and options, 3:30pm
- FranceAgriMer weekly updates on French crop conditions
Source: Bloomberg and FI
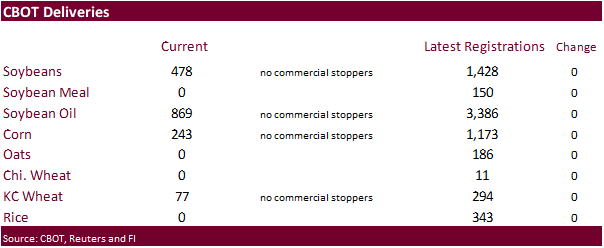
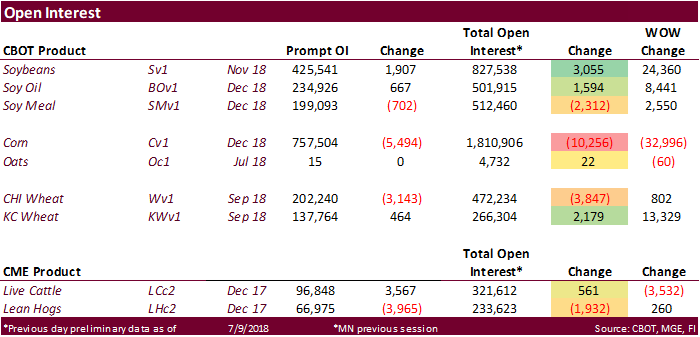
USDA inspections versus Reuters trade range
Wheat 268,221 versus 275,000-425,000
Corn 1,446,926 versus 850,000-1,600,000
Soybeans 654,834 versus 375,000-900,000
· We estimate the traditional funds now hold a net short position in soybeans.


· US stocks are higher, USD is higher, WTI crude higher, and gold lower, at the time this was written
· Canada Building Permits M/M May: 4.7% (est 0.0%; prev R -4.7%)
Corn.
· Brazil’s Conab estimated the 2017-18 corn production at 82.93 million tons, 2.1 million below the previous month but 100,000 tons above a Bloomberg trade guess. The yield was decreased to 4.967 tons/hectare from 5.101 tons in June. Last year Brazil produced 97.85 million tons.
· Conab’s report was viewed neutral corn and slightly bearish for soybean futures.
· The CNGOIC estimated China corn production at 216.5 million tons, 0.3% above 2017, but revised higher from 213.7 million tons last month.
- Baltic Dry Index was down 54 points to 1,155, or 3.4%.
- USDA US corn export inspections as of July 05, 2018 were 1,446,926 tons, within a range of trade expectations, below 1,538,556 tons previous week and compares to 1,010,889 tons year ago. Major countries included Japan for 388,411 tons, Korea Rep for 291,013 tons, and Mexico for 241,613 tons.
· Soybean and Corn Advisor left his US corn yield estimate unchanged at 178.0 bushels per acre.
· 37 percent of the US corn crop reached the silking stage as of Sunday. With one-third of it pollinating, US corn is in good shape after milder temperatures over the weekend slowed evaporation rates. Dry weather this week appears to be less threatening for the US crop. Note the US Midwest will see 70-75 percent coverage Wed into Sat and 80 percent Sat into Tue of next week. More rain is expected July 17-20th. US G/E corn conditions decline one point, as expected.
· We left out 180.5 bushels per acre US corn yield unchanged from the previous week. USDA may increase its yield on Thursday from its current 174.0 bushels. We think they will go to 178.0 bushels.
· Under the 24-hour reporting system, exporters reported the cancellations of 152,000 tons of sorghum for Mexico.
· US exporters also reported the 24-hour sale of 113,000 tons of corn for Egypt.

· China sold about 50-51 million tons of corn this season. China will offer more corn on July 12 & 13.

Soybean complex.
· The US soybean complex was higher this morning but gains limited as the Dalian products fell hard overnight amid a CNGOIC report on low use of soybean meal use, and US weather remains non-threatening. Above normal temperatures for the US this week are keeping some bulls in the market.
· Soybeans could trade two-sided if meal price come off their overnight close. Soybean oil is mixed but losses, if any, can be limited from higher crude oil.
· Conab’s report was viewed neutral corn and slightly bearish for soybean futures.
· Brazil’s Conab estimated the 2017-18 soybean production at 118.89 million tons, 0.8 million above the previous month and 600,000 tons above a Bloomberg trade guess. The yield was increased to 3.382 tons/hectare from 3.359 tons in June. Last year Brazil produced 114.07 million tons.
· The CNGOIC sees ample China soybean supplies through August as animal feed mills are reducing the soybean meal use due to low domestic pork prices.
· China September soybean futures decreased 51 yuan per ton or 1.4%, September meal was down 33 or 1.1%, China soybean oil down 60 (1.1%) and China September palm down 76 (1.6%).
· September China cash crush margins were last running at 64 cents, up a penny from the previous session, and compares to 56 cents last week and 84 a year ago.
· Rotterdam vegetable oils were lower and SA soybean meal when delivered into Rotterdam were 4-10 euros lower as of early morning CT time.
· MPOB reported June Malaysian palm oil production fell 12.6 percent to 1.333 million tons (23,795 tons below expectations) from 1.525 million tons from the previous month. MPOB June ending stocks increased nearly one percent from the previous month to 2.189 million tons (43,600 tons above expectations), while exports fell to 1.129 million tons (60,912 tons below expectations), 12.6 percent below May. 
· September Malaysian palm was 9 lower at MYR2259 and cash as unchanged at $585.00.
· Offshore values were leading soybean oil 26 points lower and meal $2.90/short ton higher.
· The US soybean crop is well advanced and US weather is non-threatening.
· 47 percent of the US soybean crop is blooming, 20 points above average. 11 percent is already setting pods, 7 points above average. US soybean crop conditions for the combined good and excellent categories were unchanged at 71 percent, 9 points above a year ago. The soybean conditions were one point above a trade average.
· Soybean and Corn Advisor left his US soybean yield estimate unchanged at 51.0 bushels per acre.
· We lowered our US soybean yield to 49.2 bushels per acre from 49.4. Production decreased to 4.372 billion bushels from 4.390 billion. USDA is at 4.280 billion. We look for USDA to leave its US soybean yield estimate unchanged on Thursday.
- USDA US soybean export inspections as of July 05, 2018 were 654,834 tons, above a range of trade expectations, below 849,374 tons previous week and compares to 477,140 tons year ago. Major countries included Egypt for 220,905 tons, Indonesia for 95,938 tons, and China T for 86,249 tons.
· India planting progress is running at a slow pace. 6.359 million hectares of oilseeds had been planted, down from 7.345 million a year ago.
· NOPA is due out with the US soybean crush on Monday, July 16.
· China will offer 493,000 tons of soybean reserves on July 11 and July 18. China sold 660,524 tons of soybeans out of reserves so far, this season.
· China will offer 49,000 tons of soybean oil on July 11.
- China will offer 61,000 tons of rapeseed oil on July 17.
- Iran seeks 30,000 tons of sunflower oil on July 10.
- Iran seeks 30,000 tons of palm olein oils on July 10.
- Iran seeks 30,000 tons of soybean oil on August 1.
· US wheat futures are on the defensive from lower Paris wheat futures and US spring wheat conditions unexpectedly improving from the previous week.
· The CNGOIC estimated China wheat production at 122.5 million tons, 5.6% below 2017, down from 126.7 million tons last month.
- December Paris wheat fell 1.25 euros to 185.50 euros in early US trading hours, despite additional downgrades to the EU wheat crop.
- France’s AgMin (initial) estimated the soft wheat crop at 36.1MMT, down from 36.6 million tons in 2017. Last week Strategie estimated this crop at 33.3 MMT. This could be perceived as a high estimate by the AgMin, and pressuring Parris wheat futures.
- A Bloomberg survey pegged German wheat production estimated at 21.5 MMT versus 24.3 MMT last year (DBV estimate). The range of estimates was 20.8-22.1 MMT.
- A recent Reuters poll pegged the EU soft wheat production at 136 million tons.
- The EU reported 209,000 tons of soft wheat exports were exported during the first week of the local marketing year, down from 230,000 tons during the same period a year ago. FC Stone EU soft wheat production survey: 135.3MMT (down 6.4MMT on last month)
- USDA US all-wheat export inspections as of July 05, 2018 were 268,221 tons, within a range of trade expectations, below 324,548 tons previous week and compares to 536,002 tons year ago. Major countries included China T for 49,201 tons, Philippines for 41,866 tons, and Japan for 35,220 tons.
· US winter wheat conditions were not reported as 63 percent of the crop had been harvested, 2 points below a trade average. 81 percent of the spring wheat crop was headed as of Sunday. Conditions for spring wheat improved 3 points from last week in the G/E categories, 4 points above a trade average.
- SovEcon lowered its Russia wheat crop to 69.6 million tons from 72.5 million previously. They are still perceived as on the high side for production. Grain output was pegged at 113.9 million tons, down from 118.6 million tons previously. Corn was lowered 200,000 tons to 12.5 million tons, and barley lowered to 16.9 million from 17.8 million tons.
· Egypt’s GASC said they seek wheat for August 21-31 shipment. The lowest offer at Egypt’s state grain buyer GASC’s wheat purchasing tender was $203.65 per ton for 60,000 tons of Russian wheat.
· Japan seeks 62,865 tons of milling wheat this week. (Reuters)
Details are as follows (in tons):
COUNTRY TYPE QUANTITY
U.S. Western White 17,177 *
U.S. Dark Northern Spring (protein minimum 14.0%) 11,353 *
Australia Standard White (West Australia) 34,335 *
Shipments: * Loading between Sept. 1 and Sept. 30, 2018
· Mauritius seeks 6,000 tons of white rice on July 13 for Sep 1-Nov 30 shipment.
· Jordan seeks 120,000 tons of barley on July 11 for Oct/Nov shipment.
- Japan in a SBS import tender seeks 120,000 tons of feed wheat and 200,000 tons of barley on July 11 for arrival by December 28.
- Results awaited: Syria seeks 200,000 tons of wheat on July 2 for Aug 1-Sep 30 shipment. Origins include Russian, Romania and/or Bulgaria.
· Jordan seeks 120,000 tons of wheat on July 19 for Oct-Nov shipment.
Rice/Other
- China sold 145,156 tons of rice from state reserves at auction at an average price of 2248 yuan/per ton or $339.83/ton, 6.1 percent of what was offered.
- Results awaited: Iran seeks 50,000 tons of rice from Thailand on July 3.
Terry Reilly
Senior Commodity Analyst – Grain and Oilseeds
Futures International │190 S LaSalle St., Suite 410│Chicago, IL 60603
W: 312.604.1366
AIM: fi_treilly
ICE IM: treilly1
Skype: fi.treilly

Trading of futures, options, swaps and other derivatives is risky and is not suitable for all persons. All of these investment products are leveraged, and you can lose more than your initial deposit. Each investment product is offered only to and from jurisdictions where solicitation and sale are lawful, and in accordance with applicable laws and regulations in such jurisdiction. The information provided here should not be relied upon as a substitute for independent research before making your investment decisions. Futures International, LLC is merely providing this information for your general information and the information does not take into account any particular individual’s investment objectives, financial situation, or needs. All investors should obtain advice based on their unique situation before making any investment decision. The contents of this communication and any attachments are for informational purposes only and under no circumstances should they be construed as an offer to buy or sell, or a solicitation to buy or sell any future, option, swap or other derivative. The sources for the information and any opinions in this communication are believed to be reliable, but Futures International, LLC does not warrant or guarantee the accuracy of such information or opinions. Futures International, LLC and its principals and employees may take positions different from any positions described in this communication. Past results are not necessarily indicative of future results.
