From: Terry Reilly
Sent: Thursday, August 02, 2018 8:19:05 AM (UTC-06:00) Central Time (US & Canada)
Subject: FI Morning Grain Comments 08/02/18
PDF attached
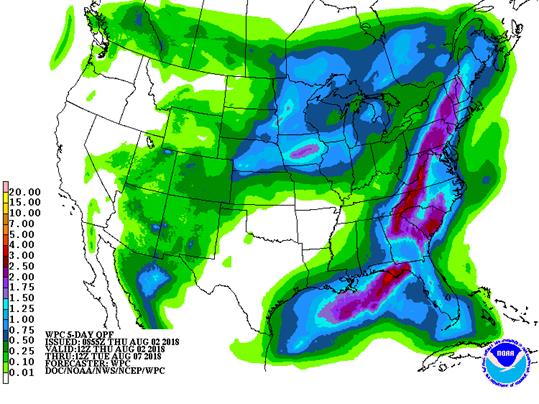
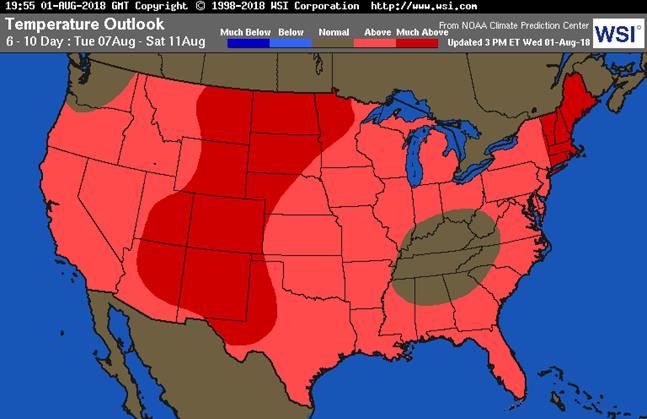
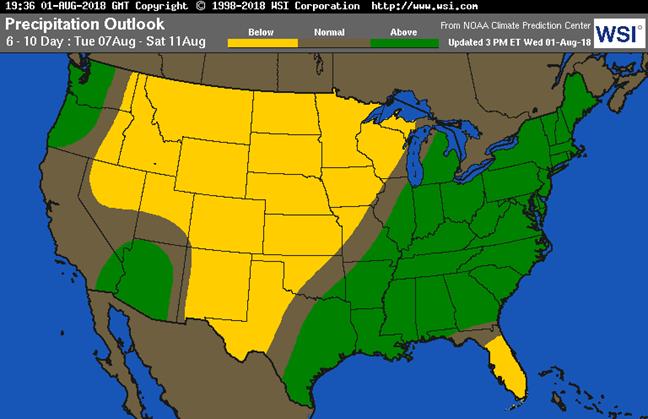
・ 6-10 day is wetter for the southwestern Midwest, Delta and southeastern Great Plains. Temps are cooler for the Midwest and central GP. 11-15 day is wetter for the southwestern Plains, southern and eastern Midwest, and northeastern Plains. Temps are slightly cooler.
・ The ridge of high pressure building up over the Great Plains and a part of western Corn Belt during the coming weekend and next week is still slated to happen, accelerating net drying and limiting rainfall across the Plains, Midwest and Delta from August 5th through August 14.
・ Temperatures across the northern Midwest will be warm to hot through early next week.
・ Rainfall between now and August 5 for the Midwest will be very important.
・ Some of the Midwest northern growing areas will pick up on rain. The northwestern growing areas will see rain this weekend. The Delta will see rain in the southeastern areas on Saturday. All other areas of the Delta will see net drying through the weekend.
・ Canada’s southern Prairies will still see stress this week for the summer crops. Southeastern Canada is in good shape.
SIGNIFICANT CORN AND SOYBEAN BELT PRECIPITATION EVENTS
WEST CORN BELT EAST CORN BELT
and locally more;
far NW wettest
Thu-Sat 15-35% daily cvg of
up to 0.35” and locally
more each day
Fri-Sun 70% cvg of up to 0.75”
and local amts over 2.0”;
far south driest
Sun-Tue 80% cvg of up to 0.75”
and local amts to 1.50”;
driest west
Mon 30% cvg of up to 0.35”
and local amts to 0.65”;
south and east wettest
Tue 15% cvg of up to 0.60”
and locally more;
wettest SE
Aug 8-11 5-20% daily cvg of up
to 0.30” and locally
more each day;
driest SW
Aug 8-12 5-20% daily cvg of up
to 0.30” and locally
more each day
Aug 12-14 50% cvg of up to 0.60”
and locally more;
wettest north
Aug 13-15 50% cvg of up to 0.50”
and locally more
U.S. DELTA/SOUTHEAST SIGNIFICANT PRECIPITATION EVENTS
DELTA SOUTHEAST
Tdy-Fri Up to 15% daily cvg of 90% cvg of 0.35-1.50”
up to 0.25” and locally and local amts to 2.50”
more each day; some with lighter rain in a few
days may be dry locations and some
bands of 2.50-3.75”;
east Ms. driest
Sat-Mon 15-35% daily cvg of
up to 0.30” and locally
more each day
Sat-Tue 15-35% daily cvg of
up to 0.50” and locally
more each day
Tue-Aug 8 60% cvg of up to 0.75”
and local amts to 1.50”;
driest south
Aug 8-9 80% cvg of up to 0.75”
and local amts to 2.0”
Aug 9-10 15-35% daily cvg of
up to 0.35” and locally
more each day
Aug 10-13 10-25% daily cvg of
up to 0.30” and locally
more each day
Aug 11-13 5-20% daily cvg of up
to 0.30” and locally
more each day
Aug 14-15 10-25% daily cvg of 15-35% daily cvg of
up to 0.25” and locally up to 0.50” and locally
more each day more each day
Source: World Weather Inc. and FI
- Costa Rica public holiday
- FAO food price index, 4am ET (9am London)
- USDA weekly net-export sales for corn, wheat, soy, cotton, 8:30am
- Port of Rouen data on French grain exports
- Buenos Aires Grain Exchange weekly crop report
- Bloomberg weekly survey of analysts’ expectations on grain, sugar prices
- Colorado State University provides its final seasonal forecast adjustment before the usual peak of the Atlantic hurricane season in late August
- EARNINGS: Pilgrim’s Pride Corp., Kellogg Co., Asahi Group Holdings
FRIDAY, AUG. 3:
- ICE Futures Europe commitments of traders weekly report on coffee, cocoa, sugar positions, ~1:30pm ET (~6:30pm London)
- CFTC commitments of traders weekly report on positions for various U.S. futures and options, 3:30pm
- FranceAgriMer weekly updates on French crop conditions
- EARNINGS: Kraft Heinz Co.
Source: Bloomberg and FI
- CBOR ethanol registrations were down 7 to 254.
Brazil’s Trade Ministry selected commodity exports
Commodity July 2018 June 2018 July 2017
COFFEE(60 KG BAG) 1,242,462 2,157,363 1,599,948
CRUDE OIL (TNS) 8,098,498 2,858,774 5,382,273
ETHANOL (LTR) 180,685,275 131,873,480 156,097,318
SOYBEANS (TNS) 10,195,879 10,420,130 6,954,980
IRON ORE 35,999,441 35,314,719 31,308,784
FROZEN ORANGE JUICE (TNS) 22,431 48,022 32,102
NON-FROZEN ORANGE JUICE (TNS) 179,491 156,958 132,041
SUGAR RAW (TNS) 1,709,222 1,705,553 2,184,558
Source:
・ US stocks are lower, USD higher, WTI crude lower, and gold lower, at the time this was written.
・ China PMI dropped to 50.8 from 51.0 in June.
・ China Commerce Ministry said China has fully prepared for US threats on escalating trade war, and a pre-requisite for dialogue is equal treatment, keeping promises. China is fully confident to achieve high-quality economic growth target and that the U.S. tactics on China will have no effect. China said yesterday they are ready to retaliate after latest U.S. tariff threat.
・ The US is considering a 25 percent tariff on $200 billion in Chinese imports, higher than the 10 percent previously announced.
・ Jobs report is due out Friday.
Corn.
- Corn is higher on US crop concerns and higher wheat. September corn was unable to close above the 50-day MA. Technically the charts appear slightly bearish.
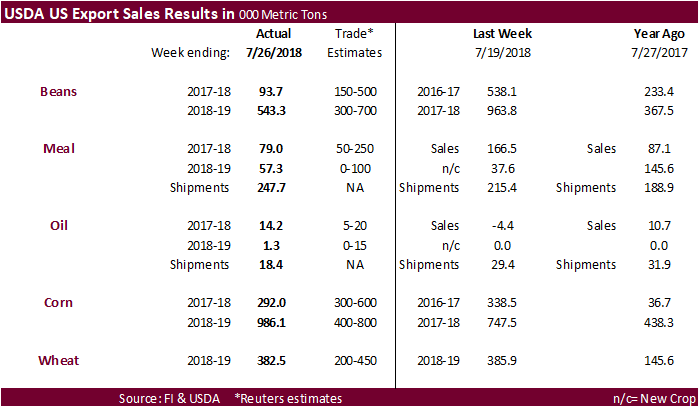
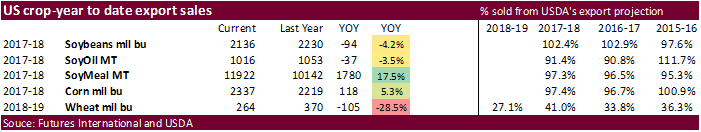
- USDA export sales on a combined crop-year basis were ok.
- Baltic Dry Index fell 4 points to 1,756 or 0.2%.
・ NTL FC Stone estimated the 2018 US corn production at 14.562 billion bushels and yield at 178.1 bushels per acre. USDA is at 14.230 billion bushels and 174.0/bu for the yield.
・ Note Informa is due out on Friday.
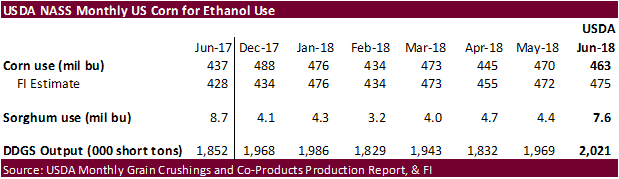
- The USDA US monthly grain grind report showed corn used for ethanol in June totaled 463 million bushels, 13 milling below our working estimate, lower 470 million in May and compares to 437 million in June 2017. Sorghum used for ethanol was 7.6 million, above 4.4 million in May and below 8.7 million in June 2017. DDGS production in June at 2.021 million short tons were highest since August 2017.
- EIA reported a slowdown in weekly US ethanol production and increase in stocks, as expected.
- EIA reported the total listed capacity of (operable) ethanol plants in the United States increased by 5 percent-more than 700 million gallons (about 2.6 billion liters) per year-between January 2017 and January 2018, the U.S. Energy Information Administration reported on Wednesday.
- The USDA Broiler report showed broiler-type eggs set up 1 percent and chicks placed up 2 percent. Cumulative placements from the week ending January 6, 2018 through July 28, 2018 for the United States were 5.52 billion. Cumulative placements were up 2 percent from the same period a year earlier.
- CBOR ethanol registrations were down 7 to 254.
・ China sold 1.102 million tons of corn out of reserves at an average price of 1539 yuan per ton ($225.78/ton), 28 percent of total offered.
・ China plans to offer another 4 million tons of corn from state reserves on Friday.
・ China sold about 58.8 million tons of corn out of reserves this season.
USDA Export Sales Highlights
- Corn: Net sales of 292,000 MT for 2017/2018 were down 14 percent from the previous week and 36 percent from the prior 4-week average. Increases were reported for Japan (126,400 MT, including 96,300 MT switched from unknown destinations and decreases of 31,300 MT), Taiwan (78,600 MT, including 66,000 MT switched from unknown destinations and decreases of 900 MT), South Korea (73,800 MT, including decreases of 3,100 MT), Mexico (53,700 MT, including 26,000 MT switched from unknown destinations and decreases of 34,300 MT), and Colombia (52,300 MT, including 50,000 MT switched from unknown destinations and decreases of 2,100 MT). Reductions were primarily for unknown destinations (144,300 MT). For 2018/2019, net sales of 986,100 MT were reported for unknown destinations (372,500 MT), Mexico (286,100 MT), Japan (106,000 MT), Saudi Arabia (70,000 MT), and South Korea (69,000 MT). Exports of 1,624,600 MT were up 27 percent from the previous week and 18 percent from the prior 4-week average. The destinations were primarily to Japan (405,600 MT), Mexico (349,000 MT), South Korea (281,800 MT), Taiwan (160,800 MT), and Colombia (111,100 MT). Optional Origin Sales: For 2017/2018, options were exercised to export 68,000 MT to South Korea from the United States. The current optional origin outstanding balance of 70,000 MT is for South Korea. For 2018/2019, the current outstanding balance of 463,000 MT is for South Korea (343,000 MT), Saudi Arabia (70,000 MT), and unknown destinations (50,000 MT).
- Barley: No net sales were reported for the week. Exports of 1,400 MT were to Japan.
- Sorghum: Net sales of 100 MT for 2017/2018 resulted as increases for Eritrea (30,000 MT, switched from unknown destinations) and Japan (11,000 MT, including 10,900 MT switched from unknown destinations), were partially offset by reductions for unknown destinations (40,900 MT). Exports of 41,400 MT were to Eritrea (30,000 MT), Japan (11,000 MT), and Mexico (400 MT).
- Beef: Net sales of 16,200 MT for 2018 were up noticeably from the previous week and up 36 percent from the prior 4-week average. Increases were primarily for Japan (6,500 MT, including decreases of 700 MT), Hong Kong (2,700 MT, including decreases of 100 MT), South Korea (2,000 MT, including decreases of 500 MT), Mexico (1,700 MT, including decreases of 100 MT), and Canada (1,200 MT, including decreases of 100 MT). For 2019, net sales of 1,400 MT were reported for Mexico. Exports of 18,800 MT were up 5 percent from the previous and from the prior 4-week average. The primary destinations were Japan (7,200 MT), South Korea (4,900 MT), Mexico (1,800 MT), Taiwan (1,400 MT), and Hong Kong (1,200 MT).
- Pork: Net sales of 35,700 MT for 2018 were up 69 percent from the previous week and up noticeably from the prior 4-week average. Increases were reported for Mexico (16,300 MT), Hong Kong (6,600 MT), Australia (3,500 MT), Japan (3,000 MT), and Canada (2,100 MT). Reductions were reported for Chile (100 MT). For 2019, net sales of 500 MT were reported for South Korea. Exports of 21,200 MT were up 17 percent from the previous week and 12 percent from the prior 4-week average. The primary destinations were Mexico (8,200 MT), Japan (4,200 MT), South Korea (1,900 MT), Canada (1,900 MT), and Chile (1,000 MT).
Soybean complex.
・ Soybeans are coming back after trading sharply lower. High yield estimates for the US were weighing on prices.
・ USDA export sales for old crop fell short of expectations, but a pickup in sales to the EU could justify an offset by large reductions by unknown and China. The unknown sales cancellations could have been rolled into new-crop (+543,300 tons).
・ Product sales showed meal backing off from the previous week and soybean oil improving.
・ NTL FC Stone estimated the 2018 US soybean production at 4.574 billion bushels and yield at 51.5 bushels per acre. USDA is at 4.310 billion bushels and 48.5/bu for the yield.
・ We think the soybean yield is too high issued by FC Stone. Several field reports across IL and IA would beg to differ on the state yields they released of 60 and 59/bu, respectively. If they are correct on their national yield, prices could retest contract lows.
・ Note Informa is due out on Friday.
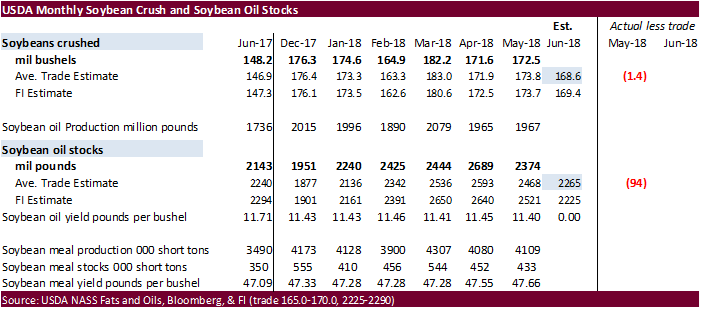
・ USDA reported the June US crush at 169.5 million bushels, 1 million above a Bloomberg average trade guess, below 172.5 in May and above 148.2 million in June 2017. US soybean oil stocks at the end of June were 2.305 billion, 40 million above the average trade guess and down from 2.468 billion last month but well up from 2.143 billion at the end of June 2017.
・ JCI reported China’s soybean crush margins held near the lowest in about a month. (Bloomberg)
・ China September soybean futures -13 yuan per ton or 0.4%
・ China September meal -2 or 0.1%
・ China September soybean oil +12 or 0.2%
・ China September palm +34 or 0.7%
・ September China cash crush margins were last running at 43 cents/bu, compared to 46 previous session, 48 last week and 66 cents a year ago.
・ Rotterdam vegetable oils were mostly unchanged, and SA soybean meal were lower, as of early morning CT time.
・ October Malaysian palm was down to MYR2191, and cash down $5.00 at $568.75/ton.
・ Offshore values were leading soybean oil 9 points higher and meal $0.40/short ton lower.
- South Korea seeks 12,000 tons of non-GMO soybeans in Aug 7 for Nov/Dec arrival.
- USDA seeks 2,160 tons of refined vegetable oil under the PL480 program on August 7 for shipment in September for Zimbabwe.
- Results awaited: Iran seeks 30,000 tons of soybean oil on August 1.
- Iran seeks 30,000 tons of sunflower oil on September 24.
・ China sold 1.054 million tons of soybeans out of reserves so far, this season.
USDA Export Sales Highlights
- Soybeans: Net sales of 93,700 MT for 2017/2018 were down 76 percent from the previous week and 71 percent from the prior 4-week average. Increases were reported for Germany (143,300 MT), Pakistan (68,500 MT, including 65,000 MT switched from unknown destinations), the Netherlands (66,600 MT, including 66,000 MT switched from unknown destinations), South Korea (60,000 MT, including 56,000 MT switched from unknown destinations), and Tunisia (33,000 MT, including 30,000 MT switched from unknown destinations). Reductions were for unknown destinations (316,200 MT) and China (120,000 MT). For 2018/2019, net sales of 543,300 MT were reported for unknown destinations (411,600 MT), Switzerland (60,000 MT), and Japan (30,000 MT). Exports of 856,400 MT were up 26 percent from the previous week and 18 percent from the prior 4-week average. The destinations included Germany (143,300 MT), Taiwan (86,400 MT), Japan (72,100 MT), Mexico (71,600 MT), and Pakistan (68,500 MT). Optional Origin Sales: For 2017/2018, the current optional origin outstanding balance of 66,000 MT is for unknown destinations. For 2018/2019, the current outstanding balance of 63,000 MT is for unknown destinations. Export for Own Account: The current exports for own account outstanding balance is 130,900 MT, all Canada. Export Adjustment: Accumulated exports of soybeans to the Netherlands were adjusted down 143,308 MT for week ending July 19th. The correct destination for this shipment is Germany and is included in this week’s report.
- Soybean Cake and Meal: Net sales of 79,000 MT for 2017/2018 were down 53 percent from the previous week and 32 percent from the prior 4-week average. Increases were reported for Mexico (25,500 MT), Morocco (21,200 MT), the Dominican Republic (8,100 MT), Nicaragua (6,000 MT, including 3,500 MT switched from Honduras, 1,500 MT switched from Costa Rica, and 300 MT switched from El Salvador), and Canada (5,500 MT, including decreases of 3,400 MT). Reductions were reported for Guatemala (6,500 MT), El Salvador (2,100 MT), and Costa Rica (1,800 MT). For 2018/2019, net sales of 57,300 MT were primarily for Mexico (50,900 MT), Honduras (5,000 MT), and Guatemala (1,000 MT). Exports of 247,700 MT were up 15 percent from the previous week and 3 percent from the prior 4-week average. The primary destinations were the Philippines (90,700 MT), Colombia (24,400 MT), Mexico (24,300 MT), the Dominican Republic (19,500 MT), and Panama (17,600 MT).
- Soybean Oil: Net sales of 14,200 MT for 2017/2018 were up noticeably from the previous week, but down 20 percent from the prior 4-week average. Increases were primarily for South Korea (12,300 MT, switched from unknown destinations), Peru (9,200 MT), and Mexico (3,700 MT). For 2018/2019, net sales of 1,300 MT were reported for Mexico. Exports of 18,400 MT were down 37 percent from the previous week and 18 percent from the prior 4-week average. The primary destinations were South Korea (14,000 MT), Colombia (2,200 MT), and Mexico (1,600 MT).
・ EU wheat is screaming higher, lending support to US wheat.
・ USDA all-wheat sales were within expectations and included the usual suspects.
・ December Paris wheat futures was last 5.75 euros higher at 214.00 euros. The contract made another high during the session and on a rolling basis Paris wheat hit over a 4-year high! (May 2014)
・ Egypt is in for wheat. Lowest offer was Russian wheat.
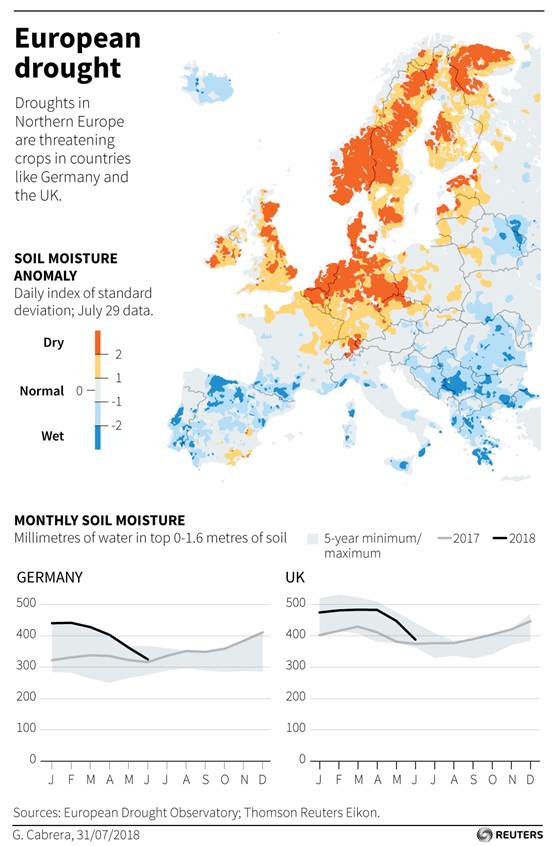
・ Agritel estimated the EU will thresh 136.6 million tons of all-wheat, down 15 million tons compared with 2017. Northern Europe took a hit from drought. If realized the production would be second-lowest crop this decade after 2012.
・ The FAO reported a decrease in the food price index for the month of July to 168.8 from 173.7, or 3.7 percent, largest monthly percentage decrease since December. Dairy was down 6.6% from last month.
・ Russia’s Economic Minister expects grain harvest to total 113-115 million tons in 2018, above 100 million tons by the AgMin. The Economic Minister noted that would be against the 135MMT record last year.
・ Australia’s New South Wales state could see a 3.5 to 4.2-million-ton wheat crop compared with the five-year average of 7.1 million tons, according a collection of polls from Reuters from analysts and traders. Queensland could produce below 1 million tons against 1.2MMT average. Australian wheat production could end up around 20 million tons. Some are lower than that figure.
・ The USDA Attaché estimated 2018-19 Argentina’s wheat production at 19.5 million tons, same as USDA official.
・ The USDA Attaché estimated Kazakhstan’s wheat production at 14 million tons, 0.8MMT below 2017. USDA’s official is at 14 million tons.
・ The USDA Flour Milling report for Q2 showed flour milling at 227 million bushels, down slightly from the first quarter 2018 grind of 227 million bushels but up 1 percent from the second quarter 2017 grind of 224 million bushels. Second quarter 2018 total flour production was 105 million hundredweight, down slightly from the first quarter 2018 but up 1 percent from the second quarter 2017.
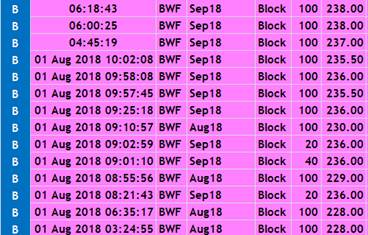
WEDNESDAY/THURSDAY MORNING BLOCKS (via Jumbo)
Export Developments.
・ Egypt seeks wheat for September 11-20 shipment. Lowest offer was $235.50/ton fob Russian.
・ Iraq’s bought about 50,000 tons of Australian wheat at $335 a ton CIF free out. Interesting since US wheat was previously the lowest offered.
・ Results awaited: Algeria seeks at least 50,000 tons of milling wheat on August 1 for October shipment.
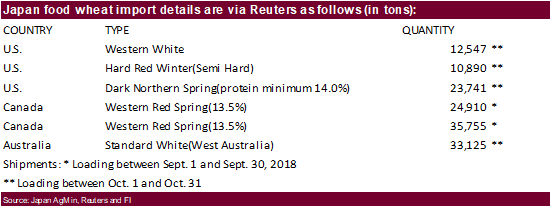
・ Japan bought 140,968 tons of food wheat.
・ China sold 1,800 tons of 2013 imported wheat at auction from state reserves at 2370 yuan/ton ($347.21/ton), 0.10 percent of wheat was offered.
・ Results awaited: Jordan seeks 120,000 tons of hard milling wheat on August 2.
・ Jordan issued an import tender for 120,000 tons of feed barley on August 8.
- Japan in a SBS import tender seeks 120,000 tons of feed wheat and 200,000 tons of barley on August 8 for arrival by January 31.
Rice/Other
・ Iraq seeks 30,000 tons of rice on August 12, open until Aug 16.
USDA Export Sales Highlights
- Wheat: Net sales of 382,500 MT for 2018/2019 were down 1 percent from the previous week, but up 21 percent from the prior 4-week average. Increases were reported for Taiwan (104,900 MT), the Philippines (104,500 MT, including 31,500 MT switched from unknown destinations and decreases of 16,700 MT), Indonesia (70,000 MT), Sri Lanka (60,000 MT), and Mexico (30,700 MT, including decreases of 2,800 MT). Reductions were reported for unknown destinations (32,900 MT) and Algeria (22,800 MT). Exports of 386,600 MT were down 6 percent from the previous week, but up 2 percent from the prior 4-week average. The destinations were primarily to the Philippines (121,300 MT), Thailand (56,400 MT), Nigeria (45,000 MT), Taiwan (44,900 MT), and Mexico (32,900 MT).
- Rice: Net sales of 7,300 MT for 2017/2018 were up 18 percent from the previous week, but down 69 percent from the prior 4-week average. Increases were reported for Canada (3,000 MT), Mexico (1,900 MT), Colombia (700 MT), Turkey (500 MT), and Honduras (300 MT, including decreases of 200 MT). For 2018/2019, net sales of 12,200 MT were reported for Honduras (10,200 MT), El Salvador (1,700 MT), and Liberia (300 MT). Exports of 32,000 MT were up 38 percent from the previous week, but down 4 percent from the prior 4-week average. The destinations were primarily to Mexico (22,400 MT), Honduras (2,800 MT), Canada (2,500 MT), Japan (1,700 MT), and Jordan (900 MT). Export for Own Account: The current exports for own account outstanding balance is 100 MT, all Canada.
- Cotton: Net sales of 19,600 running bales for 2017/2018 were up noticeably from the previous week, but down 49 percent from the prior 4-week average. Increases reported for China (6,500 RB), South Korea (5,000 RB), Taiwan (3,400 RB), Pakistan (2,300 RB, including decreases of 100 RB), and India (1,300 RB, including decreases of 600 RB). For 2018/2019, net sales of 261,200 RB reported for Vietnam (128,500 RB), Pakistan (25,300 RB), South Korea (23,800 RB), Colombia (22,700 RB), and Mexico (16,700 RB), were partially offset by reductions for India (1,600 RB) and China (1,300 RB). Exports of 259,100 RB were down 12 percent from the previous week and 13 percent from the prior 4-week average. The primary destinations were Vietnam (59,500 RB), Indonesia (42,200 RB), Turkey (38,500 RB), China (28,100 RB), and Thailand (15,400 RB). Net sales of Pima totaling 2,600 RB for 2017/2018 were down 56 percent from the previous week, but up 9 percent the prior 4-week average. Increases were reported for Turkey (1,300 RB) and Pakistan (1,000 RB). Reductions were reported for South Korea (300 RB) and Honduras (200 RB). For 2018/2019, net sales of 900 RB were reported for Pakistan (400 RB), India (200 RB), and Italy (200 RB). Exports of 6,200 RB were down 66 percent from the previous week and 59 percent from the prior 4-week average. The primary destinations were India (2,100 RB), China (2,000 RB), Vietnam (1,300 RB). Optional Origin Sales: For 2017/2018, options were exercised to export 100 RB to Indonesia from the United States. The current optional origin outstanding balance is 4,400 RB, all Indonesia. Exports for Own Account: The current exports for own account total of 13,000 RB is for Vietnam (6,300 RB), China (6,200 RB), and Bangladesh (500 RB).
Reuters EU soil moisture map
Terry Reilly
Senior Commodity Analyst C Grain and Oilseeds
Futures International │190 S LaSalle St., Suite 410│Chicago, IL 60603
W: 312.604.1366
AIM: fi_treilly
ICE IM: treilly1
Skype: fi.treilly

Trading of futures, options, swaps and other derivatives is risky and is not suitable for all persons. All of these investment products are leveraged, and you can lose more than your initial deposit. Each investment product is offered only to and from jurisdictions where solicitation and sale are lawful, and in accordance with applicable laws and regulations in such jurisdiction. The information provided here should not be relied upon as a substitute for independent research before making your investment decisions. Futures International, LLC is merely providing this information for your general information and the information does not take into account any particular individual’s investment objectives, financial situation, or needs. All investors should obtain advice based on their unique situation before making any investment decision. The contents of this communication and any attachments are for informational purposes only and under no circumstances should they be construed as an offer to buy or sell, or a solicitation to buy or sell any future, option, swap or other derivative. The sources for the information and any opinions in this communication are believed to be reliable, but Futures International, LLC does not warrant or guarantee the accuracy of such information or opinions. Futures International, LLC and its principals and employees may take positions different from any positions described in this communication. Past results are not necessarily indicative of future results.