From: Terry Reilly
Sent: Thursday, August 16, 2018 9:42:47 AM (UTC-06:00) Central Time (US & Canada)
Subject: FI Morning Grain Comments 08/16/18
PDF attached
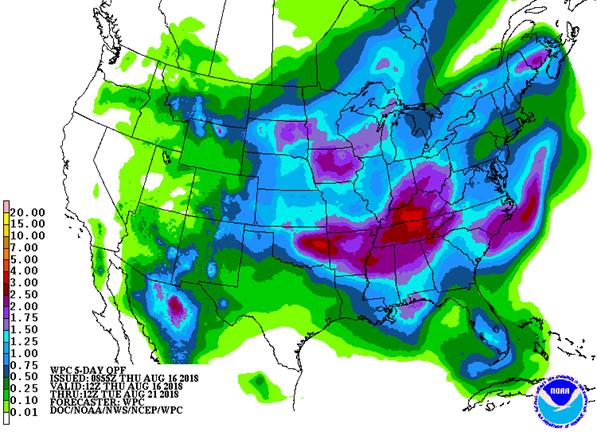
· 6-10 is drier for the Midwest and Delta. 11-15 day is wetter for the northwestern Midwest and northeastern Plains and drier for the southern Delta and west central Plains.
· The upper U.S. Midwest is wetter today in the European and GFS model runs.
· US weather will remain favorable this week into next week with timely rainfall and less threatening temperatures.
· The Northern U.S. Delta and Tennessee River Basin will see good rains.
· West Texas will see rain this weekend.
· Canada’s Prairies will receive scattered showers and thunderstorms during the coming week.
· Argentina will receive rain in the central and east this weekend.
· Western Australia will see limited rain in northern and eastern parts of the production region during the next ten days.
Source: World Weather and FI
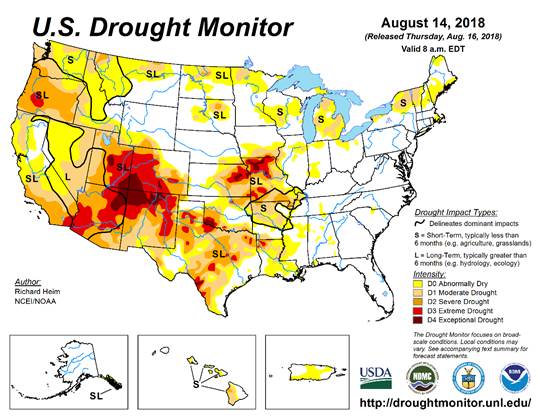
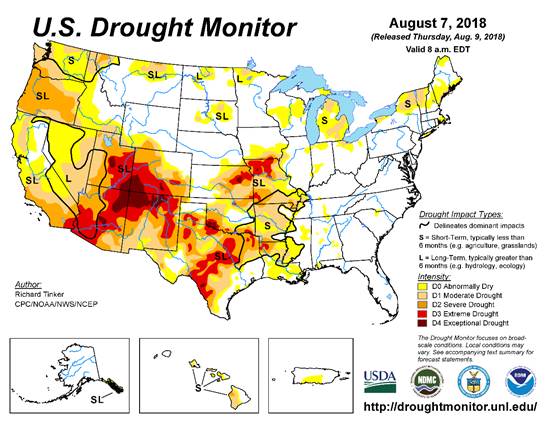
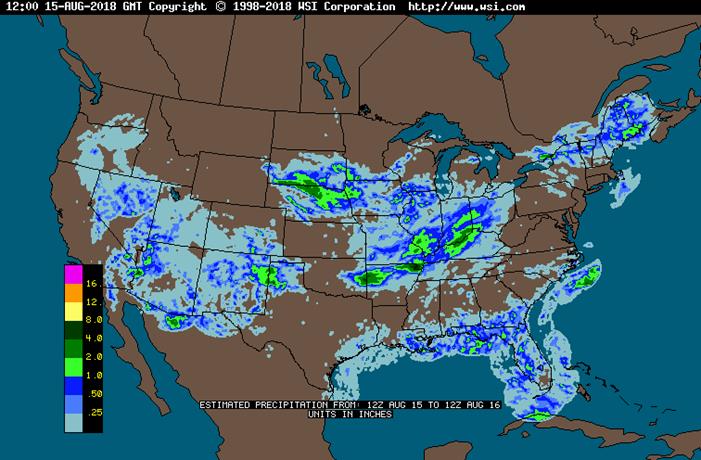
SIGNIFICANT CORN AND SOYBEAN BELT PRECIPITATION EVENTS
WEST CORN BELT EAST CORN BELT
Tdy 60% cvg of up to 0.75”
and local amts to 2.0”;
wettest NE; far NW
driest
Tdy-Fri 90-100% cvg of 0.15-0.90”
and local amts over 2.0”;
west Ky. to south In.
wettest
Fri-Sat 10-15% daily cvg of
up to 0.25” and locally
more each day; wettest
east Friday and wettest
west Saturday
Sat 30% cvg of up to 0.40”
and local amts to 1.10”;
south and east wettest
Sun 10% cvg of up to 0.20”
and locally more
Sun-Mon 80% cvg of up to 0.75”
and local amts over 2.0”;
far NW driest
Mon-Tue 80% cvg of up to 0.75”
and local amts to 1.50”
Tue 10% cvg of up to 0.20”
and locally more
Wed-Aug 23 50% cvg of up to 0.40”
and local amts to 1.0”;
far NW driest
Wed-Aug 24 5-20% daily cvg of up
to 0.25” and locally
more each day
Aug 24-25 45% cvg of up to 0.75”
and locally more;
wettest north
Aug 25-26 50% cvg of up to 0.60”
and locally more
Aug 26-28 65% cvg of up to 0.70”
and locally more
Aug 27-28 70% cvg of up to 0.50”
and locally more
Aug 29-31 5-20% daily cvg of up 10-25% daily cvg of
to 0.25” and locally up to 0.25” and locally
more each day more each day
U.S. DELTA/SOUTHEAST SIGNIFICANT PRECIPITATION EVENTS
DELTA SOUTHEAST
Tdy 25% cvg of up to 0.75”
and locally more;
wettest south
Tdy-Fri 75% cvg of 0.60-1.50”
and local amts to 3.0”
north with up to 0.60”
and locally more in
central and southern
areas
Fri-Sun 85% cvg of 0.35-1.50”
and local amts over 3.0”
from east Ms.to west
Ga. with up to 0.75”
and local amts to 2.0”
elsewhere
Sat-Sun 80% cvg of up to 0.75”
and local amts to 2.75”;
far north and far south
driest
Mon-Tue 75% cvg of up to 0.55”
and local amts to 1.20”
Mon-Wed 80% cvg of up to 0.75”
and local amts to 2.0”
Wed-Aug 24 Up to 20% daily cvg of
up to 0.25” and locally
more each day; some
days may be dry
Aug 23-25 60% cvg of up to 0.75”
and local amts to 1.50”;
driest west
Aug 25-26 60% cvg of up to 0.65”
and local amts to 1.40”;
wettest north
Aug 26-30 15-35% daily cvg of
up to 0.60” and locally
more each day
Aug 27-30 5-20% daily cvg of up
to 0.30” and locally
more each day
Source: World Weather and FI
Bloomberg weekly agenda
- USDA weekly net-export sales for corn, wheat, soy, cotton, 8:30am
- Port of Rouen data on French grain exports
- Buenos Aires Grain Exchange weekly crop report
- Bloomberg weekly survey of analysts’ expectations on grain, sugar prices
FRIDAY, AUG. 17:
- FranceAgriMer weekly updates on French crop conditions
- ICE Futures Europe commitments of traders weekly report on coffee, cocoa, sugar positions, ~1:30pm ET (~6:30pm London)
- CFTC commitments of traders weekly report on positions for various U.S. futures and options, 3:30pm
- EARNINGS: Deere & Co.
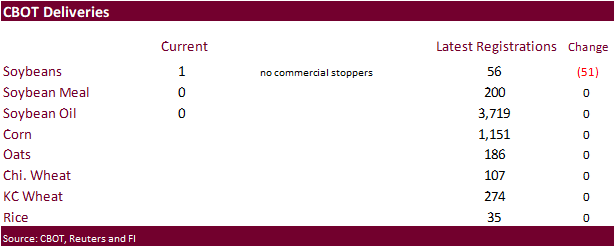
- Soybeans down 51 to 56, Cofco Chicago
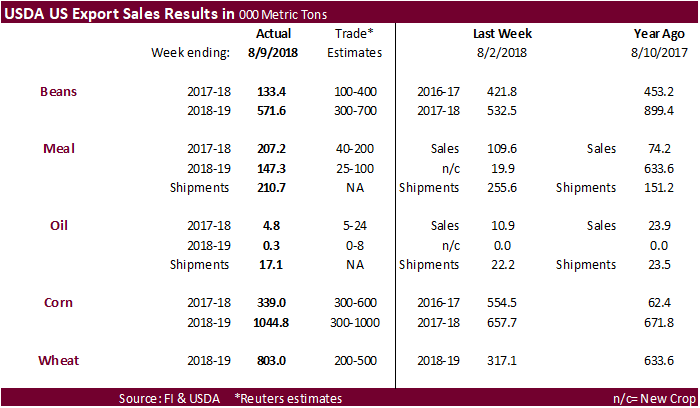
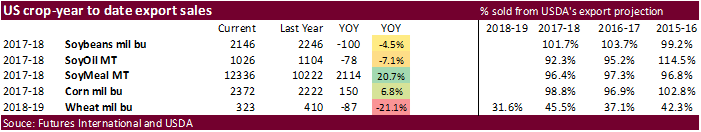
USDA Export Sales were within expectations for soybeans, above for soybean meal, below for soybean oil, within when combining old and new-crop for corn and well above for all-wheat.
· US stocks are higher, USD lower, WTI crude higher, and gold higher, at the time this was written.
· Larry Kudlow Tells Fox China Delegation Coming To US For Talks. US Also Making Progress In Mexico Talks
· US Housing Starts (Jul): 1168K (est 1260K, prevR 1158K)
US Housing Starts (M/M) (Jul): 0.9% (est 7.4%, prevR -12.9%)
· US Building Permits (Jul): 1311K (est 1310K, prevR 1292K)
US Building Permits Change (M/M) (Jul): 1.5% (est 1.4%, prevR -0.7%)
· Philadelphia Fed Manufacturing Survey (Aug): 11.9 (est 22.0, prev 25.7)
· Canada Manufacturing Sales (M/M) (Jun): 1.1 (est 1.0%, prevR 1.5%)
· US Initial Jobless Claims (Aug 11): 212K (est 215K, prevR 214K)
US Continuing Claims (Aug4): 1721K (est 1740K, prevR 1760K)
· Canada June Manufacturing Sales Ex-Autos +0.9 Pct Vs May +2.7 Pct (REVISED From +2.6 Pct)
Canada June Factory New Orders -1.8 Pct Vs May +5.2 Pct (REVISED From +4.9 Pct)
Canada June Unfilled Orders +1.7 Pct; Inventories +0.5 Pct; Inventory-To-Sales Ratio 1.41
· ADP Says Canada Employment Increased 11,600 In July
Corn.
- Corn is higher following soybeans and wheat.
- USDA export sales were within expectations for old-crop corn (339k) and above expectations for new-crop (1.045MMT). Shipments were 1.220 million tons.
- Baltic Dry Index decreased 0.4 percent to 1720 points.
- The US weekly EIA ethanol data was negative for US corn futures, in our opinion. Production decreased 28,000 barrels per day to 1.072 million barrels per day (bbl) and stocks increased 94,000 to 23.017 million.
- Argentina’s BA Grains Exchange put the upcoming corn area at 5.8 million hectares, up from 5.4 million planted in 2017. Rosario is using 6.8 million hectares with output at 45 to 46 million tons.
- China confirmed a second case of African swine fever with pigs that travelled from Heilongjiang to Henan.
- The USDA Turkey Hatchery report showed eggs in Incubators on August 1 Down 4 percent from last year, poults hatched during July up 3 percent from last year. Net poults placed during July up 4 percent from last year.
- USDA’s Broiler Report showed broiler-type eggs set in the United States up 1 percent and chicks placed up slightly. Cumulative placements from the week ending January 6, 2018 through August 11, 2018 for the United States were 5.89 billion. Cumulative placements were up 1 percent from the same period a year earlier.
· China sold 1.53 million tons of corn out of auction at an average price of 1544 yuan per ton, 38.4 percent of wheat was offered.
· China sold about 62.9 million tons of corn out of reserves this season.
· Another 4 million tons will be offered Friday.
Export Sales Highlights
· Corn: Net sales of 339,000 MT for 2017/2018 were down 39 percent from the previous week and 26 percent from the prior 4-week average. Increases were reported for Japan (263,100 MT, including 50,800 MT switched from unknown destinations), Colombia (133,300 MT, including 125,000 MT switched from unknown destinations and decreases of 3,100 MT), Mexico (61,400 MT, including decreases of 14,900 MT), Peru (43,300 MT, including 38,000 MT switched from unknown destinations and decreases of 600 MT), and El Salvador (13,300 MT). Reductions were primarily for unknown destinations (157,700 MT) and Vietnam (60,000 MT). For 2018/2019, net sales of 1,044,800 MT were reported for unknown destinations (320,000 MT), Mexico (298,100 MT), South Korea (126,000 MT), Japan (70,500 MT), and Taiwan (58,600 MT). Exports of 1,220,000 MT were down 15 percent from the previous week and 13 percent from the prior 4-week average. The destinations were primarily to Mexico (463,100 MT), Japan (290,700 MT), Colombia (147,200 MT), Peru (109,700 MT), and Egypt (44,000 MT). Optional Origin Sales: For 2018/2019, new optional origin sales were reported for unknown destinations (244,000 MT) and Malaysia (55,000 MT). Decreases totaling 54,000 MT were reported for unknown destinations. The current outstanding balance of 965,000 MT is for unknown destinations (298,000 MT), South Korea (412,000 MT), Vietnam (130,000 MT), Saudi Arabia (70,000 MT), and Malaysia (55,000 MT).
· Barley: There were no net sales or exports reported during the week.
· Sorghum: Net sales of 30,100 MT for 2017/2018 were for Spain (30,000 MT) and South Korea (100 MT). There were no exports reported during the week.
Soybean complex.
· Trade talk are sending a positive shock wave in commodities. One exception are the US meats.
· The soybean complex is sharply higher because of the renewed low-level meetings between the US and China. Whether this meeting is before or after the August 23 the 16 billion of additional tariffs, the news is supportive.
· USDA reported new-crop soybean sales to Mexico.
· USD is relaxing.
· Supportive NOPA crush was noted. We look for USDA to boost old crop crush by 5-10 million bushels in September.
· USDA export sales for soybeans were on the lower side of a range of expectations but shipments were low at 586,600 tons. Soybean meal sales were good as they topped expectations. Soybean oil export sales were poor.
· US cash prices at the Gulf remain in a weaker state as US river basis soften in part to lack of producer selling.
· Shipping data from Bloomberg and Reuters shows another cargo of US soybeans entered China’s Dalian port.
· China bought at least 5 Argentina soybean cargos in recent days following the government’s move to freeze the gradual reduction in product export taxes.
· China cash margins were last 96 cents/bu on our analysis, compared to 95 previous session, 87 cents late last week, and 94 cents last week.
· China’s soybean complex traded lower. Soybeans were off 1.0%, soybean meal down 0.8%, soybean oil lower by 0.6% and palm fell 0.6%.
· Offshore values were suggesting a higher lead for US soybean meal by $6.10 and higher lead for soybean oil by 40 points.
· October Malaysian palm was higher overnight by 8 ringgits and leading SBO 50 points higher. Cash was $1.25/ton higher.
· Rotterdam meal was mixed and vegetable oils mixed.
· Ukraine started rapeseed plantings for 2019 harvest.
· Private exporters reported to the U.S. Department of Agriculture the following activity:
–Export sales of 154,404 metric tons of soybeans for delivery to Mexico during the 2018/2019 marketing year
- Iran seeks 30,000 tons of sunflower oil on September 24.
Export Sales Highlights
· Soybeans: Net sales of 133,400 MT for 2017/2018 were down 68 percent from the previous week and 52 percent from the prior 4-week average. Increases were reported for Iran (133,500 MT, including 131,000 MT switched from unknown destinations), the Netherlands (108,600 MT, including 95,500 MT switched from unknown destinations), Peru (19,900 MT, switched from unknown destinations and decreases of 100 MT), Colombia (18,200 MT, including 14,000 MT switched from unknown destinations), and Indonesia (18,000 MT, including decreases of 200 MT). Reductions were for unknown destinations (205,500 MT) and China (3,000 MT). For 2018/2019, net sales of 571,600 MT were reported for unknown destinations (373,200 MT), Mexico (102,000 MT), Turkey (30,000 MT), and Canada (20,000 MT). Exports of 586,600 MT were down 42 percent from the previous week and 24 percent from the prior 4-week average. The destinations included Iran (133,500 MT), the Netherlands (108,600 MT), Mexico (98,300 MT), China (63,300 MT), and Argentina (33,000 MT). Optional Origin Sales: For 2017/2018, the current optional origin outstanding balance of 66,000 MT is for unknown destinations. For 2018/2019, the current outstanding balance of 63,000 MT is for unknown destinations. Export for Own Account: The current exports for own account outstanding balance is 130,900 MT, all Canada.
· Soybean Cake and Meal: Net sales of 207,200 MT for 2017/2018 were up 89 percent from the previous week and 71 percent from the prior 4-week average. Increases were reported for Colombia (48,000 MT), the Philippines (47,200 MT), Romania (32,300 MT, including 30,000MT switched from unknown destinations), Morocco (25,700 MT), and Mexico (24,300 MT, including decreases of 100 MT). Reductions were reported for unknown destinations (28,400 MT), El Salvador (2,100 MT), and Costa Rica (2,000 MT). For 2018/2019, net sales of 147,300 MT reported for the Philippines (135,900 MT), Jamaica (6,000 MT), and Canada (5,500 MT), were partially offset by reductions for Mexico (100 MT). Exports of 210,700 MT were down 18 percent from the previous week and 21 percent from the prior 4-week average. The primary destinations were the Philippines (48,300 MT), Romania (32,300 MT), Morocco (31,000 MT), Colombia (25,000 MT), and the Dominican Republic (16,900 MT).
· Soybean Oil: Net sales of 4,800 MT for 2017/2018 were down 56 percent from the previous week and 39 percent from the prior 4-week average. Increases were primarily for Colombia (2,500 MT), Mexico (1,400 MT), and Nicaragua (800 MT). For 2018/2019, net sales of 300 MT were reported for Canada. Exports of 17,100 MT were down 23 percent from the previous week and 25 percent from the prior 4-week average. The primary destinations were the Dominican Republic (13,600 MT) and Mexico (3,000 MT).
· US wheat is sharply higher on technical buying on ongoing weather problems with Australia in focus this morning.
· USDA announced HRW wheat was sold to Iraq.
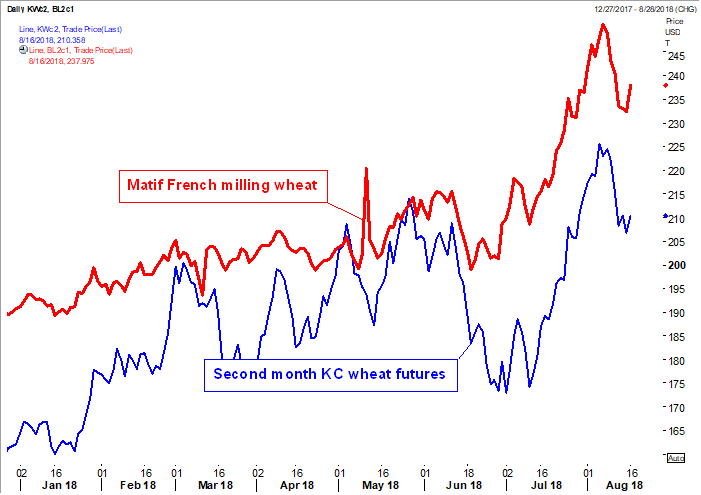
· EU December wheat was 3.75 euros higher at 209.75 euros, at the time this was written.
· Ukraine rapeseed exports were projected by APK-Inform at 2.38 million tons this season, up 12 percent from 2017-18.
· USDA export sales of 803,000 tons were above expectations.
· Egypt wheat reserves are running at about 4 months of consumption.
· Black sea wheat basis SEP settled -1.50 yesterday at 233.00. This marks the 5th consecutive lower close for this market. Look for reversal momentum today (MPI).
· Australia is battling wildfires that are fueled by drought conditions. LT weather forecasts call for below-average rainfall for large parts of Australia until November.
Export Developments.
· Private exporters reported to the U.S. Department of Agriculture the following activity:
–Export sales of 200,000 metric tons of hard red winter wheat for delivery to Iraq during the 2018/2019 marketing year.
· The newswires reported 300,000 tons of wheat was sold to Iraq of NA origin at $324-$334/ton. USDA’s announcement confirm dome of it was US.
· China sold 1,000 tons of imported 2013 wheat out of auction at an average price of 2380 yuan per ton, or $344.40/ton, 0.06 percent of wheat was offered.
· Jordan seeks 120,000 tons of hard milling wheat on Aug 29 for Nov/Dec shipment.
· Jordan seeks 120,000 tons of feed barley on August 28.
- Japan in a SBS import tender seeks 120,000 tons of feed wheat and 200,000 tons of barley on August 22 for arrival by January 31.
Rice/Other
· Iraq bought 60,000 tons of rice. 30,000 tons was thought to be from the United States at around $655 a ton c&f and 30,000 tons from Uruguay at $568.75 a ton c&f free out.
· Egypt’s ESIIC seeks 100,000 tons (150k previously_ of raw sugar on Aug 18 for shipment within the first half of September and two 50,000-ton shipments from September 15-Oct 15.
· Thailand to sell 120k tons of raw sugar on Aug. 22.
Export Sales Highlights
· Wheat: Net sales of 803,000 MT for 2018/2019–a marketing-year high–were up noticeably from the previous week and from the prior 4-week average. Increases were reported for Mexico (247,800 MT, including decreases of 100 MT), the Philippines (177,900 MT, including 60,000 MT switched from unknown destinations), Nigeria (140,000 MT), Japan (60,500 MT, including decreases of 16,000 MT), and Thailand (24,100 MT, including 24,000 MT switched from unknown destinations). Exports of 461,600 MT–a marketing-year high–were up 34 percent from the previous week and 17 percent from the prior 4-week average. The destinations were primarily to Mexico (101,300 MT), Japan (84,100 MT), the Philippines (65,900 MT), South Korea (55,200 MT), and Iraq (52,500 MT).
· Rice: Net sales of 27,600 MT for 2018/2019 were reported for Costa Rica (10,700 MT), Saudi Arabia (5,200 MT), Mexico (3,600 MT), Canada (3,600 MT), and Honduras (3,100 MT). Reductions were reported for Jordan (200 MT) and Panama (100 MT). Exports of 44,200 MT were primarily to Mexico (25,900 MT), El Salvador (5,300 MT), Canada (4,300 MT), Haiti (1,700 MT), and Panama (1,500 MT). Exports for Own Account: The current exports for own account outstanding balance is 100 MT, all Canada.
U.S. EXPORT SALES FOR WEEK ENDING 8/9/2018
|
|
CURRENT MARKETING YEAR |
NEXT MARKETING YEAR |
||||||
|
COMMODITY |
NET SALES |
OUTSTANDING SALES |
WEEKLY EXPORTS |
ACCUMULATED EXPORTS |
NET SALES |
OUTSTANDING SALES |
||
|
CURRENT YEAR |
YEAR |
CURRENT YEAR |
YEAR |
|||||
|
|
THOUSAND METRIC TONS |
|||||||
|
WHEAT |
|
|
|
|
|
|
|
|
|
HRW |
380.7 |
1,166.5 |
1,663.9 |
139.7 |
1,041.1 |
2,402.2 |
0.0 |
0.0 |
|
SRW |
107.6 |
579.3 |
607.7 |
79.6 |
497.3 |
520.6 |
0.0 |
0.0 |
|
HRS |
158.4 |
1,406.2 |
1,415.8 |
99.4 |
1,177.1 |
1,580.2 |
0.0 |
0.0 |
|
WHITE |
142.4 |
1,196.5 |
1,444.3 |
143.0 |
1,060.4 |
1,323.4 |
0.0 |
0.0 |
|
DURUM |
14.0 |
164.8 |
101.9 |
0.0 |
27.7 |
101.3 |
0.0 |
0.0 |
|
TOTAL |
803.0 |
4,513.2 |
5,233.6 |
461.6 |
3,803.6 |
5,927.6 |
0.0 |
0.0 |
|
BARLEY |
0.0 |
37.9 |
29.9 |
0.0 |
11.2 |
6.4 |
0.0 |
0.0 |
|
CORN |
339.0 |
6,849.3 |
3,482.5 |
1,220.0 |
53,411.1 |
52,990.7 |
1,044.8 |
8,858.5 |
|
SORGHUM |
30.1 |
149.4 |
227.6 |
0.0 |
4,927.3 |
4,621.4 |
0.0 |
0.0 |
|
SOYBEANS |
133.4 |
4,717.7 |
5,107.7 |
586.6 |
53,970.8 |
56,012.4 |
571.6 |
11,477.6 |
|
SOY MEAL |
207.2 |
1,692.7 |
1,310.9 |
210.7 |
10,546.0 |
8,911.4 |
147.3 |
846.2 |
|
SOY OIL |
4.8 |
133.3 |
84.5 |
17.1 |
898.5 |
1,019.8 |
0.3 |
39.4 |
|
RICE |
|
|
|
|
|
|
|
|
|
L G RGH |
16.1 |
157.1 |
190.1 |
31.4 |
31.4 |
24.1 |
0.0 |
0.0 |
|
M S RGH |
0.0 |
0.0 |
10.4 |
0.0 |
0.0 |
0.0 |
0.0 |
0.0 |
|
L G BRN |
1.1 |
1.9 |
1.1 |
0.7 |
0.7 |
0.1 |
0.0 |
0.0 |
|
M&S BR |
0.1 |
0.3 |
4.1 |
0.1 |
0.1 |
0.1 |
0.0 |
0.0 |
|
L G MLD |
8.7 |
85.9 |
177.7 |
8.6 |
10.9 |
22.3 |
0.0 |
0.0 |
|
M S MLD |
1.5 |
49.1 |
43.5 |
3.4 |
29.5 |
8.0 |
0.0 |
0.0 |
|
TOTAL |
27.6 |
294.3 |
426.9 |
44.2 |
72.7 |
54.6 |
0.0 |
0.0 |
|
COTTON |
|
THOUSAND RUNNING BALES |
||||||
|
UPLAND |
77.7 |
8,039.4 |
5,815.3 |
240.3 |
283.4 |
314.3 |
-11.7 |
1,316.3 |
|
PIMA |
2.8 |
219.5 |
185.4 |
4.6 |
10.2 |
9.3 |
0.0 |
24.9 |
Terry Reilly
Senior Commodity Analyst – Grain and Oilseeds
Futures International │190 S LaSalle St., Suite 410│Chicago, IL 60603
W: 312.604.1366
AIM: fi_treilly
ICE IM: treilly1
Skype: fi.treilly

Trading of futures, options, swaps and other derivatives is risky and is not suitable for all persons. All of these investment products are leveraged, and you can lose more than your initial deposit. Each investment product is offered only to and from jurisdictions where solicitation and sale are lawful, and in accordance with applicable laws and regulations in such jurisdiction. The information provided here should not be relied upon as a substitute for independent research before making your investment decisions. Futures International, LLC is merely providing this information for your general information and the information does not take into account any particular individual’s investment objectives, financial situation, or needs. All investors should obtain advice based on their unique situation before making any investment decision. The contents of this communication and any attachments are for informational purposes only and under no circumstances should they be construed as an offer to buy or sell, or a solicitation to buy or sell any future, option, swap or other derivative. The sources for the information and any opinions in this communication are believed to be reliable, but Futures International, LLC does not warrant or guarantee the accuracy of such information or opinions. Futures International, LLC and its principals and employees may take positions different from any positions described in this communication. Past results are not necessarily indicative of future results.