From: Terry Reilly
Sent: Tuesday, August 21, 2018 8:00:03 AM (UTC-06:00) Central Time (US & Canada)
Subject: FI Morning Grain Comments 08/21/18
PDF attached
· 6-10 day is slightly wetter for the central Midwest and temperature are unchanged.
· 11-15 day is drier for the west central Plains and temperatures are unchanged.
· Favorable rain fell across the heart of the Midwest including the dry areas of MO, IL, and IN. Too much rain fell across parts of the WCB. Hail damage was noted across patches of NE.
· The ECB will see rain mid-week. Rain returns to the US northwestern areas Friday and Saturday.
· The Delta will see drier weather through Saturday.
· US spring wheat will see minor harvesting delays for the balance of the week.
· A ridge of high pressure may evolve across the southeastern states, Delta, Corn Belt, and eastern Hard Red Winter Wheat Region Aug. 28 – Sep. 4.
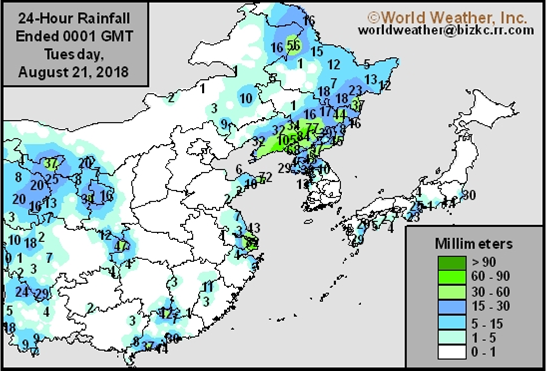
· Eastern China will see net drying through at least August 29.
· Canada’s Prairies will remain on the dry side this week.
· Indonesia and Malaysia rainfall are slowing and some attribute the below normal rainfall to El Nino.
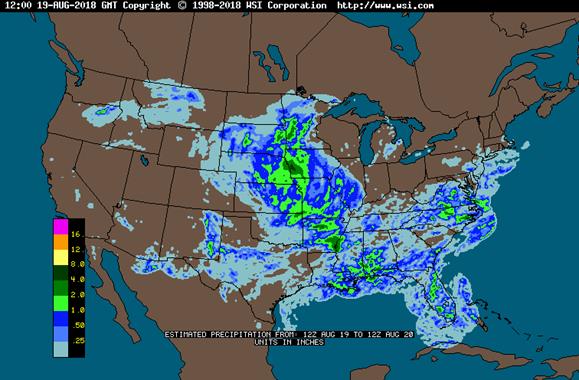
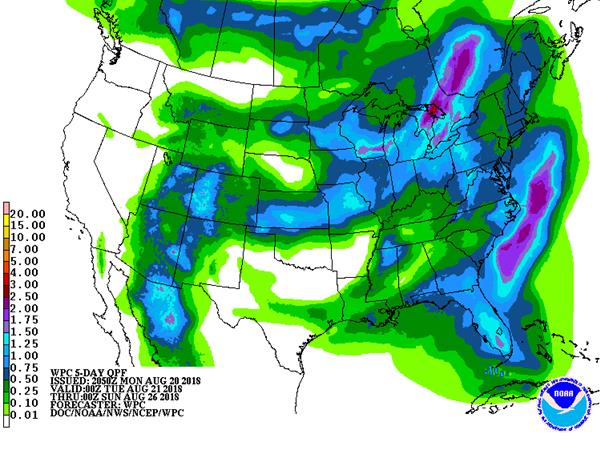
SIGNIFICANT CORN AND SOYBEAN BELT PRECIPITATION EVENTS
WEST CORN BELT EAST CORN BELT
-Tue 90% cvg of up to 0.75”
and local amts over 1.75”;
driest west
Tue 15% cvg of up to 0.20”
and locally more;
wettest NE
Wed Mostly dry with a few
insignificant showers
Wed-Thu 5-20% daily cvg of up
to 0.25” and locally
more each day
Thu-Fri 75% cvg of up to 0.75”
and local amts to 1.75”;
north and far south
wettest
Fri-Sat 50% cvg of up to 0.50”
and local amts to 1.10”;
driest south
Sat-Sun 45% cvg of up to 0.75”
and local amts to 1.50”;
driest SW
Sun-Aug 28 75% cvg of up to 0.75”
and local amts to 1.50”;
driest south
Aug 27-28 30% cvg of up to 0.65”
and locally more;
wettest north
Aug 29 15% cvg of up to 0.25”
and locally more
Aug 29-31 65% cvg of up to 0.75”
and local amts to 1.50”
Aug 30-Sep 1 60% cvg of up to 0.60”
and locally more
Sep 1-3 10-25% daily cvg of
up to 0.30” and locally
more each day
Sep 2-3 10-25% daily cvg of
up to 0.30” and locally
more each day
U.S. DELTA/SOUTHEAST SIGNIFICANT PRECIPITATION EVENTS
DELTA SOUTHEAST
-Tue 80% cvg of up to 0.75”
and local amts to 2.0”;
driest SE
Tue-Sun Up to 20% daily cvg of
up to 0.25” and locally
more each day; some
days may be dry
Wed-Thu 5-20% daily cvg of up
to 0.30” and locally
more each day
Fri-Sun 15-35% daily cvg of
up to 0.70” and locally
more each day; west
and south wettest
Aug 27-30 10-25% daily cvg of 10-25% daily cvg of
up to 0.30” and locally up to 0.35” and locally
more each day more each day
Aug 31-Sep 3 5-20% daily cvg of up 10-25% daily cvg of
to 0.30” and locally up to 0.35” and locally
more each day more each day
Source: World Weather and FI
Bloomberg weekly agenda
- Egypt on Eid Al-Adha holiday
- Brazilian agency Conab’s 2nd estimate for 2018-19 sugarcane crop
- New Zealand dairy auction on Global Dairy Trade online market starts ~7am ET (~noon London, ~11pm Wellington)
- ProFarmer U.S. crop tour, Day 2
WEDNESDAY, AUG. 22:
- India, Singapore, Malaysia, Indonesia, Egypt on holiday
- Agritel presser on French wheat harvest 2018 season, 3am ET (9am Paris)
- DBV outlook on German crop outlook
- ProFarmer U.S. crop tour, Day 3
- EIA U.S. weekly ethanol inventories, output, 10:30am
- USDA cold-storage report for July, 3pm
THURSDAY, AUG. 23:
- China’s General Administration of Customs releases July agricultural commodity trade data (final), including imports of palm oil, wheat, cotton and corn, 2:30am ET (2:30pm Beijing)
- Intl Grains Council’s monthly market forecasts, 8:30am ET (1:30pm London)
- USDA weekly net-export sales for corn, wheat, soy, cotton, 8:30am
- USDA red meat production for July, 3pm
- Brazilian research foundation Fundecitrus releases report on greening incidence on oranges; Brazil is top producer, exporter
- Port of Rouen data on French grain exports
- Buenos Aires Grain Exchange weekly crop report
- Bloomberg weekly survey of analysts’ expectations on grain, sugar prices
- ProFarmer U.S. crop tour, Day 4
- U.S. is set to impose 25% tariffs on additional $16b in Chinese imports; China said it will retaliate
- EARNINGS: Sanderson Farms, Hormel Foods
FRIDAY, AUG. 24:
- ProFarmer issues final yield estimates after crop tour, 2pm
- USDA cattle-on-feed report for July, 3pm
- Unica bi-weekly report on Brazil Center-South sugar output
- Salvadoran coffee council’s El Salvador July export data
- Nicaragua’s coffee council releases July export data
- FranceAgriMer weekly updates on French crop conditions
- ICE Futures Europe commitments of traders weekly report on coffee, cocoa, sugar positions, ~1:30pm ET (~6:30pm London)
- CFTC commitments of traders weekly report on positions for various U.S. futures and options, 3:30pm
- No changes
· US stocks are higher, USD lower, WTI crude higher, and gold higher, at the time this was written.
· Philadelphia Fed Non-Manufacturing Regional Business Activity Index 41.7 In Aug Vs 44.3 In July
– Philadelphia Fed Non-Manufacturing Firm-Level Business Activity Index 41.1 In Aug Vs 35.5 In July
– Philadelphia Fed Non-Manufacturing New Orders Index 29.0 In Aug Vs 31.5 In July
– Philadelphia Fed Non-Manufacturing Full-Time Employment Index 32.2 In Aug Vs 29.5 In July
– Philadelphia Fed Wage And Benefit Cost Index 46.4 In Aug Vs 47.5 In July
· Canada Wholesale Trade Sales (M/M) Jun: -0.8% (est 0.7% ; prevR 0.9% ; prev 1.2%)
Corn.
- Corn is lower following wheat. Losses maybe limited today if Day 2 tour projections show less favorable corn conditions across IN.
- Heavy hail damage occurred across parts of NE, northwest of Omaha.
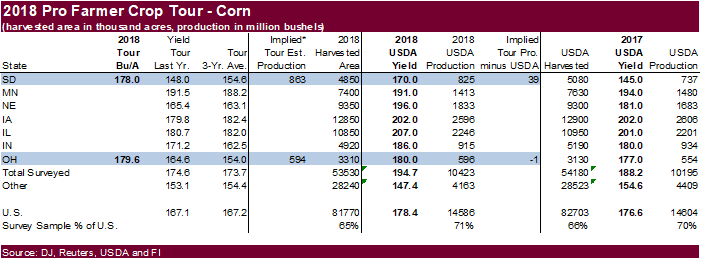
- Day one of the US ProFarmer Crop Tour showed South Dakota corn yields up from a year ago and above average. SD was pegged at 178.0 bu/ac, up from 148.0 in 2017 and average of 154.6 bu/ac. Ohio were projected sharply higher than a year ago at 179.6 bushels per acre, above 164.6 for 2017 and average of 154.0 bu/ac.
- Final crop tour results will be out Friday, August 24.
- Soybean and Corn Advisory left their US corn yield unchanged at 178.0. USDA is at 178.4.
- Baltic Dry Index increased 9 points or 0.5 percent to 1736 points.
- China pig producer Dabeinong Technology reported a loss for the April-June period, its first quarterly loss since 2013. They mentioned higher feed costs, including soybean meal.
- USDA US corn export inspections as of August 16, 2018 were 1,096,647 tons, within a range of trade expectations, below 1,262,283 tons previous week and compares to 720,213 tons year ago. Major countries included Japan for 413,751 tons, Mexico for 265,547 tons, and Colombia for 111,167 tons.
· China sold about 63.7 million tons of corn out of reserves this season. Another 4 million tons will be offered late this week.
FI update on US yield.
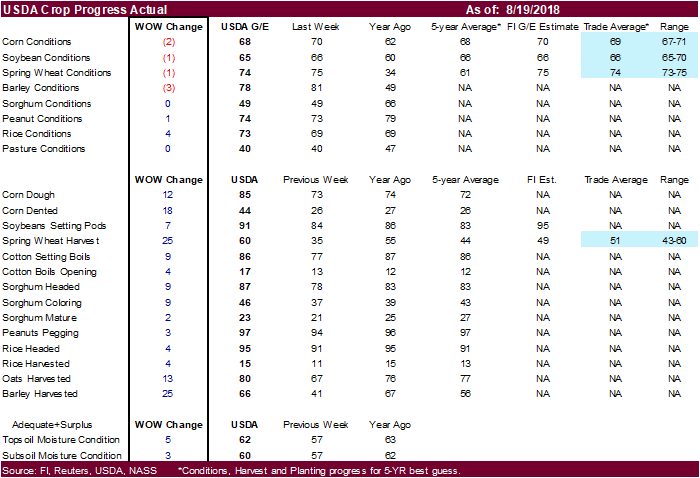
- G/E corn conditions fell two points to 68 percent, one more point than what the expected. G/E are down three consecutive weeks. On our FI weighted rating, they are down 4 consecutive weeks and lowest level since the start of 2018 weekly condition ratings.
- IL and IN were unchanged, IA down 2. Missouri improved 2.
- Based on the latest FI adjust corn crop rating of 82.3, down from 82.6 last week and 83.2 at the end of July, we estimate the yield at 175.5 bushels per acre, 1.0 bushel below the previous week and 2.9 bushels below USDA. Production is projected 82 million bushels below the previous week at 14.355 million bushels, 231 below USDA and 249 million below 2017.


Soybean complex.
· Soybeans and meal are lower on light selling ahead of potential surprise announcements later this week. Traders will be cautious ahead of the US China talks scheduled to start Wednesday (Aug 22-23).
· President Trump told Reuters he does not expect much out of the trade talks this week and there was “no time frame” for ending the dispute. Another round of U.S. tariffs on $16 billion of Chinese goods kick in at 12:01 a.m. (0401 GMT) on Thursday.
· Technicals suggest support in soybeans around $8.86/bu.
· Soybean oil is higher on unwinding of meal/oil spreads despite a lower lead in palm.
- Brazil soybean exports during the August 13-19 period increased to 2.2MMT from 1.3MMT a year ago, bringing cumulative Aug 1-19 shipments to about 4.9MMT. It was projected Brazil Aug soybean exports could reach 8MMT from 5.95MMT year ago, with China taking 80-90 percent of that amount. China may be only be able to source 5.5-8.0 million tons of additional Brazil soybeans during the Sep-Dec period. If that is the case, China will fall short on Q4 soybean imports and will need to buy from the US through at least mid-February.
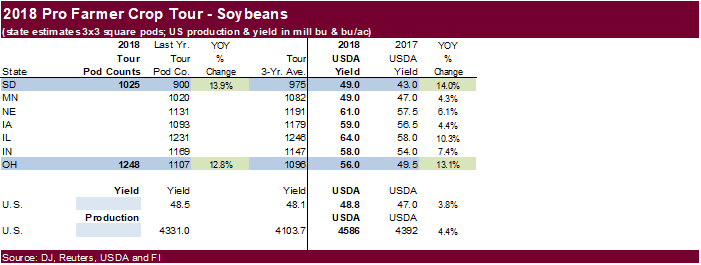
- Day one of the US ProFarmer Crop Tour showed South Dakota soybean pods in a 3-by-3 foot area averaged 1,024.7, above 900.0 pods a year ago and the three-year average of 975.1 pods. Pods in Ohio averaged 1,248.2 pods, up from 1,107.0 pods in 2017 and the three-year average of 1,095.8.
- Final results will be out Friday, August 24. Follow the Pro Farmer Midwest Crop Tour here on Twitter #pftour18
- Soybean and Corn Advisory increased their US soybean yield by 0.5 bu/ac to 51.5. USDA is at 51.6.
- India’s SEA expects China to increase rapeseed meal imports by a large amount in 2018-19 of about 400,000 tons. India alone exported 663,998 tons of rapeseed meal to neighboring countries in 2017-18. SEA noted Indian rapeseed prices are around $210 per ton free-on-board (FOB) basis, nearly $40 per ton cheaper than cargoes from other suppliers. India rapeseed meal export so far in 2018-19 are running at nearly 400,000 tons.
· China and Malaysia met and agreed to improve trade relations, including China importing a larger amount of palm oil from Malaysia.
· October Malaysian palm was lower overnight by 14 ringgits and leading SBO 46 points lower. Cash was $2.50/ton lower.
· Rotterdam oils were unchanged to lower and SA soybean meal when imported into Rotterdam $2.50-$8.00/short ton lower.
· China cash margins were last 89 cents/bu on our analysis, unchanged from the previous session, compared to 97 cents late last week, and 96 cents last year.
· Soybean meal demand in China is thought to slow. A recent report by CITIC estimates hogs may drop to 650 million heads by the end of 2018 from 706 million heads at the end of 2017.
· Offshore values were suggesting a lower lead for US soybean meal by $1.70 and lower lead for soybean oil by 26 points.
- USDA US soybean export inspections as of August 16, 2018 were 639,001 tons, within a range of trade expectations, above 581,314 tons previous week and compares to 668,710 tons year ago. Major countries included Indonesia for 103,739 tons, Egypt for 57,444 tons, and Mexico for 34,448 tons.
- Iran seeks 30,000 tons of sunflower oil on September 24.
FI update on US yield.
- G/E soybean conditions fell one point to 65 percent, same as what the trade expected. G/E are down three consecutive weeks. On our FI weighted rating, they are down 4 consecutive weeks and lowest level since the start of 2018 weekly condition ratings.
- IL was unchanged, IA down 2 and IN up 2.
- Based on the latest FI adjust soybean crop rating of 81.6, down from 81.7 last week and 82.5 at the end of July, we estimate the yield at 50.0 bushels per acre, 0.1 below the previous week and 1.6 bushel below USDA. Production is projected 9 million below the previous week and 149 million bushels below USDA at 4.437 billion, 45 million above 2017.

· Wheat futures are lower on follow through selling after a brief rally last week. Nearby Chicago appears to be headed to test its 100-day MA of nearly $5.20.
· EU December wheat was 3.50 euros lower at 208.25 euros, at the time this was written.
· Russia said there was no reason to introduce a wheat export cap, or duty.
· Russia’s AgMin increased 2018 grain production to 100-105 million tons from previous 100 million tons.
· Farm adviser CRM Agri-Commodities noted Australian wheat prospects improved after recent rains, according to Bloomberg.
- Egypt is on holiday.
- USDA US all-wheat export inspections as of August 16, 2018 were 345,375 tons, within a range of trade expectations, below 487,399 tons previous week and compares to 592,678 tons year ago. Major countries included Japan for 120,982 tons, Chile for 52,225 tons, and Nigeria for 38,002 tons.
Export Developments.
· China sold 2,000 tons of 2013 imported wheat at 2,370 yuan per ton ($344.78/ton), 0.12 percent of what was offered.
· Japan seeks 167,787 tons of food wheat.
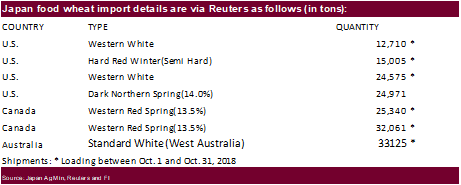
- Japan in a SBS import tender seeks 120,000 tons of feed wheat and 200,000 tons of barley on August 22 for arrival by January 31.
· Jordan seeks 120,000 tons of feed barley on August 28.
· Jordan seeks 120,000 tons of hard milling wheat on Aug 29 for Nov/Dec shipment.
Rice/Other
· China sold 250,881 tons of rice at 2,410 yuan per ton ($350.60/ton), 17 percent of what was offered.
· Results awaited: Egypt’s ESIIC seeks 100,000 tons (150k previously) of raw sugar for shipment within the first half of September and two 50,000-ton shipments from September 15-Oct 15.
· Thailand plans to sell 120k tons of raw sugar on Aug. 22.
US Spring wheat update
· USDA combined G/E SW rating declined one point to 74 percent from the previous week, in part to a sharp decline in ID (-7), MN (-4) and MT (-4). SW ratings are down 4 out of the past 5 weeks.
· Using our FI weighted index, SW ratings are running at 82.9, down from 83.4 last week and lowest for 2018 since June 10.
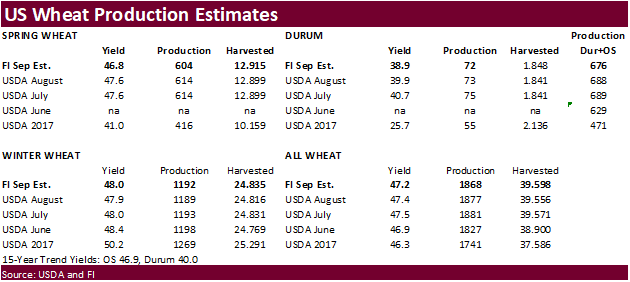
· We estimate USDA September other spring wheat yield at 46.8, down from 47.6 in August and compares to 41.0 last year.
· We estimate USDA September durum wheat yield at 38.9, down from 39.9 in August and compares to 25.7 last year.
Terry Reilly
Senior Commodity Analyst – Grain and Oilseeds
Futures International │190 S LaSalle St., Suite 410│Chicago, IL 60603
W: 312.604.1366
AIM: fi_treilly
ICE IM: treilly1
Skype: fi.treilly

Trading of futures, options, swaps and other derivatives is risky and is not suitable for all persons. All of these investment products are leveraged, and you can lose more than your initial deposit. Each investment product is offered only to and from jurisdictions where solicitation and sale are lawful, and in accordance with applicable laws and regulations in such jurisdiction. The information provided here should not be relied upon as a substitute for independent research before making your investment decisions. Futures International, LLC is merely providing this information for your general information and the information does not take into account any particular individual’s investment objectives, financial situation, or needs. All investors should obtain advice based on their unique situation before making any investment decision. The contents of this communication and any attachments are for informational purposes only and under no circumstances should they be construed as an offer to buy or sell, or a solicitation to buy or sell any future, option, swap or other derivative. The sources for the information and any opinions in this communication are believed to be reliable, but Futures International, LLC does not warrant or guarantee the accuracy of such information or opinions. Futures International, LLC and its principals and employees may take positions different from any positions described in this communication. Past results are not necessarily indicative of future results.

