From: Terry Reilly
Sent: Thursday, August 23, 2018 6:45:57 AM (UTC-06:00) Central Time (US & Canada)
Subject: FI Morning Grain Comments 08/23/18
PDF attached is pre-USDA export sales report.
USDA export sales will be sent later this morning due to a commitment at time of release.
Weather and crop conditions
· 6-10 day for the US is wetter for the southern Midwest and northern Delta while temperatures are slightly cooler.
· 11-15 day is drier for the northwestern Midwest and northern Plains. But temperatures are unchanged.
· A ridge of high pressure may evolve across the southeastern states, Delta, Corn Belt, and eastern Hard Red Winter Wheat Region Aug. 30 – Sep. 6 (two days later than what was predicted Monday).
· The second week of the weather outlook calls for cool temperatures across the US Corn Belt but that could change depending on ridge development.
· Before then, look for rain across the US northwestern Midwest areas Friday and Saturday.
· The Delta will see drier weather through Saturday.
· US spring wheat will see minor harvesting delays for the balance of the week.
· HRW wheat country will see showers on and off through early next week.
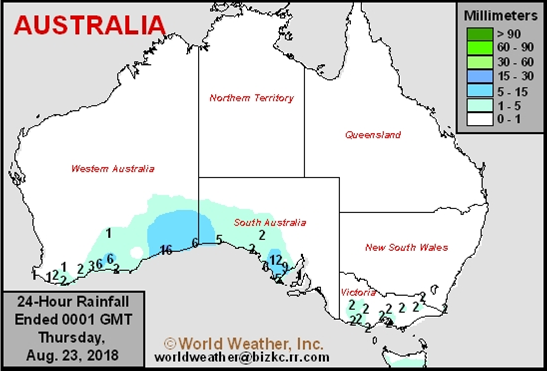
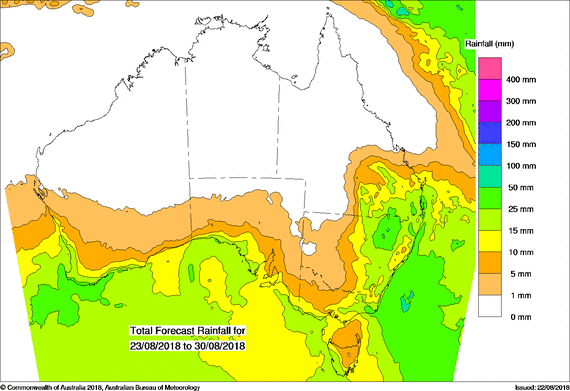
· Eastern Australia’s rainfall potential for late this week remains very good.
· Eastern China will see net drying through at least August 29.
· Canada’s Prairies will remain on the dry side this week.
· Indonesia and Malaysia rainfall are slowing and some attribute the below normal rainfall to El Nino.
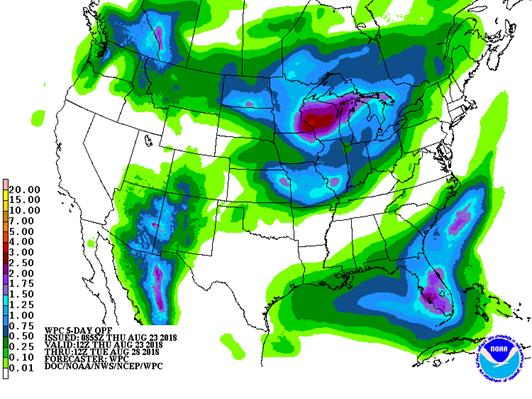
SIGNIFICANT CORN AND SOYBEAN BELT PRECIPITATION EVENTS
WEST CORN BELT EAST CORN BELT
Thu-Fri 80% cvg of up to 0.75”
and local amts over 2.0”;
wettest south; west-
central areas driest
Thu-Sat 80% cvg of up to 0.65”
and local amts to 1.50”;
driest south; wettest
west
Sat-Sun 50% cvg of up to 0.75”
and local amts to 1.50”;
driest south
Sun-Tue 20-40% daily cvg of
up to 0.35” and locally
more each day;
driest SW
Mon-Aug 29 60% cvg of up to 0.75”
and local amts to 1.75”;
west-central areas
driest
Aug 29-30 75% cvg of up to 0.65”
and local amts to 1.50”
Aug 30 20% cvg of up to 0.65”
and local amts to 1.50”;
wettest south
Aug 31 20% cvg of up to 0.40”
and locally more;
wettest south
Aug 31-Sep 1 50% cvg of up to 0.35”
and local amts to 0.75”
Sep 1-2 40% cvg of up to 0.30”
and locally more
Sep 2-5 Up to 20% daily cvg of
up to 0.25” and locally
more each day
Sep 3-5 Up to 20% daily cvg of
up to 0.25” and locally
more each day
U.S. DELTA/SOUTHEAST SIGNIFICANT PRECIPITATION EVENTS
DELTA SOUTHEAST
Tdy-Thu 5-20% daily cvg of up
to 0.30” and locally
more each day
Tdy-Sun Mostly dry with a few
insignificant showers
Fri-Mon 15-35% daily cvg of
up to 0.70” and locally
more each day; west
and south wettest
Mon-Aug 29 Up to 20% daily cvg of
up to 0.25” and locally
more each day; some
days may be dry
Tue-Aug 30 10-25% daily cvg of
up to 0.35” and locally
more each day
Aug 30-Sep 1 10-25% daily cvg of
up to 0.35” and locally
more each day
Aug 31-Sep 2 75% cvg of up to 0.75”
and local amts to 1.75”
Sep 2-5 Up to 20% daily cvg of
up to 0.30” and locally
more each day
Sep 3-5 15-35% daily cvg of
up to 0.50” and locally
more each day
Source: World Weather and FI
Source: World Weather Inc.
Bloomberg weekly agenda
- China’s General Administration of Customs releases July agricultural commodity trade data (final), including imports of palm oil, wheat, cotton and corn, 2:30am ET (2:30pm Beijing)
- Intl Grains Council’s monthly market forecasts, 8:30am ET (1:30pm London)
- USDA weekly net-export sales for corn, wheat, soy, cotton, 8:30am
- USDA red meat production for July, 3pm
- Brazilian research foundation Fundecitrus releases report on greening incidence on oranges; Brazil is top producer, exporter
- Port of Rouen data on French grain exports
- Buenos Aires Grain Exchange weekly crop report
- Bloomberg weekly survey of analysts’ expectations on grain, sugar prices
- ProFarmer U.S. crop tour, Day 4
- U.S. is set to impose 25% tariffs on additional $16b in Chinese imports; China said it will retaliate
- EARNINGS: Sanderson Farms, Hormel Foods
FRIDAY, AUG. 24:
- ProFarmer issues final yield estimates after crop tour, 2pm
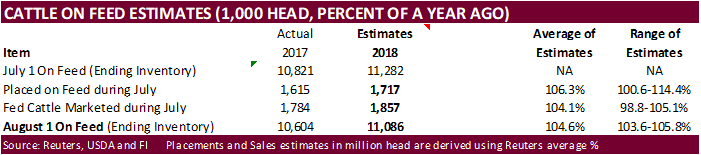
- USDA cattle-on-feed report for July, 3pm
- Unica bi-weekly report on Brazil Center-South sugar output
- Salvadoran coffee council’s El Salvador July export data
- Nicaragua’s coffee council releases July export data
- FranceAgriMer weekly updates on French crop conditions
- ICE Futures Europe commitments of traders weekly report on coffee, cocoa, sugar positions, ~1:30pm ET (~6:30pm London)
- CFTC commitments of traders weekly report on positions for various U.S. futures and options, 3:30pm
- No changes
· US stocks are lower, USD higher, WTI crude lower, and gold lower, at the time this was written.
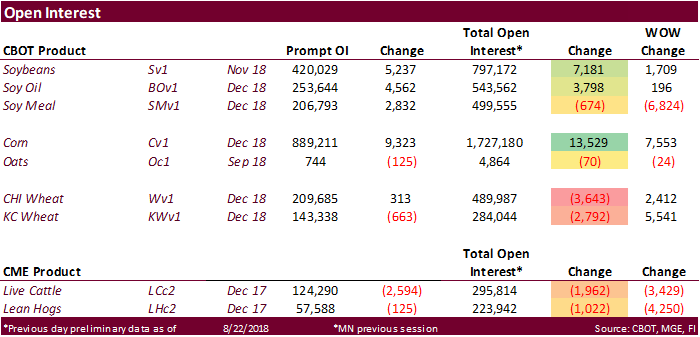
Corn.
- Corn was near unchanged pre-USDA export sales report. Soybeans and wheat were lower as of 6:30 am CT.
- Day three of the US crop tour was viewed slightly friendly for corn futures.
- China’s central government is getting behind ethanol use by promoting the product in 15 districts this year. Details were lacking but it may mean additional funding to build or expand ethanol plants. China corn futures rallied on the news, but also traded higher after trade data showed a large decline in China corn imports.
- China January corn was up 13 yuan or 0.7%.
- China imported 330,000 tons of corn in July, down 63.7 percent from last year.
- China imported 220,000 tons of sorghum in July, down 62.5 percent from 588,364 tons a year ago and off down 450,000 tons in June.
- China’s pork imports in July were at 88,163 tones.
- China reported a 4th case of African swine fever, affecting more than 1300 pigs in Wenzhou, Zhejiang province. This is the fourth known case and is also the fourth province, meaning its spreading. Total cull count is about 21k.
· Ethanol production increased 1,000 barrels per day to 1.073 million barrels per day (bbl) and stocks increased 242,000 to 23.259 million. A Bloomberg poll called for US ethanol production to increase 12,000 million/day and stocks to decrease 229,000 barrels.
- The USDA Broiler Report showed broiler-type eggs set in the united states up slightly and chicks placed up slightly from a year ago. Cumulative placements from the week ending January 6, 2018 through August 18, 2018 for the united states were 6.07 billion. Cumulative placements were up 1 percent from the same period a year earlier.
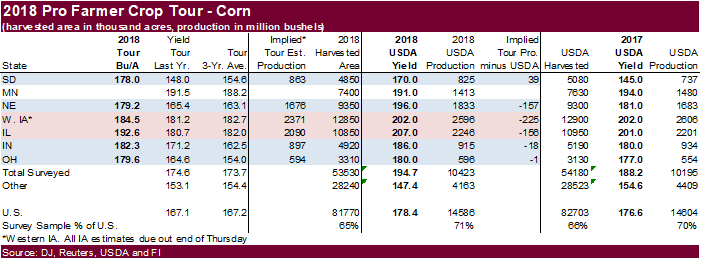
US crop tour
- Day three of the crop tour was viewed slightly friendly for corn futures. Western IA corn yields from 3 districts came in above last year and a three-year average but the 2018 average for the three districts of 184.5 bu/ac falls below USDA’s all-IA corn yield of 202.0 bu/ac. Corn yields varied across the western area of IA as weather had a negative impact on some areas. IL corn yield was estimated at 192.6 bu/ac, above last year and tour average, but it falls below USDA’s 207 bu/ac and 201.0 bu/ac in 2017.
- Day two of the US ProFarmer Crop Tour showed corn yields up from a year ago and above average. NE was pegged at 179.2 bu/ac, up from 165.4 in 2017 and average of 163.1 bu/ac. IN was projected sharply higher than a year ago at 179.6 bushels per acre, above 164.6 for 2017 and average of 154.0 bu/ac.
- Day one of the US ProFarmer Crop Tour showed South Dakota corn yields up from a year ago and above average. SD was pegged at 178.0 bu/ac, up from 148.0 in 2017 and average of 154.6 bu/ac. Ohio were projected sharply higher than a year ago at 179.6 bushels per acre, above 164.6 for 2017 and average of 154.0 bu/ac.
· China sold 2.095MMT of corn out of reserves at 1,548 yuan per ton ($225.20/ton), 52.6 percent of what was offered.
· Another 2 million tons will be offered on Friday.
· China sold about 64.8 million tons of corn out of reserves this season.
Soybean complex.
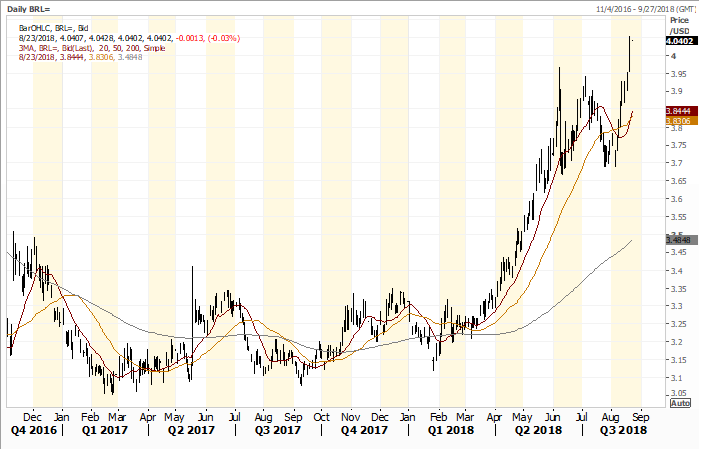
· The soybean complex is lower on large US crop prospects, early but light harvest pressure and sharply weaker barge and Gulf basis. African swine fever spread to a fourth province in China. At least 21k hogs have been culled.
· The Brazilian real hit its lowest level against the USD since February 2016.
· Reuters noted US soybean barges loaded in August were bid at about 16 cents over SX8, down 9 cents from Tuesday.
· Malaysia is back from holiday and November palm futures fell to a 1-week low.
· November Malaysian palm fell 23MYR to 2218, and leading SBO 17 points higher. Cash was off $6.25/ton or 1.1%.
· Rotterdam oils were lower and SA soybean meal when imported into Rotterdam $2.00-$5.00/short ton lower.
· China cash margins were last 88 cents/bu on our analysis, down 1 cent from the previous session, compared to 97 cents late last week, and 96 cents last year.
· Offshore values were suggesting a higher lead for US soybean meal by $0.60 and slightly higher lead for soybean oil by 1 point.
· The USDA on Friday may unveil its $12 billion producer, stockpiling, and agriculture chain assistance program.
US crop tour
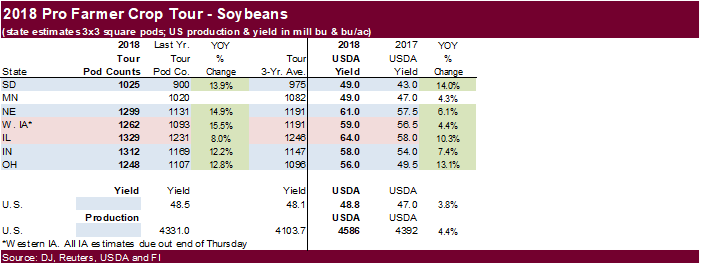
· Day three of the crop tour shows western IA pod counts are very good as they average 15.5% higher than last year. USDA looks for all Iowa soybean yield to increase 4.4%. Eastern IA will be survey today/Thursday. IL pod counts are up 8% from last year while USDA predicts a 10.3% rise in the soybean yield for the state.
- Day two of the US ProFarmer Crop Tour showed IN soybean pods in a 3-by-3 foot area averaged 1,312, above 1169 pods a year ago and the three-year average of 1147 pods. Pods in NE averaged 1,299 pods, up from 1131 pods in 2017 and the three-year average of 1191. See our table below
- Day one of the US ProFarmer Crop Tour showed South Dakota soybean pods in a 3-by-3 foot area averaged 1,024.7, above 900.0 pods a year ago and the three-year average of 975.1 pods. Pods in Ohio averaged 1,248.2 pods, up from 1,107.0 pods in 2017 and the three-year average of 1,095.8.
- Final results will be out Friday, August 24. Follow the Pro Farmer Midwest Crop Tour here on Twitter #pftour18
- None reported.
- China sold nearly 1.3MMT of soybeans out of reserves this season.
- Iran seeks 30,000 tons of sunflower oil on September 24.
· Before the release of the USDA export sales report, Chicago and KC wheat were lower and MN wheat was higher.
· EU December wheat was 1.25 euros lower at 205.50 euros, at the time this was written.
· The EU granted wheat imports under quota of 26,000 tons.
· SovEcon projected a 6-year low in end of 2018-19 (June 2019) Russia grain stocks to 10.1MMT after they lowered grain production to 109.6MMT from 113.9MMT previously.
· Russia may see a short to medium-term boost in wheat exports after the currency hit its lowest level since April 2016 and wheat prices from other major exporters appreciated in recent months. SovEcon warned of strengthening domestic Russia wheat prices in the months ahead.
· Kazakhstan’s AgMin put grain output at over 20 million tons – gross weight. 2017 Kazakhstan grain production was 21.9 million tons in bunker weight. Bunker weights – grain that has not been cleaned.
- China imported 600,000 tons of barley in July, down 16.2 percent from a year earlier.
- China’s wheat imports in July were down 43 percent from a year ago to 140,000 tons.
- Argentina has seen drought conditions creep back with 15 percent of the wheat area affected. One group said that could expand to 30 percent by early September.
Export Developments.
· China sold 7,887 tons of 2013 imported wheat at 2,293 yuan per ton ($333.58/ton), 0.49 percent of what was offered.
· China sold 456 tons of 2012 wheat at 2,190 yuan per ton, 0.43 percent of what was offered.
· Tunisia seeks 50,000 tons of soft milling wheat and 50,000 tons of feed barley on Thursday for shipment around October.
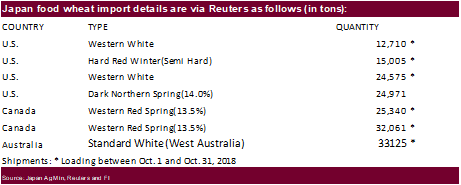
· Japan bought 167,787 tons of food wheat. Original details as follows.
· Jordan seeks 120,000 tons of feed barley on August 28.
· Jordan seeks 120,000 tons of hard milling wheat on Aug 29 for Nov/Dec shipment.
- Japan in a SBS import tender seeks 120,000 tons of feed wheat and 200,000 tons of barley on August 29 for arrival by January 31.
Rice/Other
- Flooding in India’s Kerala and Karnataka may lower the coffee crop by 20 percent this season.
- China sugar imports in July increased more than 300 percent to 250,000 tons.
· Drones offer high-tech help to Japan’s ageing farmers https://af.reuters.com/article/commoditiesNews/idAFL3N1VC3ID
· Results awaited: Egypt’s ESIIC seeks 100,000 tons (150k previously) of raw sugar for shipment within the first half of September and two 50,000-ton shipments from September 15-Oct 15.
· Results awaited: Thailand plans to sell 120k tons of raw sugar on Aug. 22.
Terry Reilly
Senior Commodity Analyst – Grain and Oilseeds
Futures International │190 S LaSalle St., Suite 410│Chicago, IL 60603
W: 312.604.1366
AIM: fi_treilly
ICE IM: treilly1

Trading of futures, options, swaps and other derivatives is risky and is not suitable for all persons. All of these investment products are leveraged, and you can lose more than your initial deposit. Each investment product is offered only to and from jurisdictions where solicitation and sale are lawful, and in accordance with applicable laws and regulations in such jurisdiction. The information provided here should not be relied upon as a substitute for independent research before making your investment decisions. Futures International, LLC is merely providing this information for your general information and the information does not take into account any particular individual’s investment objectives, financial situation, or needs. All investors should obtain advice based on their unique situation before making any investment decision. The contents of this communication and any attachments are for informational purposes only and under no circumstances should they be construed as an offer to buy or sell, or a solicitation to buy or sell any future, option, swap or other derivative. The sources for the information and any opinions in this communication are believed to be reliable, but Futures International, LLC does not warrant or guarantee the accuracy of such information or opinions. Futures International, LLC and its principals and employees may take positions different from any positions described in this communication. Past results are not necessarily indicative of future results.