From: Terry Reilly
Sent: Thursday, August 30, 2018 8:17:44 AM (UTC-06:00) Central Time (US & Canada)
Subject: FI Morning Grain Comments 08/30/18
PDF attached
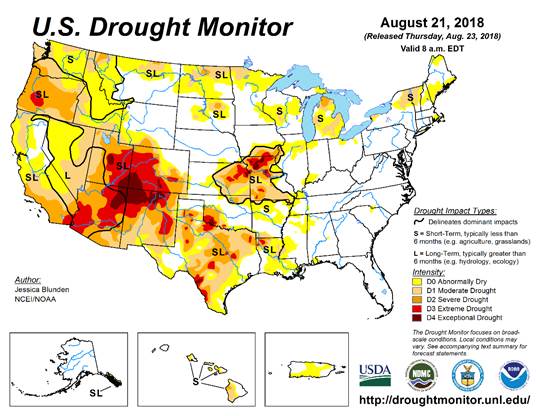
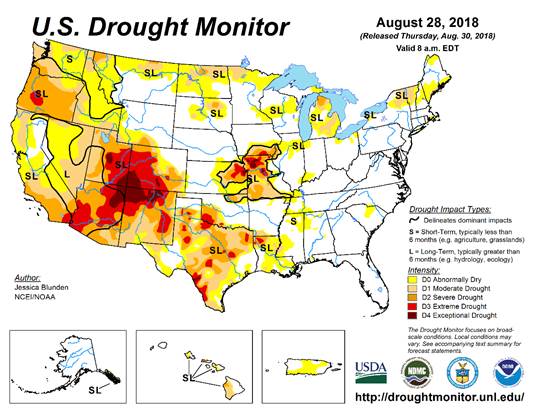
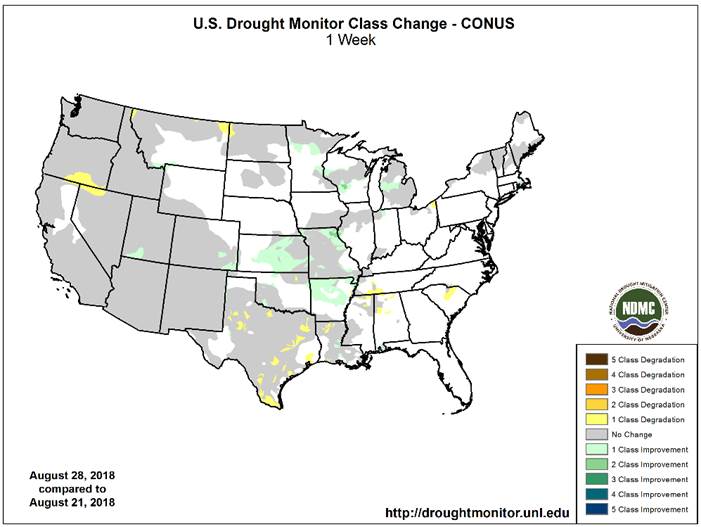
· US drought conditions abated last week in northeastern MO and central WI.
· 6-10 day is wetter for the southeastern Plains and 11-15 day is drier for the eastern Midwest, Delta, and southern Great Plains.
· Not much follow up rain is expected in Western Australia this weekend or next week. New South Wales and southeastern Queensland will get rain Thursday into Friday with a few showers early next week.
· Dry conditions are raising planting and establishment concerns for central and eastern Ukraine into the middle and lower Volga River Basin, Kazakhstan and Russia’s Southern Region.
· Northern Missouri and the northwest half of Illinois into Minnesota, Wisconsin and Michigan all saw rain into Wednesday.
· Rain this week will slow crop maturation rates and delay some early harvesting. Next week flooding is possible in parts of Iowa, northern Missouri, Minnesota and Wisconsin.
· A mix of rain and sunshine is expected across the Delta and southeastern states through September 7.
· Canada’s Prairies will remain dry from southeastern Alberta through central and southern Saskatchewan through September 7.
· Northern and western Europe weather will see below normal precipitation through early September.
· Argentina will receive rain through Friday.
Source: World Weather and FI
SIGNIFICANT CORN AND SOYBEAN BELT PRECIPITATION EVENTS
WEST CORN BELT EAST CORN BELT
Thu 15% cvg of up to 0.20”
and local amts to 0.40”;
wettest SE
Thu-Fri 75% cvg of up to 0.75”
and local amts to 1.50”
with some 1.50-4.0”
amts in the south; far
NW driest; south Ia.
wettest
Fri-Sat 80% cvg of up to 0.60”
and local amts to 1.20”
with some 1.20-3.50”
amts in the west
Sat-Sun 60% cvg of up to 0.75”
and local amts to 1.50”
with some 1.50-3.0”
amts in the south
Sun-Mon 60% cvg of up to 0.55”
and local amts to 1.20”
Mon-Tue 75% cvg of up to 0.75”
and local amts to 1.75”
Tue-Sep 6 60% cvg of up to 0.60”
and local amts to 1.30”;
driest south
Sep 5-6 70% cvg of up to 0.65”
and local amts to 1.40”
Sep 7 15% cvg of up to 0.25”
and locally more
Sep 7-9 80% cvg of up to 0.75”
and local amts to 1.50”
Sep 8-10 80% cvg of up to 0.65”
and local amts to 1.30”
Sep 10-12 10-25% daily cvg of
up to 0.30” and locally
more each day
Sep 11-12 10-25% daily cvg of
up to 0.30” and locally
more each day
U.S. DELTA/SOUTHEAST SIGNIFICANT PRECIPITATION EVENTS
DELTA SOUTHEAST
-Thu 90% cvg of up to 0.75”
and local amts to 1.50”;
wettest north
Tdy-Fri 60% cvg of up to 0.75”
and local amts to 2.0”;
Carolinas and Va.
driest
Fri-Sun 5-20% daily cvg of up
to 0.30” and locally
more each day
Sat-Tue 15-30% daily cvg of
up to 0.40” and locally
more each day
Mon-Tue 55% cvg of up to 0.75”
and local amts to 1.50”;
wettest south
Sep 5-8 5-20% daily cvg of up 5-20% daily cvg of up
0.30” and locally up to 0.35” and locally
more each day more each day
Sep 9-12 5-20% daily cvg of up 15-35% daily cvg of
up to 0.30” and locally up to 0.50” and locally
more each day more each day
Source: World Weather and FI
THURSDAY, AUG. 30:
- USDA weekly net-export sales for corn, wheat, soy, cotton, 8:30am
- Port of Rouen data on French grain exports
- Buenos Aires Grain Exchange weekly crop report
- Bloomberg weekly survey of analysts’ expectations on grain, sugar prices
FRIDAY, AUG. 31:
- Malaysia on holiday; No palm oil futures trading on Bursa Malaysia Derivatives
- Statistics Canada’s domestic crop production report for July, 8:30am ET
- FranceAgriMer weekly updates on French crop conditions
- ICE Futures Europe commitments of traders weekly report on coffee, cocoa, sugar positions, ~1:30pm ET (~6:30pm London)
- CFTC commitments of traders weekly report on positions for various U.S. futures and options, 3:30pm
StatsCan production survey via Bloomberg
================================================================
|——–Survey Results———|StatsCan|
Production: | Avg | Low | High | 2017| YOY%
================================================================
All-Wheat | 30.418| 29.315| 31.100| 29.984| 1.4%
Durum Wheat | 6.028| 5.400| 7.400| 4.962| 21.5%
Canola | 20.723| 20.444| 21.270| 21.313| -2.8%
Barley | 8.289| 7.911| 8.600| 7.891| 5.0%
Soybeans | 7.120| 6.900| 7.260| 7.717| -7.7%
Oats | 3.378| 3.310| 3.450| 3.724| -9.3%
Source: Bloomberg and FI
· Neutral soybeans and wheat
· Negative corn
· Supportive soybean products led by meal
· US stocks are lower, USD higher, WTI crude higher, and gold mixed, at the time this was written.
· US Personal Income Jul: 0.3% (est 0.4%; prev 0.4%)
– Personal Spending Jul: 0.4% (est 0.4%; prev 0.4%)
– Real Personal Spending Jul: 0.2% (est 0.2%; prev 0.3%)
– PCE Deflator (M/M) Jul: 0.1% (est 0.1%; prev 0.1%)
– PCE Deflator (Y/Y) Jul: 2.3% (est 2.3%; prev 2.2%)
– PCE Core (M/M) Jul: 0.2% (est 0.2%; prev 0.1%)
– PCE Core (Y/Y) Jul: 2.0% (est 2.0%; prev 1.9%)
· US Initial Jobless Claims (W/W) 25-Aug: 213K (est 212K; prev 210K)
– Continuing Claims (W/W) 18-Aug: 1708K (est 1725K; prev R 1728K)
· Canadian Quarterly GDP Annualized Q2: 2.9% (est 3.1%; prev R 1.4%)
– GDP (M/M) Jun: 0.0% (est 0.1%; prev 0.5%)
– GDP (Y/Y) Jun: 2.4% (est 2.3%; prev R 2.7%)
Corn.
- Corn is higher but a poor USDA export sales figure could create a two-sided trade.
- Under the 24-hour announcement system, USDA reported 100,611 tons of corn to Mexico for the 2018-19 marketing year.
- Baltic Dry Index fell 2.8 percent to 1,614 points.
- Canada said by Friday they could reach a trade deal agreement with the US.
- Argentina’s 7% devaluation against the USD yesterday could have provided some support to the Brazil real from spreading. The real is weaker today. USD slightly higher.
- Looking for a seasonal trade this year because of early harvest? Consider weekly options.
- 7:30 am: The CH 380-430 call spread is right around 10-cents this morning giving a hefty 28 delta long. Long vol at 17.6%, short at 20.2%. The CN19 400 call is right around 7-cents giving a 20 delta buying vol at 19.53% versus ATM sitting at 16.6%. If you want to look at a closer strike, consider the CN 400-500 call spread for around 14.50-cents giving a 33 delta and a +3.8% vol call skew. (MPI)
· A fifth confirmed case of African swine fever hit 185 pigs on a farm in Wuhu city in eastern China’s Anhui province. Look for at least 459 hogs to be culled.
- The USDA Broiler Reports showed eggs set in the US up slightly from a year ago and broiler-type chicks placed in the US up 1 percent. Cumulative placements from the week ending January 6, 2018 through August 25, 2018 for the United States were 6.26 billion. Cumulative placements were up 1 percent from the same period a year earlier.
- An atypical case of mad cow disease was found in a 6-year-old beef cow in Florida. No threat was seen.
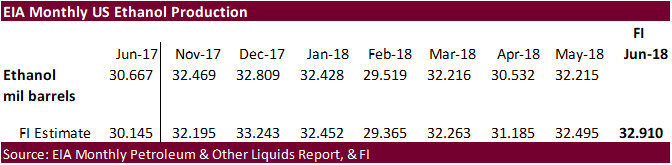
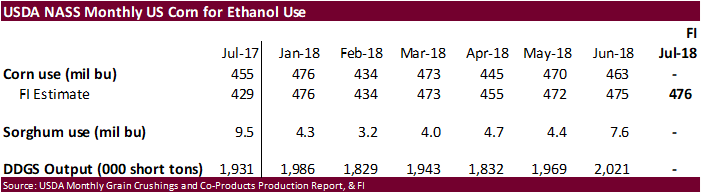
- US ethanol production decreased 3,000 barrels per day to 1.07 million and stocks fell 198,000 to 23.06 million (first stocks decrease since July 20). Traders were looking for a 1,000 barrel/day increase in production and 44,000-barrel decrease in stocks.
USDA Export Sales Text
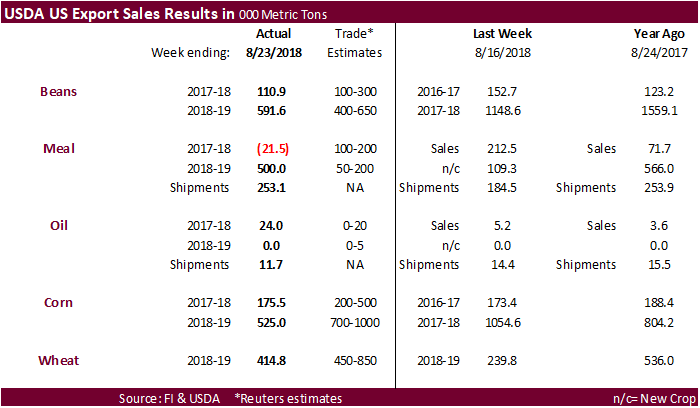
· Corn: Net sales of 175,400 MT for 2017/2018 were up 1 percent from the previous week, but down 46 percent from the prior 4-week average. Increases were reported for Japan (103,600 MT, including 58,500 MT switched from unknown destinations and decreases of 22,700 MT), Mexico (96,400 MT, including decreases of 6,900 MT), Taiwan (78,500 MT, including decreases 2,100 MT), Egypt (75,700 MT, including 25,000 MT switched from unknown destinations), and Saudi Arabia (73,600 MT, including 70,000 MT switched from unknown destinations). Reductions were primarily for unknown destinations (331,400 MT) and Panama (35,000 MT). For 2018/2019, net sales of 525,000 MT reported for Mexico (136,400 MT), unknown destinations (114,500 MT), and Panama (98,300 MT), were partially offset by reductions for Taiwan (1,200 MT). Exports of 1,344,400 MT were up 2 percent from the previous week, but down 3 percent from the prior 4-week average. The destinations were primarily to Japan (436,800 MT), Mexico (232,600 MT), Taiwan (155,600 MT), Peru (143,900 MT), and South Korea (129,200 MT). Optional Origin Sales: For 2018/2019, the current outstanding balance of 965,000 MT is for South Korea (412,000 MT), unknown destinations (298,000 MT), Vietnam (130,000 MT), Saudi Arabia (70,000 MT), and Malaysia (55,000 MT). Export Adjustments: Accumulated exports of corn to Japan were adjusted down 67,868 MT for week ending August 9th. The correct destination for this shipment was Taiwan and is included in this week’s report. Accumulated exports of corn to Mexico were adjusted down 8 MT for the week ending July 26th. This shipment was canceled.
· Barley: Net sales of 500 MT for 2018/2019 were for Taiwan. Exports of 400 MT were to Japan (300 MT) and South Korea (100 MT).
· Sorghum: Net sales of 500 MT for 2017/2018 resulted as increases for Spain (59,100 MT, including 60,000 MT switched from unknown destinations and decreases of 1,400 MT), Burma (1,200 MT), and Mexico (200 MT), were partially offset by reductions for unknown destinations (60,000 MT). For 2018/2019, net sales of 30,000 MT were reported for unknown destinations. Exports of 90,800 MT were primarily to Spain (89,100 MT) and China (1,100 MT).
· Hides and Skins: Net sales of 408,000 pieces reported for 2018 were up 5 percent from the previous week, but down 26 percent from the prior 4-week average. Whole cattle hide sales totaling 408,700 pieces were primarily for China (238,300 pieces, including decreases of 21,900 pieces), South Korea (85,400 pieces, including decreases of 6,600 pieces), Mexico (38,200 pieces, including decreases of 7,400 pieces), Indonesia (16,200 pieces, including decreases of 200 pieces), and Brazil (13,800 pieces, including decreases of 700 pieces). Exports of 537,400 pieces reported for 2018 were up 29 percent from the previous week and 30 percent from the prior 4-week average. Whole cattle hide exports of 528,800 pieces were primarily to China (284,600 pieces), South Korea (92,500 pieces), Thailand (71,500 pieces), Mexico (43,500 pieces), and Brazil (7,300 pieces). Net sales of 137,700 wet blues for 2018 were up noticeably from the previous week and up 40 percent from the prior 4-week average. Increases were reported for China (60,500 unsplit), Mexico (34,700 grain splits and 23,700 unsplit), Thailand (12,000 unsplit), and Vietnam (3,700 unsplit). Reductions were reported for India (2,000 unsplit), Brazil (1,800 grain splits), Italy (100 grain splits), and the Dominican Republic (100 unsplit). For 2019, net sales of 77,200 unsplit were reported for Italy. Exports of 150,000 wet blues for 2018 were up 31 percent from the previous week, but down 5 percent from the prior 4-week average. The primary destinations were China (56,500 unsplit), Italy (35,300 unsplit and 4,800 grain splits), and Mexico (9,900 grain splits and 9,300 unsplit). Net sales reductions of splits totaling 50,200 pounds for 2018 resulted as increases for China (1,200 pounds), were more than offset by reductions for Vietnam (50,200 pounds) and Taiwan (1,200 pounds). Exports of 768,800 pounds were up 56 percent from the previous week and 42 percent from the prior 4-week average. The destinations were Vietnam (688,800 pounds) and South Korea (80,000 pounds).
· Beef: Net sales of 20,600 MT for 2018 were unchanged from the previous week, but up 13 percent from the prior 4-week average. Increases were primarily for Japan (8,900 MT, including decreases of 1,100 MT), South Korea (3,900 MT, including decreases of 400 MT), Hong Kong (2,600 MT, including decreases of 300 MT), Canada (1,500 MT, including decreases of 100 MT), and Mexico (1,300 MT, including decreases of 300 MT). For 2019, net sales of 700 MT were primarily for Japan. Exports of 17,800 MT were up 5 percent from the previous week, but unchanged from the prior 4-week average. The primary destinations were Japan (6,100 MT), South Korea (4,900 MT), Mexico (1,700 MT), Hong Kong (1,500 MT), and Taiwan (1,200 MT).
· Pork: Net sales of 29,100 MT for 2018 were up 9 percent from the previous week and 2 percent from the prior 4-week average. Increases were reported for Mexico (12,500 MT), South Korea (5,800 MT), Japan (3,500 MT), Colombia (2,200 MT), and Canada (1,500 MT). Reductions were reported for China (300 MT). Exports of 22,100 MT were up 6 percent from the previous week and 17 percent from the prior 4-week average. The primary destinations were Mexico (8,500 MT), Japan (3,600 MT), Canada (2,000 MT), South Korea (1,900 MT), and Hong Kong (1,500 MT).
- Under the 24-hour announcement system, USDA reported 100,611 tons of corn to Mexico for the 2018-19 marketing year.
· China sold 2.615 million tons corn at 1,557 yuan per ton ($227.79/ton), 66 percent of what was offered.
· Another 4 million tons of China corn reserves will be offered Friday. China sold about 68.0 million tons of corn out of reserves this season.
Soybean complex.
· The soybean complex is higher on short covering.
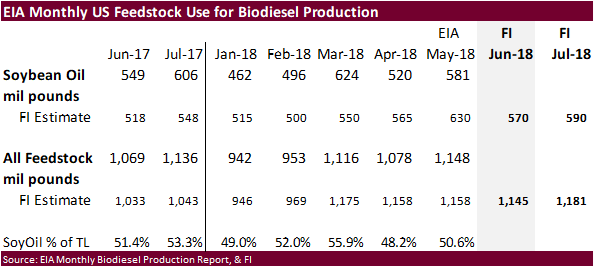
· USDA export sales were ok for soybeans and very supportive for soybean meal and great for oil.
· US drought conditions abated last week in northeastern MO and central WI.
· The Brazil real is weaker.
· Brazil’s Supreme Court delayed their decision on the minimum freight rates, at least until after the Brazilian Presidential election in November.
· Yesterday a worker strike started at a Bunge crush plant in Argentina. But they went back to work about an hour later. We are hearing there might be another one at a port.
· Indonesia Biofuels Producer Association (APROBI) put Indonesia’s biodiesel exports at around 1 million tons, up from around 300,000 tons last year, in part to exports increasing for Europe, China and India. They see production of biodiesel around 5 million tons.
· November Malaysian palm increased 31MYR to 2248 and leading SBO 46 points higher. Cash was up $2.50/ton or 0.4%.
· Rotterdam oils were unchanged to lower and SA soybean meal when imported into Rotterdam mostly higher.
· China bought about 20 cargos of Brazilian soybeans last week.
· The shipping lineup suggests Brazil is scheduled to ship 3.44 million tons of soybeans as of August 29.
· China cash margins were last 84 cents/bu on our analysis, up 11 cents from previous session, and compares to 84 cents late last week, and 96 cents last year.
· The increase in China soybean meal prices was thought to be over Q4 supply tightness.
· A fifth confirmed case of African swine fever hit 185 pigs on a farm in Wuhu city in eastern China’s Anhui province. Look for at least 459 hogs to be culled.
· Offshore values were suggesting a higher lead for US soybean meal by $2.50 and higher lead for soybean oil by 13 points.
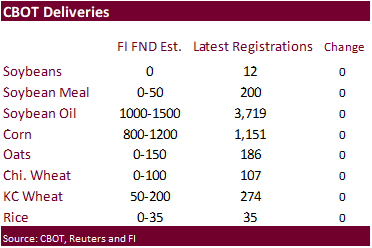
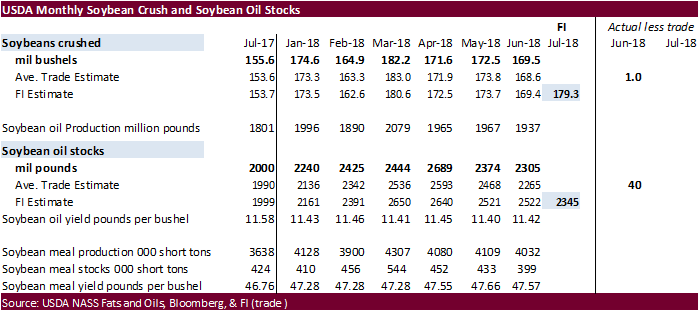
· Note First Notice Deliveries are on Friday. There are only 12 soybean registrations, zero meal and 3,719 soybean oil. Look for 0-50 meal, no soybeans, and 1500-2000 soybean oil.
USDA Export Sales Text
· Soybeans: Net sales of 110,900 MT for 2017/2018 were down 27 percent from the previous week and 39 percent from the prior 4-week average. Increases were reported for the Netherlands (155,200 MT, including 149,500 MT switched from unknown destinations and decreases of 1,000 MT), Iran (139,600 MT, including 128,000 MT switched from unknown destinations), Spain (60,000 MT, switched from unknown destinations), Tunisia (39,200 MT, including 36,500 MT switched from unknown destinations and decreases of 300 MT), and Egypt (38,300 MT, including 30,000 MT switched from unknown destinations). Reductions were for unknown destinations (409,600 MT), China (61,500 MT), and Mexico (20,800 MT). For 2018/2019, net sales of 591,600 MT reported for unknown destinations (360,200 MT), Mexico (131,200 MT), and Pakistan (65,000 MT), were partially offset by reductions for Indonesia (5,200 MT) and Canada (2,500 MT). Exports of 973,100 MT were up 55 percent from the previous week and 30 percent from the prior 4-week average. The destinations included Mexico (218,800 MT), the Netherlands (155,200 MT), Iran (139,600 MT), Egypt (91,300 MT), and Vietnam (76,800 MT). Optional Origin Sales: For 2018/2019, the current outstanding balance of 63,000 MT is for unknown destinations. Export for Own Account: The current exports for own account outstanding balance is 130,900 MT, all Canada.
· Soybean Cake and Meal: Net sales reductions of 21,500 MT for 2017/2018–a marketing-year low–were down noticeably from the previous week and from the prior 4-week average. Increases reported for Israel (16,200 MT), Japan (10,500 MT), Singapore (8,100 MT), Canada (7,400 MT), and Sri Lanka (5,900 MT), were more than offset by reductions for unknown destinations (30,000 MT), Ireland (30,000 MT), the Dominican Republic (16,900 MT), and Mexico (8,700 MT). For 2018/2019, net sales of 500,000 MT reported for unknown destinations (280,000 MT), Mexico (83,900 MT), Ecuador (30,000 MT), and Ireland (30,000 MT), were partially offset by reductions for Thailand (4,400 MT) and Vietnam (1,800 MT). Exports of 253,100 MT were up 37 percent from the previous week and 13 percent from the prior 4-week average. The primary destinations were Mexico (63,300 MT), Denmark (36,000 MT), Ecuador (31,700 MT), Colombia (20,500 MT), and the Dominican Republic (16,900 MT).
· Soybean Oil: Net sales of 24,000 MT for 2017/2018 were up noticeably from the previous week and from the prior 4-week average. Increases reported for South Korea (17,000 MT), Peru (5,000 MT), El Salvador (1,200 MT), and the Dominican Republic (600 MT), were partially offset by reductions for Morocco (200 MT) and Nicaragua (200 MT). Exports of 11,700 MT were down 19 percent from the previous week and 35 percent from the prior 4-week average. The primary destinations were Venezuela (5,500 MT), Mexico (3,300 MT), and Colombia (2,500 MT).
· Cotton: Net sales of 150,600 RB for 2018/2019 were reported for China (44,500 RB, including decreases of 500 RB), Vietnam (30,400 RB, including 4,400 RB switched from China, 1,700 RB switched from South Korea, and 300 RB switched from Thailand), Pakistan (20,400 RB), South Korea (16,400 RB), and Bangladesh (8,800 RB). Reductions were reported for Japan (2,300 RB) and El Salvador (1,600 RB). For 2019/2020, net sales of 49,600 RB were reported for China (48,400 RB) and India (1,200 RB). Exports of 172,600 RB were primarily to Vietnam (61,000 RB), Mexico (18,200 RB), Indonesia (17,900 RB), Turkey (11,000 RB), and South Korea (9,600 RB). Net sales of Pima totaling 10,600 RB for 2018/2019 were reported for India (6,100 RB), China (3,500 RB), and Peru (700 RB). Exports of 2,400 RB were primarily to India (1,200 RB), Turkey (500 RB), Peru (300 RB), and Bangladesh (300 RB). Optional Origin Sales: For 2018/2019, the current optional origin outstanding balance of 6,200 RB is for Indonesia (4,400 RB) and Vietnam (1,800 RB). Exports for Own Account: The current exports for own account outstanding balance is 7,400 RB, all China.
· South Korea seeks 15,000 tons of non-GMO soybeans on September 4 for Nov/Dec arrival.
- USDA seeks 5,000 tons of refined oil for the export program on September 5 for October shipment.
- Iran seeks 30,000 tons of sunflower oil on September 24.
· China plans to suspend rapeseed oil sales from reserves on September 10. The remaining stocks of imported rapeseed and soybean oil will be auction off through September 6.
- China sold about 1.35MMT of soybeans out of reserves this season.
Wheat
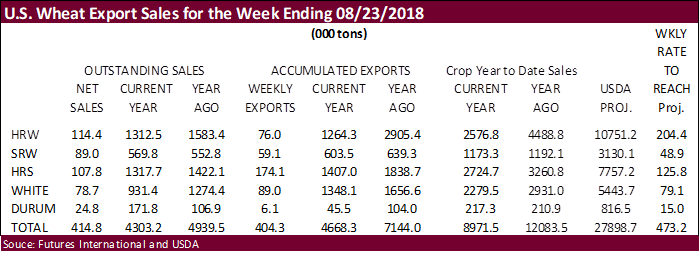
· USDA export sales for all-wheat were ok.
· Dry conditions are raising planting and establishment concerns for central and eastern Ukraine into the middle and lower Volga River Basin, Kazakhstan and Russia’s Southern Region.
· Argentina’s northern wheat area will see rain through Friday. Western half of Argentina is still very dry.
· South Dakota is nearly done with their spring wheat harvest.
USDA Export Sales Text
· Wheat: Net sales of 414,800 MT for 2018/2019 were up 73 percent from the previous week, but down 5 percent from the prior 4-week average. Increases were reported for the Philippines (102,700 MT, including 78,000 MT switched from unknown destinations), Japan (90,300 MT, including decreases of 21,600 MT), Mexico (80,700 MT, including decreases of 400 MT), Indonesia (53,000 MT), and Jamaica (22,400 MT, including 9,000 MT switched from unknown destinations). Reductions were for unknown destinations (23,500 MT) and Honduras (1,500 MT). Exports of 404,300 MT were down 12 percent from the previous week and 2 percent from the prior 4-week average. The destinations were primarily to the Philippines (139,700 MT), Japan (61,200 MT), Mexico (47,000 MT), South Korea (44,900 MT), and Peru (27,400 MT).
· Rice: Net sales of 90,700 MT for 2018/2019 were reported for Haiti (32,200 MT), Iraq (30,000 MT), Mexico (8,700 MT), Costa Rica (7,300 MT), and Guatemala (4,800 MT). Exports of 23,800 MT were primarily to Venezuela (13,500 MT), Mexico (3,700 MT), Canada (1,600 MT), Haiti (1,400 MT), and Jordan (900 MT). Export Adjustments: Accumulated exports of rice to Taiwan were adjusted down 360 MT for week ending April 5th, 720 MT for week ending April 19th, and 620 MT for week ending May 3rd. These shipments were rejected by Taiwan and brought back to the U.S.
· Cotton: Net sales of 150,600 RB for 2018/2019 were reported for China (44,500 RB, including decreases of 500 RB), Vietnam (30,400 RB, including 4,400 RB switched from China, 1,700 RB switched from South Korea, and 300 RB switched from Thailand), Pakistan (20,400 RB), South Korea (16,400 RB), and Bangladesh (8,800 RB). Reductions were reported for Japan (2,300 RB) and El Salvador (1,600 RB). For 2019/2020, net sales of 49,600 RB were reported for China (48,400 RB) and India (1,200 RB). Exports of 172,600 RB were primarily to Vietnam (61,000 RB), Mexico (18,200 RB), Indonesia (17,900 RB), Turkey (11,000 RB), and South Korea (9,600 RB). Net sales of Pima totaling 10,600 RB for 2018/2019 were reported for India (6,100 RB), China (3,500 RB), and Peru (700 RB). Exports of 2,400 RB were primarily to India (1,200 RB), Turkey (500 RB), Peru (300 RB), and Bangladesh (300 RB). Optional Origin Sales: For 2018/2019, the current optional origin outstanding balance of 6,200 RB is for Indonesia (4,400 RB) and Vietnam (1,800 RB). Exports for Own Account: The current exports for own account outstanding balance is 7,400 RB, all China.
Export Developments.
· The European Union awarded 71,983 tons of wheat imports excluding United States and Canada under reduced-tariff quotas.
- Syria’s General Establishment for Cereal Processing and Trade (Hoboob) seeks 200,000 tons of soft bread wheat from Russia, Romania or Bulgaria, with shipment sought between Oct. 15 and Dec. 15. The deadline is Sept. 17 and requires payment in Syrian pounds.
· Taiwan seeks 110,500 tons of US milling wheat from the US on August 31 fir October/November shipment.
- Japan in a SBS import tender seeks 120,000 tons of feed wheat and 200,000 tons of barley on September 5 for arrival by January 31.
- Ethiopia seeks 200,000 tons of milling wheat on September 18 for shipment two months after contract signing.
Rice/Other
· Egypt bought 100,000 tons of Brazilian raw sugar for FH Sep and LH October shipment.
· The Philippines will import 132,000 tons of additional rice soon.
· South Korea seeks 92,783 tons of rice on Aug. 31 for Nov/Dec arrival.
TONNES(M/T) GRAIN TYPE ARRIVAL/PORT
10,000 Brown medium Nov 30/Gwangyang
10,000 Brown medium Dec 31/Busan
20,000 Brown medium Dec 31/Gunsan
20,000 Brown medium Dec 31/Mokpo
20,000 Brown medium Dec 31/Donghae
12,783 Brown long Nov 30/Masan
Terry Reilly
Senior Commodity Analyst – Grain and Oilseeds
Futures International │190 S LaSalle St., Suite 410│Chicago, IL 60603
W: 312.604.1366
AIM: fi_treilly
ICE IM: treilly1
Skype: fi.treilly

Trading of futures, options, swaps and other derivatives is risky and is not suitable for all persons. All of these investment products are leveraged, and you can lose more than your initial deposit. Each investment product is offered only to and from jurisdictions where solicitation and sale are lawful, and in accordance with applicable laws and regulations in such jurisdiction. The information provided here should not be relied upon as a substitute for independent research before making your investment decisions. Futures International, LLC is merely providing this information for your general information and the information does not take into account any particular individual’s investment objectives, financial situation, or needs. All investors should obtain advice based on their unique situation before making any investment decision. The contents of this communication and any attachments are for informational purposes only and under no circumstances should they be construed as an offer to buy or sell, or a solicitation to buy or sell any future, option, swap or other derivative. The sources for the information and any opinions in this communication are believed to be reliable, but Futures International, LLC does not warrant or guarantee the accuracy of such information or opinions. Futures International, LLC and its principals and employees may take positions different from any positions described in this communication. Past results are not necessarily indicative of future results.