From: Terry Reilly
Sent: Thursday, October 04, 2018 8:06:54 AM (UTC-06:00) Central Time (US & Canada)
Subject: FI Morning Grain Comments 10/04/18
・ Parts of New South Wales (inland) saw around and inch of rain, in some cases two inches, Thursday morning. For some towns it was the heaviest rainfall they have seen all season.
・ The Thursday morning weather models turned drier for France (driest areas) and Poland. Southeastern Europe will remain dry.
・ 6-10 day is drier in the Delta and 11-15 day is drier in the Midwest and eastern Plains.
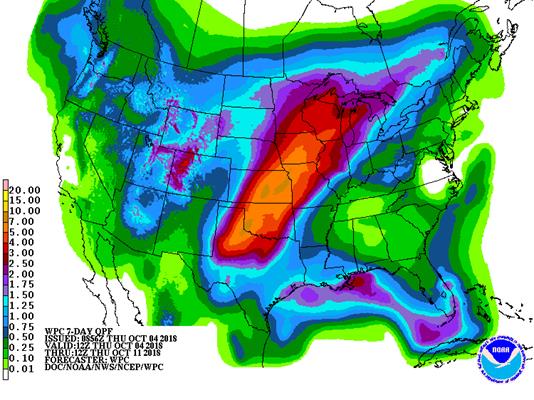
・ 6-12 inches of rain could fall across the heart of the US over the next several days, according to the European model.
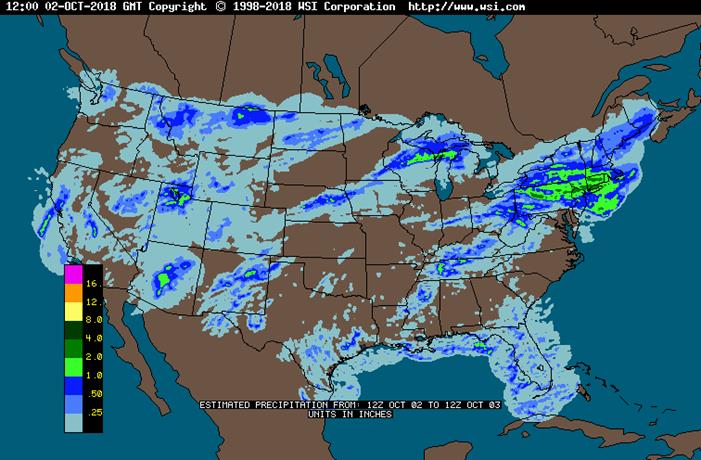
・ The Midwest will be wet Thursday into mid-next week, bias WCB. The rain will delay harvesting efforts and raise concerns over quality for corn and soybeans. There will be an important period of drier weather October 10-15, which will be needed for producers.
・ This week the Delta will be on the drier side. Showers will fall in the lower Midwest and Tennessee River Basin. Overall fieldwork activity across the Delta should improve.
・ Rain will fall from the southwestern desert areas through the northern Plains early to mid-week this week.
・ The Canada Prairies will be cold this week.
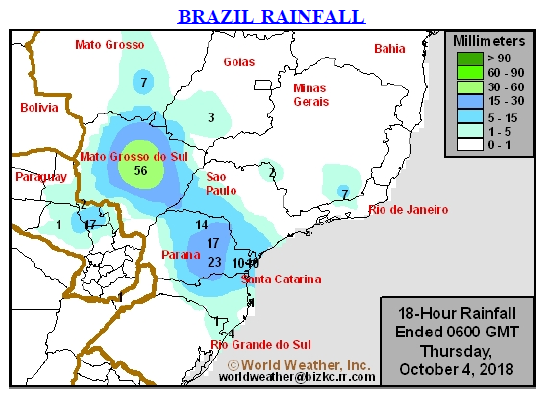
・ Brazil will see rain in the central and southern growing areas (MG, MGDS, Goias, Parana) this week while Argentina will be dry through Saturday.
SIGNIFICANT CORN AND SOYBEAN BELT PRECIPITATION EVENTS
WEST CORN BELT EAST CORN BELT
-Thu 80% cvg of up to 0.55”
and local amts to 1.10”;
wettest west
Thu-Sat 80% cvg of 0.50-2.0”
and local amts to 3.50”
from Ks. to central and
south Wi. with up to
0.75” and locally more
elsewhere; S.D. and NE
Neb. driest
Fri-Sun 80% cvg of up to 0.75”
and local amts to 2.0”;
west and north Il. to
west Mi. wettest;
driest SE
Sun-Tue 85% cvg of 0.50-1.50”
and local amts over 3.0”
in east Ks. and nearby
areas with up to 0.75”
and local amts to 2.0”
elsewhere
Mon 15% cvg of up to 0.25”
and locally more
Tue-Oct 10 80% cvg of up to 0.75”
and local amts to 2.0”;
wettest west; driest SE
Oct 10-12 75% cvg of up to 0.75”
and local amts to 2.0”
Oct 11-13 70% cvg of up to 0.75”
and local amts to 1.50”
Oct 13-17 Up to 20% daily cvg of
up to 0.25” and locally
more each day
Oct 14-17 Up to 20% daily cvg of
up to 0.25” and locally
more each day
U.S. DELTA/SOUTHEAST SIGNIFICANT PRECIPITATION EVENTS
DELTA SOUTHEAST
Thu Up to 20% daily cvg of
up to 0.20” and locally
more each day; some
days may be dry
Tdy-Fri Up to 15% daily cvg of
up to 0.20” and locally
more each day; some
days may be dry
Sat 50% cvg of up to 0.35”
and local amts to 0.60”
Fri-Sun 5-20% daily cvg of up
to 0.40” and locally
more each day
Sun-Oct 11 5-20% daily cvg of up
to 0.30” and locally
more each day
Mon-Oct 11 15-35% daily cvg of
up to 0.40” and locally
more each day
Oct 12-13 40% cvg of up to 0.30”
and locally more
Oct 12-14 50% cvg of up to 0.50”
and local amts to 1.10”
Oct 14-17 Up to 20% daily cvg of
up to 0.20” and locally
more each day
Oct 15-17 Up to 20% daily cvg of
up to 0.20” and locally
more each day
Source: World Weather Inc. and FI
- FAO food index for September, 4am ET (9am London)
- USDA weekly net-export sales for corn, wheat, soy, cotton, 8:30am
- Port of Rouen data on French grain exports
- Buenos Aires Grain Exchange weekly crop report
- Bloomberg weekly survey of analysts’ expectations on grain, sugar prices
FRIDAY, OCT. 5:
- FranceAgriMer weekly updates on French crop conditions
- ICE Futures Europe commitments of traders weekly report on coffee, cocoa, sugar positions, ~1:30pm ET (~6:30pm London)
- CFTC commitments of traders weekly report on positions for various U.S. futures and options, 3:30pm
Source: Bloomberg and FI
・ Rice down 4 to 28 – OTWELL, AR
Deliveries
・ SBM 190C Bunge issued 125
・ SBO 566 C no apparent commercial stoppers
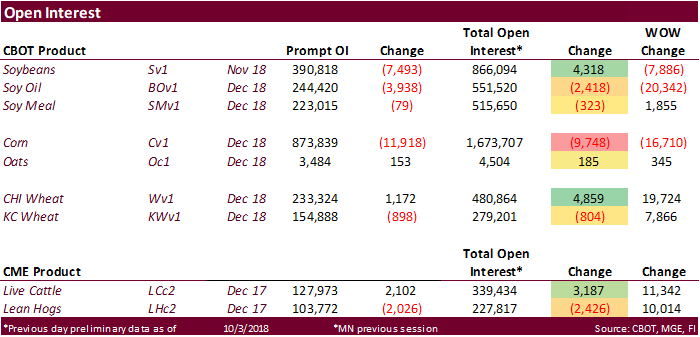
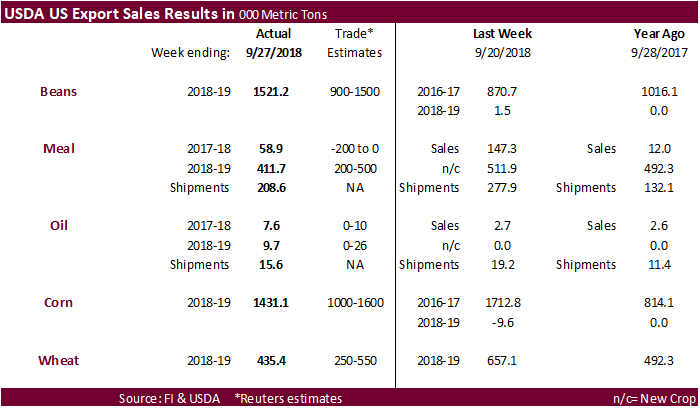
USDA export sales were good for meal, soybeans and corn.
・ Soybean export sales included 730,400 tons for Mexico and 96,000 tons for Argentina.
・ New-crop soybean meal export sales of 411,700 tons included nearly 200,000 tons for unknown.
・ Corn export sales of 1.431 million tons included 527,400 tons for Mexico and 199,700 tons for Canada.
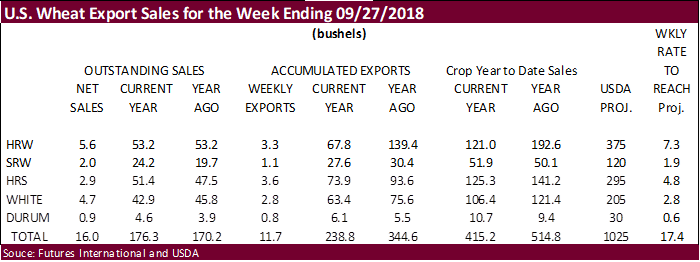
・ All-wheat export sales were ok at 435,300 tons.
・ US stocks are lower, USD higher, WTI crude lower, and gold higher, at the time this was written. (6:31 am CT)
Corn.
- Corn futures are seeing an uptick in prices on Thursday as forecasts for rains are to further delay the 2018 US harvest.
- Another week of solid USDA corn export sales are supportive.
- Baltic Dry Index is down 20 points at 1,554 points.
- Apparently Informa is due out today with October production estimates. In early September they were at 178.8 / 14.621 for corn and 52.9 / 4.698 for soybeans. USDA is at 181.3 / 14.827 and 52.8 / 4.693.
- China reported a case of bird flu https://www.globalmeatnews.com/Article/2018/10/02/China-hit-with-avian-flu
- Brazil’s Conab will release supply estimates next week and we look for the combined soybean and corn area in Brazil to expand 3.8% from the previous season, in part to a recovery in the corn area. Conab’s first estimate for new-crop will be on October 11, 9h Brasilia time.
- Weekly US ethanol production fell 21,000 barrels per day after falling 15,000 during the previous week. Ethanol stocks were up sharply by 816,000 barrels to 23.445 million barrels.
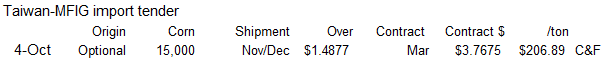
- Taiwan’s MFIG bought 65,000 tons of United States or Brazil corn.
- Shipment: U.S. Gulf or Brazil, between Nov. 20 and Dec. 9.
- Shipment: U.S. Pacific Northwest coast or South Africa, between Dec. 5 to Dec. 24.
-
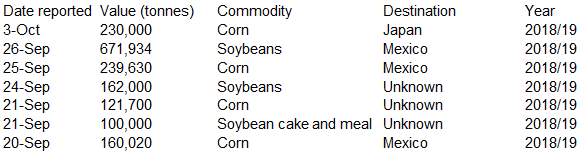
・ Under the 24-hour announcement system, US exporters reported the sale of 230,000 tons of corn for delivery to Japan during the 2018-19 marketing year.
・ China may sell 8 million tons of corn for the week ending October 12.
・ China sold about 85.5 million tons of corn out of reserves this season and some are predicting up to 100 million tons will be sold by the end of the marketing season.
USDA Export Sales text
・ Corn: Net sales of 1,431,000 MT for 2018/2019 were reported for Mexico (527,400 MT), Canada (199,700 MT, including decreases of 400 MT), Peru (184,900 MT, including 125,000 MT switched from unknown destinations and decreases of 6,400 MT), Japan (173,900 MT, including 73,100 MT switched from unknown destinations and decreases of 3,000 MT), and South Korea (136,100 MT, including decreases of 1,300 MT). Reductions were reported for unknown destinations (62,700 MT). Exports of 1,408,100 MT were primarily to Mexico (390,600 MT), Japan (307,200 MT), Peru (154,900), South Korea (139,800 MT), and Saudi Arabia (82,500 MT). Optional Origin Sales: For 2018/2019, options were exercised to export 138,000 MT to Saudi Arabia (70,000 MT) and South Korea (68,000 MT) from the United States. The current outstanding balance of 1,019,000 MT is for South Korea (481,000 MT), unknown destinations (353,000 MT), Vietnam (130,000 MT), and Malaysia (55,000 MT).
・ Barley: Net sales of 200 MT for 2018/2019 were reported for Taiwan. Exports 2,100 MT–a marketing-year high–were up noticeably from the previous week and from the prior 4-week average. The primary destination was Japan.
・ Sorghum: Net sales of 20,300 MT for 2018/2019 were reported for Mexico. Exports of 1,000 MT were reported to Mexico.
・ Beef: Net sales of 16,200 MT reported for 2018 were up 1 percent from the previous week, but down 3 percent from the prior 4-week average. Increases were reported for Hong Kong (9,200 MT, including decreases of 100 MT), South Korea (3,100 MT, including decreases of 100 MT), Japan (1,600 MT, including decreases of 1,500 MT), Canada (700 MT), and Taiwan (600 MT). Reductions were reported for Vietnam (200 MT). For 2019, net sales reductions of 100 MT were primarily for Japan. Exports of 12,600 MT were down 22 percent from the previous week and 24 percent from the prior 4-week average. The primary destinations were Japan (4,000 MT), South Korea (2,600 MT), Hong Kong (1,900 MT), Mexico (1,200 MT), and Taiwan (900 MT).
・ Pork: Net sales of 14,700 MT reported for 2018 were down 48 percent from the previous week and 34 percent from the prior 4-week average. Increases were reported primarily for Mexico (7,600 MT), Japan (1,800 MT), South Korea (1,300 MT), Canada (1,300 MT), and Colombia (800 MT). Reductions were reported for Australia (300 MT). For 2019, net sales of 400 MT were reported for Australia (300 MT) and Canada (100 MT). Exports of 21,900 MT were up 25 percent from the previous week and 12 percent from the prior 4-week average. The primary destinations were Mexico (8,000 MT), Japan (4,000 MT), South Korea (2,800 MT), Hong Kong (1,900 MT), and Canada (1,300 MT).
Soybean complex.
・ The CBOT complex was moderately higher this morning and firmed around 6:35 CT. Rapeseed prices in Europe are higher as well.
・ Although USDA soybean export sales fell below our expectations, they were above a trade range and seen supportive as Mexico conformed their 24-hour sale announcement and 2 cargos of soybeans to Argentina. Soybean sales to Europe were good as well.
・ Soybean meal export sales for new-crop were good. Soybean oil sales were ok but could be better for this time of year.
・ The Thursday morning weather models turned drier for France (driest areas) and Poland. Southeastern Europe will remain dry.
・ US harvest progress through at least October 13 will be hampered with heavy rains bias WCB.
・ The USDA Attaché has Brazil soybean production at a large 123MMT, highest estimate we has seen, up from 119.5MMT a year earlier.
・ There is talk China is still buying Brazil soybeans for October/November shipment.
・ 2 more Argentina soybean cargos destined for China showed up in the shipping lineup.
・ China is on holiday all week.
・ An Indian oilseed company related CEO predicts India’s rapeseed production could increase 1 million tons this year to 7 million tons.
・ Lanworth recently estimated Indonesia palm production at 42.2 million tons. Note last week Mistry pegged Indonesia palm production at 40 million tons, up 1.5MMT from a previous forecast.
・ Malaysia December palm oil was higher by 31MYR and leading SBO 11 points higher. Malaysian cash palm oil was up 1.25 at $561.25/ton.
・ Rotterdam oils were higher and SA soybean meal when imported into Rotterdam lower.
・ Offshore values were suggesting a higher lead for US soybean meal by $1.20 and higher lead in SBO by 15 points.
USDA Export Sales text
・ Soybeans: Net sales of 1,521,200 MT for 2018/2019 were reported for Mexico (730,400 MT, including decreases of 400 MT), unknown destinations (274,000 MT), Germany (135,800 MT), Argentina (96,000 MT, including decreases of 4,000 MT), and the Netherlands (79,500 MT, including 86,000 MT switched from unknown destinations and decreases of 7,600 MT). Reductions were reported for China (124,100 MT) and Chile (800 MT). For 2019/2020, net sales of 4,000 MT were reported for Japan. Exports of 720,500 MT were primarily to Germany (135,800 MT), Thailand (87,800 MT), the Netherlands (79,500 MT), Pakistan (66,700 MT), and Mexico (65,700 MT). Optional Origin Sales: For 2018/2019, new optional origin sales of 60,000 MT were reported for unknown destinations. The current outstanding balance of 183,000 MT is unknown destinations. Export for Own Account: The current exports for own account outstanding balance is 61,600 MT, all Canada. Export Adjustment: Accumulated exports of soybeans to the Netherlands were adjusted down 70,544 MT for week ending September 6, 2018 and 65,207 MT for week ending September 13, 2018. These shipments are for Germany and is included in this week’s report.
・ Soybean Cake and Meal: Net sales of 58,900 MT for 2017/2018 were down 60 percent from the previous week and 24 percent from the prior 4-week average. Increases were reported for Colombia (24,400 MT), the Philippines (20,000 MT), Mexico (15,000 MT, including decreases of 100 MT), Honduras (8,300 MT, including 7,300 MT switched from Guatemala), and Canada (5,800 MT, including decreases of 1,200 MT). Reductions were reported for the Dominican Republic (13,400 MT), Guatemala (7,300 MT), and Nicaragua (800 MT). For 2018/2019, net sales of 411,700 MT reported for unknown destinations (194,000 MT), Mexico (93,000 MT), Ecuador (42,000 MT), and Canada (19,200 MT), were partially offset by reductions for Jamaica (2,500 MT). Exports of 208,600 MT were down 25 percent from the previous week and 5 percent from the prior 4-week average. The primary destinations were Mexico (29,700 MT), Colombia (27,200 MT), Honduras (22,300 MT), Morocco (21,800 MT), and Vietnam (19,000 MT).
・ Soybean Oil: Net sales of 7,600 MT for 2017/2018 were up noticeably from the previous week and from the prior 4-week average. Increases were reported for South Korea (5,000 MT), El Salvador (1,500 MT), and Mexico (1,000 MT). For 2018/2019, net sales of 9,700 MT were reported for the Dominican Republic (8,800 MT), Canada (800 MT), and Mexico (100 MT). Exports of 15,600 MT were down 19 percent from the previous week and 15 percent from the prior 4-week average. The primary destinations were South Korea (9,000 MT), Colombia (4,600 MT), and Mexico (1,500 MT).
Wheat
・ Wheat is higher on Egypt seeking wheat (lowest offer $233.95 fob Russian) and talk that the Russian and US fob wheat spread is narrowing. US HRW fob is around $238/ton.
・ USDA all-wheat export sales were ok.
・ Iraq’s AgMin mentioned 2018-19 winter crop plantings will be down 55 percent to 315,266 hectares due to a water shortage. Their water reserve is around 11 billion cubic meters, 4 billion less than last year.
- France will see rain by the end of the week into next week. Eastern Australia may see some rain across NSW and southern Queensland this week. Traders should monitor a potential significant rain event in far southern Brazil Saturday into Sunday which could negatively impact wheat conditions.
・ The Thursday morning weather models turned drier for France (driest areas) and Poland. Southeastern Europe will remain dry.
- Egypt seeks wheat for Dec 1-10 shipment. Lowest offer was $233.95/ton fob Russian.
- Yesterday Tunisia bought optional origin wheat.
- 25,000 tons of soft wheat at $249.11 per ton c&f.
- 50,000 tons of feed barley at $262.67 per ton c&f
- 75,000 tons of durum at $270.73-$274.29 per ton c&f
- Results awaited: Jordan seeks 100,000 tons of feed barley on October 3.
- Libya seeks 1 million tons of Russian wheat.
- Bahrain seeks 25,000 tons of wheat on October 2 for Nov shipment.
- Bangladesh seeks 50,000 tons of 12.5 percent wheat on October 9, optional origin.
- Japan in a SBS import tender seeks 120,000 tons of feed wheat and 200,000 tons of barley on October 10 for arrival by late February.
- Postponed: UAE seeks 60,000 tons of wheat for Oct/Nov shipment.
Rice/Other
・ Results awaited: Thailand seeks to sell 120,000 tons of sugar on October 3.
・ The Philippines seek 250,000 tons of rice on October 18 for arrival by late November.
・ Mauritius seeks 9,000 tons of rice for delivery between Nov. 15, 2018, and March 31, 2019, set to close is Sept. 27.
USDA Export Sales text
・ Wheat: Net sales of 435,300 metric tons for 2018/2019 were down 34 percent from the previous week and 8 percent from the prior 4-week average. Increases were reported for Brazil (90,000 MT), Saudi Arabia (65,000 MT, switched from unknown destinations), Nigeria (55,500 MT), Iraq (52,200 MT), and Japan (31,000 MT). Reductions were for Thailand (5,200 MT) and unknown destinations (5,000 MT). Exports of 317,100 MT were down 34 percent from the previous week and 16 percent from the prior 4-week average. The destinations were primarily to Thailand (55,000 MT), Iraq (52,200 MT), Japan (41,300 MT), the Philippines (39,600), and Italy (32,800 MT).
・ Rice: Net sales of 39,800 MT for 2018/2019 were down 71 percent from the previous week and 34 percent from the prior 4-week average. Increases were reported for Japan (13,300 MT), Mexico (11,600 MT), El Salvador (6,600 MT), Saudi Arabia (4,700 MT), and Canada (3,800 MT). Reductions were reported for Togo (6,500 MT). Exports of 17,100 MT were up noticeably from the previous week, but down 59 percent from the prior 4-week average. The primary destinations were El Salvador (5,700 MT), Mexico (3,200 MT), Canada (2,100 MT), Jordan (1,500 MT), and Saudi Arabia (1,400 MT). Export for Own Account: The current exports for own account outstanding balance is 100 MT, all Canada.
・ Cotton: Net sales of 21,800 RB for 2018/2019–a marketing-year low–were down 69 percent from the previous week and 74 percent from the prior 4-week average. Increases were reported for Bangladesh (26,400 RB), Vietnam (20,500 RB, including 8,800 RB switched from China and decreases of 200 RB), Pakistan (15,700 RB), Peru (12,000 RB), and Indonesia (8,800 RB, including decreases of 400 RB). Reductions were reported for China (85,900 RB) and Brazil (200 RB). For 2019/2020, net sales of 91,100 RB reported for China (90,200 RB) and El Salvador (2,100 RB), were partially offset by reductions for India (1,200 RB). Exports of 179,700 RB were up 29 percent from the previous week and 20 percent from the prior 4-week average. Exports were primarily to Mexico (52,500 RB), Vietnam (35,100 RB), Pakistan (12,400 RB), China (12,400 RB), and Bangladesh (11,500 RB). Net sales of Pima totaling 3,200 RB for 2018/2019 were down 56 percent from the previous week and 52 percent from the prior 4-week average. Increases reported for China (4,400 RB), India (1,000 RB), and Turkey (100 RB), were partially offset by reductions for Vietnam (2,200 RB). Exports of 4,700 RB were down 1 percent from the previous week and 30 percent from the prior 4-week average. The primary destinations were India (3,600 RB), China (500 RB), Japan (300 RB), and Peru (200 RB). Optional Origin Sales: For 2018/2019, the current outstanding balance of 1,800 RB is for Vietnam. Exports for Own Account: The current exports for own account outstanding balance is 7,400 RB, all China.
U.S. EXPORT SALES FOR WEEK ENDING 9/27/2018
|
|
CURRENT MARKETING YEAR |
NEXT MARKETING YEAR |
||||||
|
COMMODITY |
NET SALES |
OUTSTANDING SALES |
WEEKLY EXPORTS |
ACCUMULATED EXPORTS |
NET SALES |
OUTSTANDING SALES |
||
|
CURRENT YEAR |
YEAR |
CURRENT YEAR |
YEAR |
|||||
|
|
THOUSAND METRIC TONS |
|||||||
|
WHEAT |
|
|
|
|
|
|
|
|
|
HRW |
151.7 |
1,446.8 |
1,448.2 |
89.7 |
1,845.3 |
3,793.7 |
0.0 |
0.0 |
|
SRW |
54.3 |
659.2 |
536.2 |
30.6 |
752.3 |
828.6 |
0.0 |
0.0 |
|
HRS |
77.9 |
1,400.1 |
1,293.9 |
97.4 |
2,010.2 |
2,548.1 |
0.0 |
0.0 |
|
WHITE |
127.8 |
1,168.9 |
1,246.8 |
77.0 |
1,726.3 |
2,058.4 |
0.0 |
0.0 |
|
DURUM |
23.6 |
124.3 |
107.2 |
22.3 |
166.3 |
149.8 |
0.0 |
0.0 |
|
TOTAL |
435.3 |
4,799.4 |
4,632.3 |
317.1 |
6,500.3 |
9,378.5 |
0.0 |
0.0 |
|
BARLEY |
0.2 |
39.8 |
27.4 |
2.1 |
15.9 |
10.0 |
0.0 |
0.0 |
|
CORN |
1,431.0 |
15,127.2 |
9,052.4 |
1,408.1 |
4,571.8 |
3,042.7 |
0.0 |
71.1 |
|
SORGHUM |
20.3 |
81.1 |
1,029.6 |
1.0 |
4.9 |
283.5 |
0.0 |
0.0 |
|
SOYBEANS |
1,521.2 |
17,087.9 |
19,263.1 |
720.5 |
3,100.6 |
4,001.1 |
4.0 |
85.5 |
|
SOY MEAL |
58.9 |
732.3 |
409.3 |
208.6 |
12,067.4 |
10,031.6 |
411.7 |
2,934.8 |
|
SOY OIL |
7.6 |
68.0 |
41.4 |
15.6 |
1,013.8 |
1,100.3 |
9.7 |
73.2 |
|
RICE |
|
|
|
|
|
|
|
|
|
L G RGH |
17.1 |
265.4 |
123.7 |
7.0 |
159.6 |
198.6 |
0.0 |
0.0 |
|
M S RGH |
0.0 |
4.7 |
12.3 |
0.0 |
0.0 |
0.4 |
0.0 |
0.0 |
|
L G BRN |
2.3 |
7.4 |
1.2 |
0.5 |
3.2 |
1.2 |
0.0 |
0.0 |
|
M&S BR |
0.1 |
30.2 |
4.1 |
0.1 |
0.7 |
0.4 |
0.0 |
0.0 |
|
L G MLD |
3.5 |
119.0 |
144.4 |
4.4 |
109.6 |
143.6 |
0.0 |
0.0 |
|
M S MLD |
16.9 |
38.4 |
77.4 |
5.2 |
82.9 |
44.0 |
0.0 |
0.0 |
|
TOTAL |
39.8 |
465.1 |
363.1 |
17.1 |
356.1 |
388.3 |
0.0 |
0.0 |
|
COTTON |
|
THOUSAND RUNNING BALES |
||||||
|
UPLAND |
21.8 |
7,631.3 |
6,006.6 |
179.7 |
1,393.9 |
1,387.8 |
91.1 |
1,570.2 |
|
PIMA |
3.2 |
226.1 |
279.2 |
4.7 |
51.8 |
35.8 |
0.0 |
25.3 |
Terry Reilly
Senior Commodity Analyst C Grain and Oilseeds
Futures International │190 S LaSalle St., Suite 410│Chicago, IL 60603
W: 312.604.1366
AIM: fi_treilly
ICE IM: treilly1
Skype: fi.treilly

Trading of futures, options, swaps and other derivatives is risky and is not suitable for all persons. All of these investment products are leveraged, and you can lose more than your initial deposit. Each investment product is offered only to and from jurisdictions where solicitation and sale are lawful, and in accordance with applicable laws and regulations in such jurisdiction. The information provided here should not be relied upon as a substitute for independent research before making your investment decisions. Futures International, LLC is merely providing this information for your general information and the information does not take into account any particular individual’s investment objectives, financial situation, or needs. All investors should obtain advice based on their unique situation before making any investment decision. The contents of this communication and any attachments are for informational purposes only and under no circumstances should they be construed as an offer to buy or sell, or a solicitation to buy or sell any future, option, swap or other derivative. The sources for the information and any opinions in this communication are believed to be reliable, but Futures International, LLC does not warrant or guarantee the accuracy of such information or opinions. Futures International, LLC and its principals and employees may take positions different from any positions described in this communication. Past results are not necessarily indicative of future results.
This email, any information contained herein and any files transmitted with it (collectively, the Material) are the sole property of OTC Global Holdings LP and its affiliates (OTCGH); are confidential, may be legally privileged and are intended solely for the use of the individual or entity to whom they are addressed. Unauthorized disclosure, copying or distribution of the Material, is strictly prohibited and the recipient shall not redistribute the Material in any form to a third party. Please notify the sender immediately by email if you have received this email by mistake, delete this email from your system and destroy any hard copies. OTCGH waives no privilege or confidentiality due to any mistaken transmission of this email.