From: Terry Reilly
Sent: Thursday, March 12, 2020 7:43:37 AM (UTC-06:00) Central Time (US & Canada)
Subject: FI Weekly USDA Export Sales Snapshot 03/12/20
PDF attached
Morning. Global market selloff continues.
USDA export sales
· Net reductions for 26,600 tons for pork sales was the biggest surprise today. China cancelled 44,500 tons.
· Sorghum sales were 260,200 tons and included 175,500 tons for China and 71,000 tons for unknown.
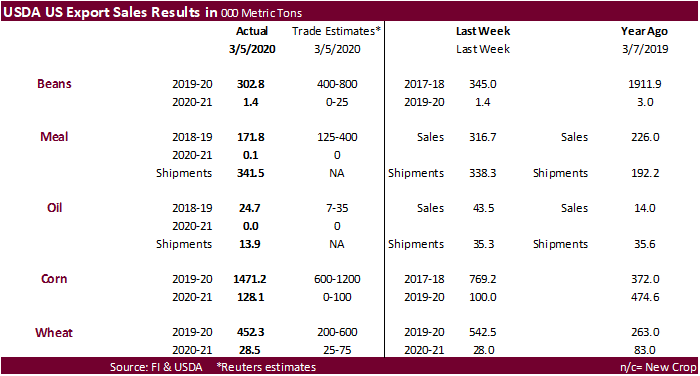
· Soybean export sales were poor, meal low end of expectations (shipments of 341.5k were good), and soybean oil sales were ok. Shipments of soybean oil were more than half of last week.
· Corn export sales were robust at 1.471 million tons, up from 769,200 tons last week.
· All-wheat sales of 452,300 tons were within expectations.
USDA Export Sales Highlights
This summary is based on reports from exporters for the period February 28 – March 5, 2020.
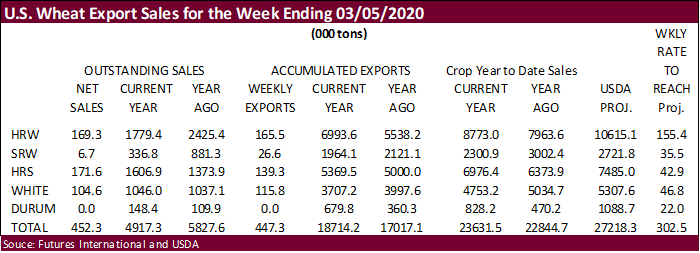
- Wheat: Net sales of 452,300 metric tons for 2019/2020 were down 17 percent from the previous week and 6 percent from the prior 4-week average. Increases primarily for South Korea (144,600 MT, including 11,400 MT switched from unknown destinations), the Philippines (111,900 MT, including decreases of 3,200 MT), Japan (77,400 MT, including decreases of 400 MT), Mexico (43,400 MT, including decreases of 300 MT), and Nigeria (35,000 MT), were offset by reductions for unknown destinations (33,200 MT). For 2020/2021, net sales of 28,500 MT were primarily for Honduras (23,500 MT). Exports of 447,300 MT were down 31 percent from the previous week and 17 percent from the prior 4-week average. The destinations were primarily to Japan (96,400 MT), South Korea (82,200 MT), Mexico (81,200 MT), Bangladesh (58,600 MT), and the Philippines (57,900 MT).
- Corn: Net sales of 1,471,200 MT for 2019/2020 were up 91 percent from the previous week and 53 percent from the prior 4-week average. Increases primarily for Japan (750,500 MT, including 37,100 MT switched from unknown destinations and decreases of 11,600 MT), South Korea (198,400 MT, including decreases of 1,900 MT), unknown destinations (178,800 MT), Mexico (163,800 MT, including 26,000 MT switched from unknown destinations and decreases of 1,100 MT), and Colombia (56,200 MT, including decreases of 300 MT), were offset by reductions primarily for Peru (50,000 MT). For 2020/2021, net sales of 128,100 MT were for Mexico (90,000 MT) and Japan (38,100 MT). Exports of 851,700 MT were down 4 percent from the previous week, but up 4 percent from the prior 4-week average. The destinations were primarily to Mexico (368,200 MT), Japan (192,300 MT), Chile (84,600 MT), South Korea (66,800 MT), and Costa Rica (66,600 MT).
- Optional Origin Sales: For 2019/2020, options were exercised to export 68,000 MT to South Korea from the United States. The current outstanding balance of 711,000 MT is for South Korea (651,000 MT) and Israel (60,000 MT).
- Barley: There were no sales or exports reported during the week.
- Sorghum: Net sales of 260,200 MT for 2019/2020 were up noticeably from the previous week and 78 percent from the prior 4-week average. Increases were for China (175,000 MT), unknown destinations (71,000 MT), Japan (12,000 MT), Mexico (2,100 MT), and South Korea (100 MT). Exports of 13,200 MT were down 86 percent from the previous week and 80 percent from the prior 4-week average. The destinations were Mexico (13,100 MT) and South Korea (100 MT).
- Rice: Net sales of 42,500 MT for 2019/2020 were up 11 percent from the previous week, but down 47 percent from the prior 4-week average. Increases primarily for Japan (27,600 MT, including decreases of 500 MT), Mexico (8,700 MT), Saudi Arabia (2,900 MT), Canada (2,300 MT), and Israel (1,100 MT), were offset by reductions primarily for Guatemala (1,000 MT) and Haiti (500 MT). Exports of 62,300 MT were unchanged from the previous week, but down 12 percent from the prior 4-week average. The destinations were primarily to Haiti (30,100 MT), Mexico (16,700 MT), Saudi Arabia (3,200 MT), South Korea (2,300 MT), and Canada (2,300 MT).
- Soybeans: Net sales of 302,800 MT for 2019/2020–a marketing-year low–were down 12 percent from the previous week and 34 percent from the prior 4-week average. Increases primarily for Japan (120,000 MT, including 61,000 MT switched from unknown destinations and decreases of 600 MT), Indonesia (95,400 MT, including 68,000 MT switched from unknown destinations and decreases of 2,600 MT), the Netherlands (64,700 MT, including 65,000 MT switched from unknown destinations and decreases of 300 MT), Colombia (33,700 MT), and Mexico (22,000 MT, including decreases of 900 MT), were offset by reductions primarily for China (90,300 MT). For 2020/2021, total net sales of 1,400 MT were for Japan. Exports of 567,600 MT were down 18 percent from the previous week and 21 percent from the prior 4-week average. The destinations were primarily to China (139,700 MT), Japan (118,300 MT), Indonesia (92,400 MT), the Netherlands (64,700 MT), and Mexico (54,400 MT).
Exports for Own Account: For 2019/2020, the current exports for own account outstanding balance is 2,100 MT, all Canada.
- Soybean Cake and Meal: Net sales of 171,800 MT for 2019/2020 were down 46 percent from the previous week and 22 percent from the prior 4-week average. Increases primarily for Vietnam (41,000 MT), Canada (38,700 MT), Peru (18,100 MT), El Salvador (18,000 MT), and Honduras (14,800 MT, including decreases of 200 MT), were offset by reductions primarily for Ecuador (1,200 MT). For 2020/2021, total net sales of 100 MT were for Canada. Exports of 341,500 MT–a marketing-year high–were up 1 percent from the previous week and 22 percent from the prior 4-week average. The destinations were primarily to the Philippines (93,300 MT), Canada (45,900 MT), Mexico (36,400 MT), Peru (32,200 MT), and Israel (32,000 MT).
- Soybean Oil: Net sales of 24,700 MT for 2019/2020 primarily for Morocco (20,000 MT switched from unknown destinations), South Korea (10,000 MT), Jamaica (3,500 MT), Mexico (3,300 MT), and El Salvador (2,000 MT), were offset by reductions for unknown destinations (20,000 MT). Exports of 13,900 MT were down 61 percent from the previous week and 64 percent from the prior 4-week average. The destinations were primarily to South Korea (12,000 MT), Mexico (1,400 MT), Canada (300 MT), and Honduras (200 MT).
- Cotton: Net sales of 484,200 RB for 2019/2020–a marketing-year high–were up 22 percent from the previous week and 62 percent from the prior 4-week average. Increases primarily for Pakistan (161,600 RB), China (90,900 RB, including decreases of 900 RB), Turkey (84,100 RB), Vietnam (47,400 RB, including 700 RB switched from Japan), and Bangladesh (32,800 RB), were offset by reductions primarily for Japan (3,900 RB) and Thailand (1,200 RB). For 2020/2021, net sales of 160,400 RB were primarily for Mexico (91,600 RB), Turkey (20,100 RB), China (15,900 RB), Pakistan (11,400 RB), and Honduras (6,100 RB). Exports of 424,600 RB were down 11 percent from the previous week, but up 8 percent from the prior 4-week average. Exports were primarily to Vietnam (94,600 RB), Pakistan (86,200 RB), Turkey (60,400 RB), China (55,100 RB), and Bangladesh (34,800 RB). Net sales of Pima totaling 17,300 RB were up 91 percent from the previous week and 20 percent from the prior 4-week average. Increases were primarily for Vietnam (6,600 RB), Bangladesh (3,600 RB), China (2,200 RB), El Salvador (1,000 RB), and Bahrain (900 RB). Exports of 14,800 RB were down 6 percent from the previous week, but up 15 percent from the prior 4-week average. The destinations were primarily to Pakistan (4,200 RB), India (4,100 RB), Vietnam (1,600 RB), Egypt (900 RB), and Bahrain (900 RB).
Exports for Own Account: For 2019/2020, new exports for own account totaling 18,700 RB were to Indonesia (17,900 RB) and Pakistan (800 RB). Exports for own account totaling 6,500 RB to Indonesia (5,200 RB), Pakistan (800 RB), and Vietnam (500 RB) were applied to new or outstanding sales. Decreases were reported for India (800 RB). The current exports for own account outstanding balance of 39,400 RB is for Indonesia (28,800 RB), Bangladesh (5,300 RB), China (2,500 RB), India (1,700 RB), South Korea (400 RB), Malaysia (400 RB), and Vietnam (300 RB).
· Net sales of 100,000 wet blues for 2020 were down 14 percent from the previous week and 9 percent from the prior 4-week average. Increases were primarily for Vietnam (42,600 unsplit, including decreases of 500 grain splits), China (28,200 unsplit and 6,600 grain splits), Italy (10,900 unsplit and 3,200 grain splits), Thailand (7,900 unsplit), and Mexico (1,100 grain splits). Exports of 129,600 wet blues for 2020 were down 3 percent from the previous week and 12 percent from the prior 4-week average. The destinations were primarily to Vietnam (40,600 unsplit), China (23,900 unsplit and 5,700 grain splits), Italy (25,000 unsplit and 2,000 grain splits), Thailand (26,800 unsplit), and South Korea (3,700 grain splits). Net sales of 16,500 splits resulting in increases primarily for Italy (12,100 pounds) and Vietnam (4,100 pounds), were offset by reductions for South Korea (3,200 pounds). Exports of 248,700 pounds were to Vietnam (200,900 pounds), Italy (42,600 pounds), South Korea (3,600 pounds), and China (1,600 pounds).
· Beef: Net sales of 17,700 MT reported for 2020 were up 38 percent from the previous week and 11 percent from the prior 4-week average. Increases primarily for Japan (5,000 MT, including decreases of 600 MT), South Korea (4,300 MT, including decreases of 300 MT), Taiwan (2,300 MT, including decreases of 100 MT), Mexico (1,500 MT, including decreases of 100 MT), and Hong Kong (1,100 MT, including decreases of 100 MT), were offset by reductions primarily for Honduras (100 MT). Exports of 16,200 MT were down 2 percent from the previous week and 6 from the prior 4-week average. The destinations were primarily to Japan (5,300 MT), South Korea (4,500 MT), Mexico (1,600 MT), Taiwan (1,400 MT), and Canada (1,000 MT).
- Export Adjustments: Accumulated exports of beef to Honduras were adjusted down 89 MT and Bahamas were adjusted down 18 MT for week ending February 27th. These exports were reported in error.
- Pork: For 2020, net sales reductions of 26,600 MT–a marketing-year low–were down noticeably from the previous week and the prior 4-week average. Increases primarily for Canada (6,700 MT), Mexico (5,800 MT), Japan (4,200 MT), Australia (700 MT), and Colombia (600 MT), were more than offset by reductions primarily for China (45,200 MT). Exports of 44,500 MT–a marketing-year high–were up 2 percent from the previous week and 4 percent from the prior 4-week average. The destinations were primarily to China (16,100 MT), Mexico (10,700 MT), Japan (5,300 MT), South Korea (4,100 MT), and Canada (2,600 MT).
U.S. EXPORT SALES FOR WEEK ENDING 3/5/2020
|
|
CURRENT MARKETING YEAR |
NEXT MARKETING YEAR |
||||||
|
COMMODITY |
NET SALES |
OUTSTANDING SALES |
WEEKLY EXPORTS |
ACCUMULATED EXPORTS |
NET SALES |
OUTSTANDING SALES |
||
|
CURRENT YEAR |
YEAR |
CURRENT YEAR |
YEAR |
|||||
|
|
THOUSAND METRIC TONS |
|||||||
|
WHEAT |
|
|
|
|
|
|
|
|
|
HRW |
169.3 |
1,779.4 |
2,425.4 |
165.5 |
6,993.6 |
5,538.2 |
5.0 |
100.1 |
|
SRW |
6.7 |
336.8 |
881.3 |
26.6 |
1,964.1 |
2,121.1 |
3.5 |
81.7 |
|
HRS |
171.6 |
1,606.9 |
1,373.9 |
139.3 |
5,369.5 |
5,000.0 |
20.0 |
142.0 |
|
WHITE |
104.6 |
1,046.0 |
1,037.1 |
115.8 |
3,707.2 |
3,997.6 |
0.0 |
20.9 |
|
DURUM |
0.0 |
148.4 |
109.9 |
0.0 |
679.8 |
360.3 |
0.0 |
111.0 |
|
TOTAL |
452.3 |
4,917.3 |
5,827.6 |
447.3 |
18,714.2 |
17,017.1 |
28.5 |
455.6 |
|
BARLEY |
0.0 |
14.9 |
27.7 |
0.0 |
34.3 |
32.5 |
0.0 |
31.0 |
|
CORN |
1,471.2 |
12,881.3 |
13,842.5 |
851.7 |
15,231.9 |
27,055.1 |
128.1 |
1,601.7 |
|
SORGHUM |
260.2 |
915.9 |
173.7 |
13.2 |
1,083.1 |
708.7 |
0.0 |
33.0 |
|
SOYBEANS |
302.8 |
4,167.5 |
13,804.5 |
567.6 |
30,200.7 |
27,301.8 |
1.4 |
344.8 |
|
SOY MEAL |
171.8 |
3,252.0 |
3,618.7 |
341.5 |
5,078.9 |
5,329.8 |
0.1 |
100.8 |
|
SOY OIL |
24.7 |
257.1 |
157.4 |
13.9 |
500.1 |
373.4 |
0.0 |
0.5 |
|
RICE |
|
|
|
|
|
|
|
|
|
L G RGH |
-1.3 |
376.7 |
374.9 |
15.7 |
879.6 |
669.5 |
0.0 |
0.0 |
|
M S RGH |
8.1 |
50.9 |
15.9 |
0.0 |
17.5 |
24.6 |
0.0 |
0.0 |
|
L G BRN |
0.2 |
13.2 |
6.7 |
1.3 |
35.0 |
28.4 |
0.0 |
0.0 |
|
M&S BR |
0.3 |
69.6 |
83.3 |
2.4 |
38.1 |
57.9 |
0.0 |
0.0 |
|
L G MLD |
3.7 |
60.7 |
64.1 |
34.7 |
647.2 |
574.1 |
0.0 |
0.0 |
|
M S MLD |
31.5 |
194.0 |
172.0 |
8.2 |
385.4 |
322.4 |
0.0 |
0.0 |
|
TOTAL |
42.5 |
765.1 |
716.9 |
62.3 |
2,002.8 |
1,676.8 |
0.0 |
0.0 |
|
COTTON |
|
THOUSAND RUNNING BALES |
||||||
|
UPLAND |
484.2 |
7,057.0 |
6,225.6 |
424.6 |
7,470.1 |
5,996.0 |
160.4 |
1,696.5 |
|
PIMA |
17.3 |
232.8 |
221.5 |
14.8 |
271.7 |
340.2 |
0.0 |
35.3 |
Terry Reilly
Senior Commodity Analyst – Grain and Oilseeds
Futures International │190 S LaSalle St., Suite 410│Chicago, IL 60603
W: 312.604.1366
AIM: fi_treilly
ICE IM: treilly1
Skype: fi.treilly

Trading of futures, options, swaps and other derivatives is risky and is not suitable for all persons. All of these investment products are leveraged, and you can lose more than your initial deposit. Each investment product is offered only to and from jurisdictions where solicitation and sale are lawful, and in accordance with applicable laws and regulations in such jurisdiction. The information provided here should not be relied upon as a substitute for independent research before making your investment decisions. Futures International, LLC is merely providing this information for your general information and the information does not take into account any particular individual’s investment objectives, financial situation, or needs. All investors should obtain advice based on their unique situation before making any investment decision. The contents of this communication and any attachments are for informational purposes only and under no circumstances should they be construed as an offer to buy or sell, or a solicitation to buy or sell any future, option, swap or other derivative. The sources for the information and any opinions in this communication are believed to be reliable, but Futures International, LLC does not warrant or guarantee the accuracy of such information or opinions. Futures International, LLC and its principals and employees may take positions different from any positions described in this communication. Past results are not necessarily indicative of future results.
This email, any information contained herein and any files transmitted with it (collectively, the Material) are the sole property of OTC Global Holdings LP and its affiliates (OTCGH); are confidential, may be legally privileged and are intended solely for the use of the individual or entity to whom they are addressed. Unauthorized disclosure, copying or distribution of the Material, is strictly prohibited and the recipient shall not redistribute the Material in any form to a third party. Please notify the sender immediately by email if you have received this email by mistake, delete this email from your system and destroy any hard copies. OTCGH waives no privilege or confidentiality due to any mistaken transmission of this email.