From: Terry Reilly
Sent: Thursday, June 28, 2018 7:48:05 AM (UTC-06:00) Central Time (US & Canada)
Subject: FI Weekly USDA Export Sales Snapshot 06/28/18
PDF attached
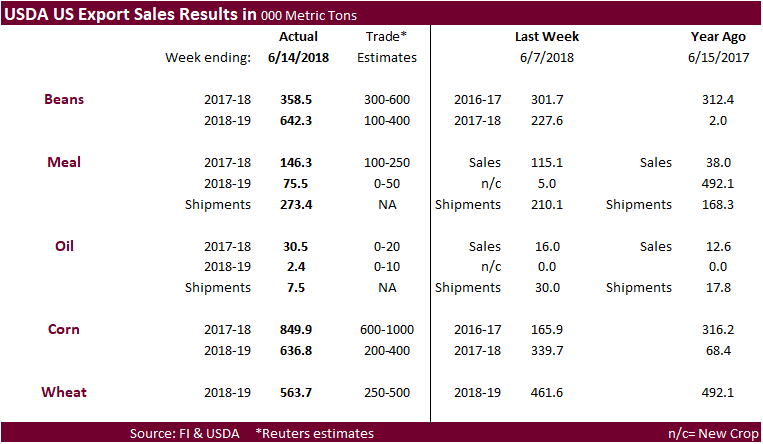
- USDA US corn export sales were good on a combined old and new-crop basis.
- USDA soybean export sales were within expectations for this crop-year and above for new-crop. Iran bought 60k tons (switched from China). There were a few other countries that posted increases that were switched from unknown or China.
- Soybean oil export sales were above expectations for the current marketing year.
- Soybean meal export sales were within expectations.
- All wheat export sales improved from last week to 563,700 tons. HRW amounted to 208.8k and White 117.6k. HRS were 179.1k while soft wheat were only 32.2k.
U.S. EXPORT SALES FOR WEEK ENDING 6/21/2018
|
|
CURRENT MARKETING YEAR |
NEXT MARKETING YEAR |
||||||
|
COMMODITY |
NET SALES |
OUTSTANDING SALES |
WEEKLY EXPORTS |
ACCUMULATED EXPORTS |
NET SALES |
OUTSTANDING SALES |
||
|
CURRENT YEAR |
YEAR |
CURRENT YEAR |
YEAR |
|||||
|
|
THOUSAND METRIC TONS |
|||||||
|
WHEAT |
|
|
|
|
|
|
|
|
|
HRW |
208.8 |
1,067.3 |
1,887.5 |
93.8 |
264.8 |
886.7 |
0.0 |
0.0 |
|
SRW |
32.2 |
499.8 |
718.6 |
31.0 |
160.4 |
128.0 |
0.0 |
0.0 |
|
HRS |
179.1 |
1,549.5 |
1,618.0 |
105.4 |
298.0 |
583.4 |
0.0 |
0.0 |
|
WHITE |
117.6 |
1,215.9 |
1,436.8 |
126.5 |
368.9 |
554.1 |
0.0 |
0.0 |
|
DURUM |
26.0 |
125.8 |
169.3 |
0.0 |
1.6 |
34.8 |
0.0 |
0.0 |
|
TOTAL |
563.7 |
4,458.2 |
5,830.2 |
356.8 |
1,093.7 |
2,187.0 |
0.0 |
0.0 |
|
BARLEY |
0.0 |
46.7 |
26.8 |
0.6 |
2.2 |
2.4 |
0.0 |
0.0 |
|
CORN |
849.9 |
13,601.2 |
9,159.7 |
1,479.9 |
43,651.4 |
46,302.5 |
636.8 |
4,287.7 |
|
SORGHUM |
0.0 |
320.1 |
380.1 |
0.0 |
4,840.0 |
4,051.5 |
0.0 |
38.0 |
|
SOYBEANS |
358.5 |
8,115.8 |
6,755.9 |
500.5 |
48,694.1 |
52,605.1 |
642.3 |
7,523.4 |
|
SOY MEAL |
146.3 |
2,505.3 |
2,130.8 |
273.4 |
8,869.9 |
7,827.2 |
75.5 |
390.8 |
|
SOY OIL |
30.5 |
180.1 |
103.8 |
7.5 |
754.2 |
879.2 |
2.4 |
15.5 |
|
RICE |
|
|
|
|
|
|
|
|
|
L G RGH |
11.0 |
118.7 |
163.5 |
28.6 |
1,121.8 |
1,190.2 |
0.0 |
30.0 |
|
M S RGH |
0.0 |
0.0 |
9.2 |
0.0 |
52.7 |
186.4 |
0.0 |
0.0 |
|
L G BRN |
1.6 |
3.9 |
10.1 |
0.3 |
14.6 |
15.9 |
0.0 |
0.0 |
|
M&S BR |
0.1 |
0.2 |
4.2 |
0.1 |
66.4 |
188.3 |
0.0 |
0.0 |
|
L G MLD |
17.7 |
63.7 |
210.8 |
17.1 |
851.7 |
772.9 |
0.0 |
0.0 |
|
M S MLD |
1.0 |
108.0 |
75.9 |
10.9 |
506.4 |
748.5 |
0.0 |
1.3 |
|
TOTAL |
31.4 |
294.5 |
473.6 |
56.9 |
2,613.6 |
3,102.2 |
0.0 |
31.3 |
|
COTTON |
|
THOUSAND RUNNING BALES |
||||||
|
UPLAND |
-18.9 |
3,057.1 |
2,025.3 |
367.8 |
13,111.3 |
12,340.4 |
196.2 |
5,313.2 |
|
PIMA |
2.3 |
94.6 |
67.8 |
12.7 |
541.6 |
558.8 |
56.4 |
201.1 |
Export Sales Highlights
This summary is based on reports from exporters for the period June 15-21, 2018.
Wheat: Net sales of 563,700 metric tons were reported for delivery in marketing year 2018/2019. Increases were primarily for unknown destinations (205,700 MT), Mexico (86,700 MT, including decreases of 3,600 MT), South Korea (84,800 MT), the Philippines (45,200 MT, including 32,000 MT switched from unknown destinations and decreases of 12,000 MT), and El Salvador (27,700 MT). Reductions were reported for Japan (1,900 MT). Exports of 356,800 MT were reported to the Philippines (101,200 MT), Indonesia (55,000 MT), Mexico (51,700 MT), Japan (35,700 MT), and South Korea (31,600 MT).
Corn: Net sales of 849,900 MT for 2017/2018 were up noticeably from the previous week and up 16 percent from the prior 4-week average. Increases were reported for South Korea (206,700 MT, including 130,000 MT switched from unknown destinations and decreases of 1,000 MT), Mexico (195,200 MT, including decreases of 3,400 MT), Japan (163,600 MT, including 58,300 MT switched from unknown destinations and decreases of 14,900 MT), Colombia (79,600 MT), and Peru (78,200 MT, including decreases of 3,500 MT). Reductions were primarily for unknown destinations (188,100 MT). For 2018/2019, net sales of 636,800 MT were reported for South Korea (132,000 MT), Japan (125,000 MT), Panama (117,000 MT), and Mexico (108,800 MT). Exports of 1,479,900 MT were down 16 percent from the previous week and 9 percent from the prior 4-week average. The destinations were primarily to South Korea (275,500 MT), Mexico (275,100 MT), Japan (237,800 MT), Taiwan (91,500 MT), and Tunisia (84,500 MT).
Optional Origin Sales: For 2017/2018, the current optional origin outstanding balance of 417,000 MT is for South Korea (206,000 MT), unknown destinations (91,000 MT), Saudi Arabia (70,000 MT), and Egypt (50,000 MT). For 2018/2019, the current outstanding balance of 138,000 MT is for Saudi Arabia (70,000 MT) and South Korea (68,000 MT).
Barley: No net sales were reported for the week. Exports of 600 MT were to Japan (500 MT) and Taiwan (100 MT).
Sorghum: There were no net sales or exports reported during the week.
Rice: Net sales of 31,400 MT for 2017/2018 were up noticeably from the previous week, but down 38 percent from the prior 4-week average. Increases reported for Haiti (15,300 MT), Costa Rica (6,000 MT), Honduras (4,200 MT), Canada (3,500 MT, including decreases of 100 MT), and Mexico (1,400 MT, including decreases of 300 MT), were partially offset by reductions for El Salvador (500 MT), Jordan (300 MT), the Dominican Republic (200 MT), and Nicaragua (200 MT). Exports of 56,900 MT were up 57 percent from the previous week, but down 22 percent from the prior 4-week average. The destinations were primarily to Honduras (17,000 MT), Haiti (15,000 MT), Japan (7,900 MT), Mexico (6,400 MT), and Guatemala (5,900 MT).
Soybeans: Net sales of 358,500 MT for 2017/2018 were up 19 percent from the previous week and 14 percent from the prior 4-week average. Increases were reported for Vietnam (79,700 MT, including 65,000 MT switched from unknown destinations), the Netherlands (76,700 MT, including 66,000 MT switched from unknown destinations), Bangladesh (64,000 MT, including 63,000 MT switched from China), Iran (60,000 MT, switched from China), and Peru (34,500 MT, including 35,000 MT switched from unknown destinations and decreases of 500 MT). Reductions were for China (120,000 MT). For 2018/2019, net sales of 642,300 MT were primarily for Pakistan (207,000 MT), Thailand (148,000 MT), and Mexico (135,000 MT). Exports of 500,500 MT were down 50 percent from the previous week and 27 percent from the prior 4-week average. The destinations included the Netherlands (76,700 MT), Vietnam (75,500 MT), China (71,700 MT), Pakistan (69,300 MT), and Mexico (39,900 MT).
Optional Origin Sales: For 2018/2019, the current optional origin outstanding balance of 228,000 MT is for China (165,000 MT) and unknown destinations (63,000 MT).
Export for Own Account: The current outstanding balance of 71,400 MT is for Canada.
Soybean Cake and Meal: Net sales of 146,300 MT for 2017/2018 were up 27 percent from the previous week and from the prior 4-week average. Increases were reported for Mexico (37,200 MT, including decreases of 500 MT), the Philippines (29,600 MT, including decreases of 100 MT), Canada (26,600 MT), Colombia (14,000 MT), and Guatemala (12,000 MT, including 12,900 MT switched from unknown destinations, 2,000 MT switched from Panama, 2,000 MT switched from El Salvador, and decreases of 100 MT). Reductions were reported for unknown destinations (13,100 MT). For 2018/2019, net sales of 75,500 MT were primarily for Panama (48,500 MT), El Salvador (12,000 MT), and Canada (4,200 MT). Exports of 273,400 MT were up 30 percent from the previous week and 19 percent from the prior 4-week average. The primary destinations were the Philippines (71,300 MT), Mexico (32,000 MT), Morocco (31,800 MT), Venezuela (22,000 MT), and Guatemala (21,100 MT).
Soybean Oil: Net sales of 30,500 MT for 2017/2018 were up 91 percent from the previous week and up noticeably from the prior 4-week average. Increases were primarily for Peru (13,900 MT), Mexico (7,600 MT), Jamaica (3,500 MT), Colombia (2,200 MT, including decreases of 2,000 MT), and the Dominican Republic (1,600 MT). For 2018/2019, net sales of 2,400 MT were reported for Mexico. Exports of 7,500 MT were down 75 percent from the previous week and 77 percent from the prior 4-week average. The primary destinations were Guatemala (5,000 MT) and Mexico (2,200 MT).
Cotton: Net sales reductions of 18,900 running bales for 2017/2018 were up 83 percent from the previous week and up 40 percent from the prior 4-week average. Increases were reported for Vietnam (16,800 RB, including 5,400 RB switched from China, 900 RB switched from Taiwan, 400 RB switched from unknown destinations, 300 RB switched from Japan, and decreases of 8,800 RB), India (6,900 RB), Thailand (5,400 RB, including 900 RB switched from Japan), Indonesia (3,000 RB, including 400 RB switched from Japan), and Turkey (2,500 RB, including decreases of 100 RB). Reductions were reported for South Korea (50,100 RB), China (7,200 RB), and Guatemala (1,100 RB). For 2018/2019, net sales of 196,200 RB reported for Vietnam (125,900 RB), Indonesia (50,200 RB), and Turkey (39,700 RB), were partially offset by reductions for China (50,400 RB). Exports of 367,800 RB were up 18 percent from the previous week, but down 15 percent from the prior 4-week average. The primary destinations were Turkey (68,000 RB), Vietnam (67,300 RB), Indonesia (63,500 RB), China (24,800 RB), and Thailand (24,300 RB). Net sales of Pima totaling 2,300 RB for 2017/2018 were up noticeably from the previous week, but down 78 percent from the prior 4-week average. Increases were reported for China (3,100 RB), India (1,300 RB, including decreases of 4,400 RB), Thailand (900 RB), and Vietnam (400 RB, switched from Japan). Reductions were primarily for Egypt (2,600 RB). For 2018/2019, net sales of 56,400 RB were primarily for South Korea (50,200 RB), Egypt (2,600 RB), and Pakistan (1,800 RB). Exports of 12,700 RB were up 72 percent from the previous week and 41 percent from the prior 4-week average. The primary destinations were India (8,800 RB) and China (2,400 RB).
Optional Origin Sales: For 2017/2018, the current optional origin outstanding balance is 8,400 RB, all Indonesia.
Exports for Own Account: New exports for own account totaling 5,000 RB were reported to India. Exports to India were applied to new or outstanding sales. Decreases totaling 5,000 RB were reported for Indonesia. The current outstanding balance of 13,000 RB is for Vietnam (6,300 RB), China (6,200 RB), and Bangladesh (500 RB).
Hides and Skins: Net sales of 347,800 pieces reported for 2018 were down 32 percent from the previous week and from the prior 4-week average. Whole cattle hide sales totaling 348,100 were primarily for China (182,800 pieces, including decreases of 15,700 pieces), South Korea (98,300 pieces, including decreases of 12,200 pieces), Taiwan (23,300 pieces, including decreases of 200 pieces), Thailand (19,500 pieces, including decreases of 2,500 pieces), and Mexico (19,100 pieces). Reductions were reported for Spain (900 pieces). Exports of 391,500 pieces for 2018 were up 17 percent from the previous week and 2 percent from the prior 4-week average. Whole cattle hide exports of 387,700 pieces were primarily to China (207,200 pieces), Thailand (64,600 pieces), South Korea (61,300 pieces), Mexico (26,800 pieces), and Indonesia (7,100 pieces).
Net sales of 137,700 wet blues for 2018 were up 11 percent from the previous week, but down 24 percent from the prior 4-week average. Increases were reported for Vietnam (56,200 unsplit), China (51,300 unsplit), the Dominican Republic (20,000 unsplit), Thailand (4,900 unsplit), and Italy (4,400 unsplit and 200 grain splits). Reductions were reported for China (1,600 grain splits) and Mexico (200 grain splits). Exports of 126,000 wet blues for 2018 were down 13 percent from the previous week and 27 percent from the prior 4-week average. The primary destinations were China (39,700 unsplit), Italy (29,600 unsplit), Vietnam (27,600 unsplit), and Thailand (20,400 unsplit). Net sales splits totaling 635,300 pounds for 2018 were down 1 percent from the previous week and 63 percent from the prior 4-week average. The destinations were Vietnam (485,300 pounds) and China (150,000 pounds). Exports of 510,300 pounds were up 6 percent from the previous week, but down 37 percent from the prior 4-week average. The destinations were Vietnam (210,300 pounds), South Korea (200,000 pounds), and China (100,000 pounds).
Beef: Net sales of 18,400 MT for 2018 were up 10 percent from the previous week, but down 14 percent from the prior 4-week average. Increases were primarily for Japan (10,100 MT, including decreases of 3,200 MT), South Korea (3,900 MT, including decreases of 700 MT), Taiwan (1,400 MT), Canada (1,000 MT, including decreases of 100 MT), and Hong Kong (1,000 MT, including decreases of 100 MT). Reductions were reported for China (100 MT). Exports of 18,200 MT were down 2 percent from the previous week, but up 5 percent from the prior 4-week average. The primary destinations were Japan (6,900 MT), South Korea (5,000 MT), Mexico (1,800 MT), Canada (1,400 MT), and Taiwan (1,200 MT).
Pork: Net sales of 24,300 MT for 2018 were up noticeably from the previous week and up 77 percent from the prior 4-week average. Increases were reported for Mexico (12,000 MT), Japan (3,100 MT), South Korea (2,400 MT), Australia (1,900 MT), and Canada (1,800 MT). Exports of 14,700 MT were down 25 percent from the previous week and 28 percent from the prior 4-week average. The primary destinations were Mexico (5,700 MT), Japan (2,400 MT), Hong Kong (1,200 MT), South Korea (1,100 MT), and Australia (800 MT).
June 28, 2018 1 FOREIGN AGRICULTURAL SERVICE/USDA
SUMMARY OF EXPORT TRANSACTION
REPORTED UNDER THE DAILY REPORTING SYSTEM
FOR PERIOD ENDING JUNE 21, 2018
COMMODITY DESTINATION QUANTITY MARKETING YEAR
CORN MEXICO 30,000 MT 1/ 2017/2018
CORN MEXICO 101,300 MT 1/ 2018/2019
CORN PANAMA 117,000 MT 1/ 2018/2019
1/ Export sales.
Terry Reilly
Senior Commodity Analyst – Grain and Oilseeds
Futures International │190 S LaSalle St., Suite 410│Chicago, IL 60603
W: 312.604.1366
AIM: fi_treilly
ICE IM: treilly1
Skype: fi.treilly

Trading of futures, options, swaps and other derivatives is risky and is not suitable for all persons. All of these investment products are leveraged, and you can lose more than your initial deposit. Each investment product is offered only to and from jurisdictions where solicitation and sale are lawful, and in accordance with applicable laws and regulations in such jurisdiction. The information provided here should not be relied upon as a substitute for independent research before making your investment decisions. Futures International, LLC is merely providing this information for your general information and the information does not take into account any particular individual’s investment objectives, financial situation, or needs. All investors should obtain advice based on their unique situation before making any investment decision. The contents of this communication and any attachments are for informational purposes only and under no circumstances should they be construed as an offer to buy or sell, or a solicitation to buy or sell any future, option, swap or other derivative. The sources for the information and any opinions in this communication are believed to be reliable, but Futures International, LLC does not warrant or guarantee the accuracy of such information or opinions. Futures International, LLC and its principals and employees may take positions different from any positions described in this communication. Past results are not necessarily indicative of future results.