From: Terry Reilly
Sent: Friday, July 06, 2018 7:47:12 AM (UTC-06:00) Central Time (US & Canada)
Subject: FI Weekly USDA Export Sales Snapshot 07/06/18
PDF attached
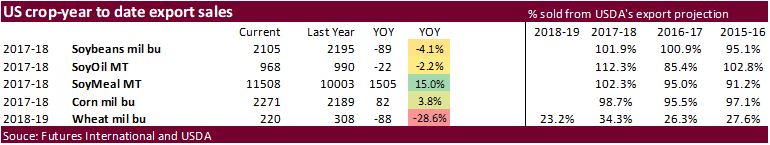
USDA export sales were ok for the complex, poor for corn and ok for wheat.
· 34 billion USD of trade tariffs against China were confirmed. President Trump warned more will be added, possibly up to $550 billion. China responded by adding $34 billion.
· US stocks are higher, USD is lower, WTI crude lower, and gold lower, at the time this was written.
· China’s Commerce Min: Lodges a Case Against US At WTO
· US Non Farm Pay Rolls June: 213k (est 195k prev 223k)
· US Unemployment Rate June: 4.0% (est 3.8% prev 3.8%)
· US Average Hourly Earnings June M/M: 0.2% (est 0.3% prev 0.3%)
· US Average Hourly Earnings June Y/Y: 2.7% (est 2.8% prev 2.7%)
· US Change In Manufacturing Payrolls June: 36k (est 15k prev R 19k)
· US Change In Private Payrolls June: 202k (est 190k prev R 239k)
· US Labor Force Participation Rate June: 62.9% (est 62.7% prev 62.7%)
· US Trade Balance May: -43.1B (est -$43.7B prev R $46.1B)
· China sold 814,003 tons of corn out of state reserves, at an average price of 1423 yuan per ton ($213.97/ton), 21 percent of the corn offered. Yesterday China sold 1.088 million tons of corn out of state reserves, at an average price of 1529 yuan per ton ($230.47/ton), 27 percent of the corn offered.
· Day one of the US import tariffs. $34 billion for both sides.
· CBOT soybeans briefly hit fresh contract lows overnight but rebounded on light strength in soybean meal.
· China’s Ministry of Agriculture and Rural Affairs published a document on exploring ways to reduce the use of soybean meal in animal feed.
· Reuters shows Brazil soybeans at a $1.60/bu premium over US but prices need to widen to $2.00/bu in order to attract China to buy US soybeans. Feedback welcome.
· Offshore values were leading soybean oil 3 points higher (57 higher for the week to date) and meal $0.30/short ton higher ($3.20 higher for the week).
· French wheat and barley conditions declined from the previous week.
Export Sales Highlights
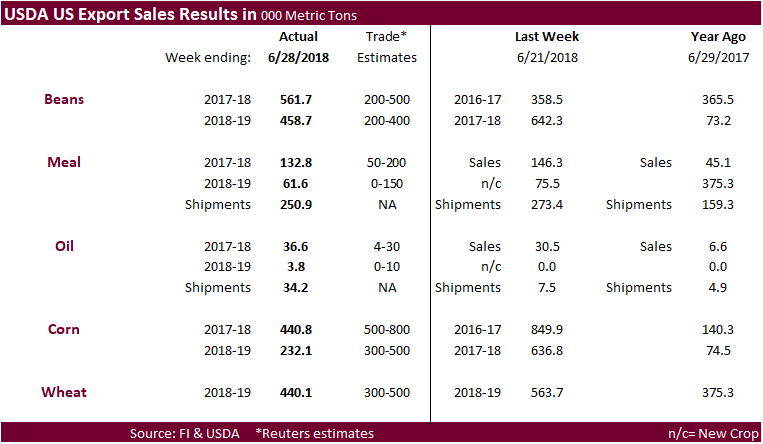
This summary is based on reports from exporters for the period June 22-28, 2018.
Wheat: Net sales of 440,100 metric tons were reported for delivery in marketing year 2018/2019. Increases were primarily for Taiwan (97,600 MT), Mexico (88,300 MT, including decreases of 200 MT), Japan (53,200 MT), unknown destinations (49,200 MT), and Chile (40,000 MT). Reductions were reported for the United Kingdom (7,900 MT), Jamaica (1,700 MT), and Belize (700 MT). Exports of 387,100 MT were reported to South Korea (63,000 MT), Thailand (49,500 MT), the Philippines (49,500 MT), Taiwan (49,300 MT), and Mexico (45,900 MT).
Corn: Net sales of 440,700 MT for 2017/2018 were down 48 percent from the previous week and 37 percent from the prior 4-week average. Increases were reported for Mexico (144,800 MT, including decreases of 3,600 MT), Egypt (109,200 MT, including 111,000 MT switched from Spain and decreases of 1,800 MT), Vietnam (75,100 MT, including 68,000 MT switched from unknown destinations), Colombia (74,200 MT, including 29,000 MT switched from unknown destinations and decreases of 2,200 MT), and Saudi Arabia (71,900 MT). Reductions were primarily for unknown destinations (228,800 MT), Spain (52,100 MT), and France (20,500 MT). For 2018/2019, net sales of 232,100 MT were reported for Guatemala (91,100 MT), Mexico (45,700 MT), Japan (31,000 MT), and unknown destinations (25,400 MT). Exports of 1,514,800 MT were up 2 percent from the previous week, but down 1 percent from the prior 4-week average. The destinations were primarily to Mexico (394,300 MT), Japan (200,200 MT), Taiwan (155,400 MT), South Korea (138,400 MT), and Egypt (127,200 MT).
Optional Origin Sales: For 2017/2018, options were exercised to export 70,000 MT to Saudi Arabia from the United States. Decreases of 10,000 MT were reported for Egypt. The current optional origin outstanding balance of 337,000 MT is for South Korea (206,000 MT), unknown destinations (91,000 MT), and Egypt (40,000 MT). For 2018/2019, new optional origin sales of 50,000 MT were reported for unknown destinations. The current outstanding balance of 188,000 MT is for Saudi Arabia (70,000 MT), South Korea (68,000 MT), and unknown destinations (50,000 MT).
Barley: No net sales were reported for the week. Exports of 1,400 MT were to Japan (1,200 MT) and Taiwan (200 MT).
Sorghum: Net sales of 37,200 MT, for 2017/2018 resulted as increases for Mexico (38,000 MT) and South Africa (9,200 MT, switched from unknown destinations), were partially offset by reductions for unknown destinations (10,000 MT). Exports of 9,200 MT were to South Africa.
Rice: Net sales of 27,100 MT for 2017/2018 were down 14 percent from the previous week and 50 percent from the prior 4-week average. Increases were reported for Colombia (17,500 MT), Honduras (4,400 MT), Canada (2,100 MT, including decreases of 400 MT), Jordan (600 MT), and Guatemala (600 MT). For 2018/2019, net sales of 13,500 MT were reported for Venezuela. Exports of 37,300 MT were down 34 percent from the previous week and 53 percent from the prior 4-week average. The destinations were primarily to Mexico (28,500 MT), Canada (2,600 MT), El Salvador (1,800 MT), Japan (1,300 MT), and Saudi Arabia (700 MT).
Soybeans: Net sales of 561,600 MT for 2017/2018 were up 57 percent from the previous week and 78 percent from the prior 4-week average. Increases were reported for the Netherlands (162,100 MT, including 132,000 MT switched from unknown destinations), Pakistan (134,700, including 65,000 MT switched from unknown destinations, 60,000 MT switched from China, and decreases of 300 MT), Bangladesh (109,300 MT, including 60,000 MT switched from China, 55,000 MT switched from unknown destinations, and decreases of 6,700 MT), Japan (80,400 MT, including 65,100 MT switched from unknown destinations and decreases of 200 MT), and Germany (79,600 MT). Reductions were for China (366,000 MT). For 2018/2019, net sales of 458,700 MT reported for Mexico (193,600 MT), unknown destinations (187,500 MT), Vietnam (60,500 MT), and Thailand (35,100 MT), were partially offset by reductions for China (66,000 MT). Exports of 937,800 MT were up 87 percent from the previous week and 49 percent from the prior 4-week average. The destinations included the Netherlands (162,100 MT), Mexico (154,500 MT), Pakistan (137,700 MT), Bangladesh (108,300 MT), and Japan (104,700 MT).
Optional Origin Sales: For 2018/2019, the current optional origin outstanding balance of 228,000 MT is for China (165,000 MT) and unknown destinations (63,000 MT).
Export for Own Account: New exports for own account totaling 29,800 MT were reported to Canada. The current outstanding balance of 101,200 MT is for Canada.
Export Adjustment: Accumulated exports of soybeans to the Netherlands were adjusted down 79,601 MT for week ending June 4th. The correct destination is Germany and is included in this week’s report.
Soybean Cake and Meal: Net sales of 132,800 MT for 2017/2018 were down 9 percent from the previous week, but up 14 percent from the prior 4-week average. Increases were reported for the Philippines (31,600 MT), Ecuador (30,800 MT), Portugal (27,500 MT, including 28,000 MT switched from unknown destinations and decreases of 500 MT), Mexico (17,100 MT, including decreases of 100 MT), and Colombia (10,300 MT, including decreases of 900 MT). Reductions were reported for unknown destinations (25,000 MT). For 2018/2019, net sales of 61,600 MT were primarily for Guatemala (44,200 MT) and Mexico (8,100 MT). Exports of 250,900 MT were down 8 percent from the previous week, but up 1 percent from the prior 4-week average. The primary destinations were the Philippines (49,500 MT), Venezuela (30,000 MT), Portugal (27,500 MT), Mexico (20,900 MT), and Canada (19,100 MT).
Soybean Oil: Net sales of 36,600 MT for 2017/2018 were up 20 percent from the previous week and up noticeably from the prior 4-week average. Increases were primarily for South Korea (13,000 MT), unknown destinations (12,300 MT), Venezuela (5,000 MT), Guatemala (3,000 MT), and Mexico (1,400 MT). For 2018/2019, net sales of 3,800 MT were reported for Mexico. Exports of 34,200 MT were up noticeably from the previous week and up 48 percent from the prior 4-week average. The primary destinations were South Korea (15,300 MT), Guatemala (6,600 MT), the Dominican Republic (4,200 MT), Jamaica (3,500 MT), and Colombia (2,500 MT).
Export Adjustment: Accumulated exports of soybean oil to Colombia were adjusted down 3,000 MT for week ending May 24th. This export was reported in error.
Cotton: Net sales of 18,000 running bales for 2017/2018 were down noticeably from the previous week and from the prior 4-week average. Increases were reported for Turkey (17,700 RB, including decreases of 600 RB), Vietnam (8,000 RB, including 11,000 RB switched from China, 2,000 RB switched from South Korea, 300 RB switched from Japan, and decreases of 13,800 RB), Egypt (6,500 RB, including decreases of 100 RB), Taiwan (4,400 RB, including decreases of 200 RB), and India (2,000 RB, including decreases of 200 RB). Reductions were reported for China (8,100 RB), Thailand (7,200 RB), and Mexico (4,200 RB). For 2018/2019, net sales of 268,200 RB reported for Indonesia (67,300 RB), South Korea (59,100 RB), Mexico (43,900 RB), and Vietnam (40,700 RB), were partially offset by reductions for Japan (900 RB). Exports of 411,600 RB were up 12 percent from the previous week, but down 4 percent from the prior 4-week average. The primary destinations were Turkey (69,900 RB), Vietnam (66,600 RB), Indonesia (66,500 RB), Bangladesh (45,200 RB), and China (31,400 RB). Net sales of Pima totaling 1,000 RB for 2017/2018 were down 55 percent from the previous week and 82 percent from the prior 4-week average. Increases were reported for Vietnam (2,600 RB), Turkey (2,500 RB), and Thailand (1,700 RB). Reductions were for China (6,100 RB). For 2018/2019, net sales reductions of 33,400 RB resulted as increases for China (11,100 RB), Pakistan (3,000 RB), and India (2,600 RB), were more than offset by reductions for South Korea (50,200 RB). Exports of 12,100 RB were down 5 percent from the previous week, but up 28 percent from the prior 4-week average. The primary destinations were China (3,500 RB), India (2,400 RB), and Vietnam (2,200 RB).
Optional Origin Sales: For 2017/2018, options were exercised to export 600 RB to Indonesia from the United States. The current optional origin outstanding balance is 7,800 RB, all Indonesia.
Exports for Own Account: The current outstanding balance of 13,000 RB is for Vietnam (6,300 RB), China (6,200 RB), and Bangladesh (500 RB).
Hides and Skins: Net sales of 398,800 pieces reported for 2018 were up 15 percent from the previous week, but down 11 percent from the prior 4-week average. Whole cattle hide sales totaling 394,800 pieces were primarily for Thailand (140,600 pieces, including decreases of 9,200 pieces), China (105,100 pieces, including decreases of 24,300 pieces), South Korea (76,500 pieces, including decreases of 3,100 pieces), Indonesia (34,600 pieces, including decreases of 300 pieces), and Mexico (19,300 pieces, including decreases of 1,400 pieces). Exports of 383,000 pieces for 2018 were down 2 percent from the previous week and 3 percent from the prior 4-week average. Whole cattle hide exports of 375,300 pieces were primarily to China (182,400 pieces), South Korea (64,600 pieces), Thailand (61,800 pieces), Mexico (30,400 pieces), and Taiwan (12,500 pieces).
Net sales of 90,300 wet blues for 2018 were down 34 percent from the previous week and 42 percent from the prior 4-week average. Increases were reported for China (44,500 unsplit and 200 grain splits), Mexico (12,000 grain splits and 7,000 unsplit), Vietnam (15,100 unsplit), Italy (6,900 unsplit), and India (4,800 grain splits). Reductions were reported for the Dominican Republic (100 unsplit) and Thailand (100 grain splits). Exports of 147,100 wet blues for 2018 were up 17 percent from the previous week, but down 9 percent from the prior 4-week average. The primary destinations were China (46,000 unsplit and 2,000 grain split), Vietnam (39,300 unsplit), Italy (16,300 unsplit and 4,800 grain splits), and Thailand (11,100 grain splits and 8,300 unsplit). Net sales splits totaling 256,600 pounds for 2018 were down 60 percent from the previous week and 80 percent from the prior 4-week average. The destination of Vietnam (256,900 pounds), was partially offset by a reduction for Mexico (300 pounds). Exports of 395,300 pounds were down 23 percent from the previous week and 38 percent from the prior 4-week average. The destinations were Vietnam (292,300 pounds), China (100,000 pounds), and Mexico (3,000 pounds).
Beef: Net sales of 12,900 MT for 2018 were down 30 percent from the previous week and 29 percent from the prior 4-week average. Increases were primarily for Japan (3,700 MT, including decreases of 1,800 MT), Hong Kong (2,700 MT, including decreases of 100 MT), Taiwan (1,800 MT, including decreases of 100 MT), Mexico (1,600 MT, including decreases of 100 MT), and South Korea (1,400 MT, including decreases of 500 MT). Reductions were reported for Chile (100 MT). Exports of 18,500 MT were up 1 percent from the previous week and 6 percent from the prior 4-week average. The primary destinations were Japan (6,800 MT), South Korea (5,100 MT), Mexico (1,800 MT), Taiwan (1,500 MT), and Canada (1,300 MT).
Pork: Net sales of 16,500 MT for 2018 were down 32 percent from the previous week, but up 15 percent from the prior 4-week average. Increases were reported for Mexico (3,900 MT), Hong Kong (2,700 MT), South Korea (2,600 MT), Canada (2,500 MT), and Japan (1,700 MT). Exports of 20,300 MT were up 38 percent from the previous week and 7 percent from the prior 4-week average. The primary destinations were Mexico (7,800 MT), Japan (3,900 MT), South Korea (1,900 MT), Canada (1,900 MT), and Australia (1,200 MT).
July 6, 2018 1 FOREIGN AGRICULTURAL SERVICE/USDA
SUMMARY OF EXPORT TRANSACTION
REPORTED UNDER THE DAILY REPORTING SYSTEM
FOR PERIOD ENDING JUNE 28, 2018
COMMODITY DESTINATION QUANTITY MARKETING YEAR
SOYBEANS MEXICO 130,632 MT 1/ 2018/2019
SOYBEANS UNKNOWN 186,000 MT 1/ 2017/2018
1/ Export sales.
U.S. EXPORT SALES FOR WEEK ENDING 6/28/2018
|
|
CURRENT MARKETING YEAR |
NEXT MARKETING YEAR |
||||||
|
COMMODITY |
NET SALES |
OUTSTANDING SALES |
WEEKLY EXPORTS |
ACCUMULATED EXPORTS |
NET SALES |
OUTSTANDING SALES |
||
|
CURRENT YEAR |
YEAR |
CURRENT YEAR |
YEAR |
|||||
|
|
THOUSAND METRIC TONS |
|||||||
|
WHEAT |
|
|
|
|
|
|
|
|
|
HRW |
136.6 |
1,117.2 |
1,811.4 |
86.6 |
351.4 |
1,080.8 |
0.0 |
0.0 |
|
SRW |
85.8 |
545.6 |
721.6 |
40.0 |
200.5 |
170.9 |
0.0 |
0.0 |
|
HRS |
83.6 |
1,489.0 |
1,519.3 |
144.1 |
442.1 |
783.0 |
0.0 |
0.0 |
|
WHITE |
133.1 |
1,233.7 |
1,463.5 |
115.4 |
484.3 |
639.8 |
0.0 |
0.0 |
|
DURUM |
1.0 |
125.8 |
148.5 |
1.0 |
2.6 |
53.5 |
0.0 |
0.0 |
|
TOTAL |
440.1 |
4,511.2 |
5,664.4 |
387.1 |
1,480.8 |
2,728.1 |
0.0 |
0.0 |
|
BARLEY |
0.0 |
45.3 |
26.5 |
1.4 |
3.6 |
3.4 |
0.0 |
0.0 |
|
CORN |
440.7 |
12,527.1 |
8,191.1 |
1,514.8 |
45,166.2 |
47,411.4 |
232.1 |
4,519.9 |
|
SORGHUM |
37.2 |
348.1 |
437.8 |
9.2 |
4,849.2 |
4,065.3 |
0.0 |
38.0 |
|
SOYBEANS |
561.6 |
7,739.6 |
6,842.8 |
937.8 |
49,552.3 |
52,883.8 |
458.7 |
7,982.2 |
|
SOY MEAL |
132.8 |
2,387.2 |
2,016.7 |
250.9 |
9,120.8 |
7,986.4 |
61.6 |
452.4 |
|
SOY OIL |
36.6 |
182.5 |
105.5 |
34.2 |
785.4 |
884.1 |
3.8 |
19.3 |
|
RICE |
|
|
|
|
|
|
|
|
|
L G RGH |
22.6 |
111.5 |
228.2 |
29.8 |
1,151.7 |
1,204.9 |
13.5 |
43.5 |
|
M S RGH |
0.0 |
0.0 |
9.4 |
0.0 |
52.7 |
186.4 |
0.0 |
0.0 |
|
L G BRN |
-0.3 |
3.4 |
10.0 |
0.2 |
14.8 |
16.0 |
0.0 |
0.0 |
|
M&S BR |
0.1 |
0.2 |
4.1 |
0.1 |
66.5 |
188.4 |
0.0 |
0.0 |
|
L G MLD |
2.4 |
63.0 |
218.6 |
3.1 |
854.8 |
790.6 |
0.0 |
0.0 |
|
M S MLD |
2.3 |
106.2 |
47.7 |
4.1 |
510.4 |
780.2 |
0.0 |
1.3 |
|
TOTAL |
27.1 |
284.3 |
518.0 |
37.3 |
2,651.0 |
3,166.4 |
13.5 |
44.8 |
|
COTTON |
|
THOUSAND RUNNING BALES |
||||||
|
UPLAND |
18.0 |
2,663.5 |
1,917.0 |
411.6 |
13,522.9 |
12,642.9 |
268.2 |
5,581.4 |
|
PIMA |
1.0 |
83.5 |
65.5 |
12.1 |
553.7 |
562.8 |
-33.4 |
167.7 |
Terry Reilly
Senior Commodity Analyst – Grain and Oilseeds
Futures International │190 S LaSalle St., Suite 410│Chicago, IL 60603
W: 312.604.1366
AIM: fi_treilly
ICE IM: treilly1
Skype: fi.treilly

Trading of futures, options, swaps and other derivatives is risky and is not suitable for all persons. All of these investment products are leveraged, and you can lose more than your initial deposit. Each investment product is offered only to and from jurisdictions where solicitation and sale are lawful, and in accordance with applicable laws and regulations in such jurisdiction. The information provided here should not be relied upon as a substitute for independent research before making your investment decisions. Futures International, LLC is merely providing this information for your general information and the information does not take into account any particular individual’s investment objectives, financial situation, or needs. All investors should obtain advice based on their unique situation before making any investment decision. The contents of this communication and any attachments are for informational purposes only and under no circumstances should they be construed as an offer to buy or sell, or a solicitation to buy or sell any future, option, swap or other derivative. The sources for the information and any opinions in this communication are believed to be reliable, but Futures International, LLC does not warrant or guarantee the accuracy of such information or opinions. Futures International, LLC and its principals and employees may take positions different from any positions described in this communication. Past results are not necessarily indicative of future results.