From: Terry Reilly
Sent: Thursday, August 16, 2018 7:45:28 AM (UTC-06:00) Central Time (US & Canada)
Subject: FI Weekly USDA Export Sales Snapshot 08/16/18
PDF attached
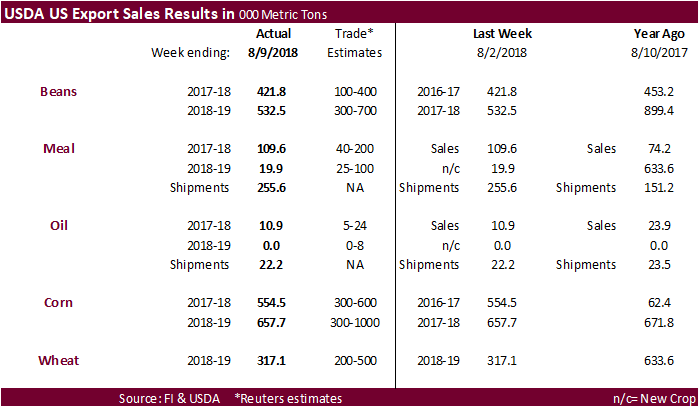
USDA Export Sales were within expectations for corn, soybeans, soybean meal, soybean oil, and wheat.
U.S. EXPORT SALES FOR WEEK ENDING 8/9/2018
|
|
CURRENT MARKETING YEAR |
NEXT MARKETING YEAR |
||||||
|
COMMODITY |
NET SALES |
OUTSTANDING SALES |
WEEKLY EXPORTS |
ACCUMULATED EXPORTS |
NET SALES |
OUTSTANDING SALES |
||
|
CURRENT YEAR |
YEAR |
CURRENT YEAR |
YEAR |
|||||
|
|
THOUSAND METRIC TONS |
|||||||
|
WHEAT |
|
|
|
|
|
|
|
|
|
HRW |
380.7 |
1,166.5 |
1,663.9 |
139.7 |
1,041.1 |
2,402.2 |
0.0 |
0.0 |
|
SRW |
107.6 |
579.3 |
607.7 |
79.6 |
497.3 |
520.6 |
0.0 |
0.0 |
|
HRS |
158.4 |
1,406.2 |
1,415.8 |
99.4 |
1,177.1 |
1,580.2 |
0.0 |
0.0 |
|
WHITE |
142.4 |
1,196.5 |
1,444.3 |
143.0 |
1,060.4 |
1,323.4 |
0.0 |
0.0 |
|
DURUM |
14.0 |
164.8 |
101.9 |
0.0 |
27.7 |
101.3 |
0.0 |
0.0 |
|
TOTAL |
803.0 |
4,513.2 |
5,233.6 |
461.6 |
3,803.6 |
5,927.6 |
0.0 |
0.0 |
|
BARLEY |
0.0 |
37.9 |
29.9 |
0.0 |
11.2 |
6.4 |
0.0 |
0.0 |
|
CORN |
339.0 |
6,849.3 |
3,482.5 |
1,220.0 |
53,411.1 |
52,990.7 |
1,044.8 |
8,858.5 |
|
SORGHUM |
30.1 |
149.4 |
227.6 |
0.0 |
4,927.3 |
4,621.4 |
0.0 |
0.0 |
|
SOYBEANS |
133.4 |
4,717.7 |
5,107.7 |
586.6 |
53,970.8 |
56,012.4 |
571.6 |
11,477.6 |
|
SOY MEAL |
207.2 |
1,692.7 |
1,310.9 |
210.7 |
10,546.0 |
8,911.4 |
147.3 |
846.2 |
|
SOY OIL |
4.8 |
133.3 |
84.5 |
17.1 |
898.5 |
1,019.8 |
0.3 |
39.4 |
|
RICE |
|
|
|
|
|
|
|
|
|
L G RGH |
16.1 |
157.1 |
190.1 |
31.4 |
31.4 |
24.1 |
0.0 |
0.0 |
|
M S RGH |
0.0 |
0.0 |
10.4 |
0.0 |
0.0 |
0.0 |
0.0 |
0.0 |
|
L G BRN |
1.1 |
1.9 |
1.1 |
0.7 |
0.7 |
0.1 |
0.0 |
0.0 |
|
M&S BR |
0.1 |
0.3 |
4.1 |
0.1 |
0.1 |
0.1 |
0.0 |
0.0 |
|
L G MLD |
8.7 |
85.9 |
177.7 |
8.6 |
10.9 |
22.3 |
0.0 |
0.0 |
|
M S MLD |
1.5 |
49.1 |
43.5 |
3.4 |
29.5 |
8.0 |
0.0 |
0.0 |
|
TOTAL |
27.6 |
294.3 |
426.9 |
44.2 |
72.7 |
54.6 |
0.0 |
0.0 |
|
COTTON |
|
THOUSAND RUNNING BALES |
||||||
|
UPLAND |
77.7 |
8,039.4 |
5,815.3 |
240.3 |
283.4 |
314.3 |
-11.7 |
1,316.3 |
|
PIMA |
2.8 |
219.5 |
185.4 |
4.6 |
10.2 |
9.3 |
0.0 |
24.9 |
Export Sales Highlights
This summary is based on reports from exporters for the period August 3-9, 2018.
Wheat: Net sales of 803,000 MT for 2018/2019–a marketing-year high–were up noticeably from the previous week and from the prior 4-week average. Increases were reported for Mexico (247,800 MT, including decreases of 100 MT), the Philippines (177,900 MT, including 60,000 MT switched from unknown destinations), Nigeria (140,000 MT), Japan (60,500 MT, including decreases of 16,000 MT), and Thailand (24,100 MT, including 24,000 MT switched from unknown destinations). Exports of 461,600 MT–a marketing-year high–were up 34 percent from the previous week and 17 percent from the prior 4-week average. The destinations were primarily to Mexico (101,300 MT), Japan (84,100 MT), the Philippines (65,900 MT), South Korea (55,200 MT), and Iraq (52,500 MT).
Corn: Net sales of 339,000 MT for 2017/2018 were down 39 percent from the previous week and 26 percent from the prior 4-week average. Increases were reported for Japan (263,100 MT, including 50,800 MT switched from unknown destinations), Colombia (133,300 MT, including 125,000 MT switched from unknown destinations and decreases of 3,100 MT), Mexico (61,400 MT, including decreases of 14,900 MT), Peru (43,300 MT, including 38,000 MT switched from unknown destinations and decreases of 600 MT), and El Salvador (13,300 MT). Reductions were primarily for unknown destinations (157,700 MT) and Vietnam (60,000 MT). For 2018/2019, net sales of 1,044,800 MT were reported for unknown destinations (320,000 MT), Mexico (298,100 MT), South Korea (126,000 MT), Japan (70,500 MT), and Taiwan (58,600 MT). Exports of 1,220,000 MT were down 15 percent from the previous week and 13 percent from the prior 4-week average. The destinations were primarily to Mexico (463,100 MT), Japan (290,700 MT), Colombia (147,200 MT), Peru (109,700 MT), and Egypt (44,000 MT).
Optional Origin Sales: For 2018/2019, new optional origin sales were reported for unknown destinations (244,000 MT) and Malaysia (55,000 MT). Decreases totaling 54,000 MT were reported for unknown destinations. The current outstanding balance of 965,000 MT is for unknown destinations (298,000 MT), South Korea (412,000 MT), Vietnam (130,000 MT), Saudi Arabia (70,000 MT), and Malaysia (55,000 MT).
Barley: There were no net sales or exports reported during the week.
Sorghum: Net sales of 30,100 MT for 2017/2018 were for Spain (30,000 MT) and South Korea (100 MT). There were no exports reported during the week.
Rice: Net sales of 27,600 MT for 2018/2019 were reported for Costa Rica (10,700 MT), Saudi Arabia (5,200 MT), Mexico (3,600 MT), Canada (3,600 MT), and Honduras (3,100 MT). Reductions were reported for Jordan (200 MT) and Panama (100 MT). Exports of 44,200 MT were primarily to Mexico (25,900 MT), El Salvador (5,300 MT), Canada (4,300 MT), Haiti (1,700 MT), and Panama (1,500 MT).
Exports for Own Account: The current exports for own account outstanding balance is 100 MT, all Canada.
Soybeans: Net sales of 133,400 MT for 2017/2018 were down 68 percent from the previous week and 52 percent from the prior 4-week average. Increases were reported for Iran (133,500 MT, including 131,000 MT switched from unknown destinations), the Netherlands (108,600 MT, including 95,500 MT switched from unknown destinations), Peru (19,900 MT, switched from unknown destinations and decreases of 100 MT), Colombia (18,200 MT, including 14,000 MT switched from unknown destinations), and Indonesia (18,000 MT, including decreases of 200 MT). Reductions were for unknown destinations (205,500 MT) and China (3,000 MT). For 2018/2019, net sales of 571,600 MT were reported for unknown destinations (373,200 MT), Mexico (102,000 MT), Turkey (30,000 MT), and Canada (20,000 MT). Exports of 586,600 MT were down 42 percent from the previous week and 24 percent from the prior 4-week average. The destinations included Iran (133,500 MT), the Netherlands (108,600 MT), Mexico (98,300 MT), China (63,300 MT), and Argentina (33,000 MT).
Optional Origin Sales: For 2017/2018, the current optional origin outstanding balance of 66,000 MT is for unknown destinations. For 2018/2019, the current outstanding balance of 63,000 MT is for unknown destinations.
Export for Own Account: The current exports for own account outstanding balance is 130,900 MT, all Canada.
Soybean Cake and Meal: Net sales of 207,200 MT for 2017/2018 were up 89 percent from the previous week and 71 percent from the prior 4-week average. Increases were reported for Colombia (48,000 MT), the Philippines (47,200 MT), Romania (32,300 MT, including 30,000MT switched from unknown destinations), Morocco (25,700 MT), and Mexico (24,300 MT, including decreases of 100 MT). Reductions were reported for unknown destinations (28,400 MT), El Salvador (2,100 MT), and Costa Rica (2,000 MT). For 2018/2019, net sales of 147,300 MT reported for the Philippines (135,900 MT), Jamaica (6,000 MT), and Canada (5,500 MT), were partially offset by reductions for Mexico (100 MT). Exports of 210,700 MT were down 18 percent from the previous week and 21 percent from the prior 4-week average. The primary destinations were the Philippines (48,300 MT), Romania (32,300 MT), Morocco (31,000 MT), Colombia (25,000 MT), and the Dominican Republic (16,900 MT).
Soybean Oil: Net sales of 4,800 MT for 2017/2018 were down 56 percent from the previous week and 39 percent from the prior 4-week average. Increases were primarily for Colombia (2,500 MT), Mexico (1,400 MT), and Nicaragua (800 MT). For 2018/2019, net sales of 300 MT were reported for Canada. Exports of 17,100 MT were down 23 percent from the previous week and 25 percent from the prior 4-week average. The primary destinations were the Dominican Republic (13,600 MT) and Mexico (3,000 MT).
Cotton: Net sales of 77,700 RB for 2018/2019 were reported for Vietnam (24,600 RB), Pakistan (16,900 RB), Indonesia (7,000 RB, including 1,100 RB switched from Japan), Bangladesh (6,100 RB), and Peru (4,600 RB). Reductions were reported for Japan (3,000 RB). For 2019/2020, net sales reductions of 11,700 RB resulted as increases for Mexico (3,500 RB), were more than offset by reductions for India (15,200 RB). Exports of 240,300 RB were primarily to Indonesia (42,700 RB), Vietnam (41,600 RB), China (34,400 RB), Bangladesh (24,700 RB), and Mexico (15,200 RB). Net sales of Pima totaling 2,800 RB for 2018/2019 reported for Vietnam (2,200 RB), India (400 RB, switched from Japan), and the United Kingdom (300 RB), were partially offset by reductions for Japan (300 RB). Exports of 4,600 RB were primarily to India (2,000 RB), Pakistan (1,400 RB), Indonesia (500 RB), and Thailand (300 RB).
Optional Origin Sales: For 2018/2019, the current optional origin outstanding balance of 6,200 RB is for Indonesia (4,400 RB) and Vietnam (1,800 RB).
Exports for Own Account: New exports for own account totaling 6,800 RB were to China. Decreases totaling 6,800 RB were reported for Vietnam (6,300 RB) and Bangladesh (500 RB). The current outstanding balance is 13,000 RB, all China.
Hides and Skins: Net sales of 352,600 pieces reported for 2018 were down 68 percent from the previous week and 33 percent from the prior 4-week average. Whole cattle hide sales totaling 352,900 pieces were primarily for China (229,000 pieces, including decreases of 6,300 pieces), South Korea (65,500 pieces, including decreases of 1,100 pieces), Mexico (31,800 pieces, including decreases of 200 pieces), Thailand (10,400 pieces, including decreases of 3,400 pieces), and Japan (6,400 pieces, including decreases of 200 pieces). Exports of 427,100 pieces reported for 2018 were down 9 percent from the previous week, but up 8 percent from the prior 4-week average. Whole cattle hide exports of 423,300 pieces were primarily to China (234,700 pieces), South Korea (82,200 pieces), Thailand (55,800 pieces), Mexico (29,500 pieces), and Taiwan (10,100 pieces).
Net sales of 149,100 wet blues for 2018 were down 18 percent from the previous week, but up 16 percent from the prior 4-week average. Increases were reported for China (64,500 unsplit), Italy (31,300 unsplit and 7,500 grain splits), Vietnam (28,200 unsplit), and the Dominican Republic (14,200 unsplit). Reductions were reported for Thailand (1,000 unsplit and 200 grain splits) and Mexico (300 grain splits). For 2019, net sales of 168,800 wet blues were reported for Italy. Exports of 207,500 wet blues for 2018 were down 6 percent from the previous week, but up 49 percent from the prior 4-week average. The primary destinations were China (63,400 unsplit and 1,900 grain splits), Italy (53,500 unsplit and 5,700 grain splits), Vietnam (55,800 unsplit), and Thailand (8,100 grain splits and 6,400 unsplit). Net sales reductions splits totaling of 104,800 pounds for 2018 were reported for Vietnam. Exports of 715,200 pounds were up 24 percent from the previous week and 83 percent from the prior 4-week average. The destinations were Vietnam (665,200 pounds) and China (50,000 pounds).
Beef: Net sales of 21,500 MT for 2018 were up 48 percent from the previous week and 76 percent from the prior 4-week average. Increases were primarily for South Korea (7,000 MT, including decreases of 300 MT), Japan (4,900 MT, including decreases of 400 MT), Mexico (2,700 MT, including decreases of 200 MT), Hong Kong (2,300 MT, including decreases of 900 MT), and Canada (1,800 MT, including decreases of 100 MT). For 2019, net sales of 500 MT were reported for South Korea (400 MT) and Japan (100 MT). Exports of 16,900 MT were down 8 percent from the previous week and 9 percent from the prior 4-week average. The primary destinations were Japan (5,700 MT), South Korea (5,100 MT), Mexico (1,700 MT), Taiwan (1,500 MT), and Hong Kong (1,200 MT).
Pork: Net sales of 26,700 MT for 2018 were up 7 percent from the previous week and 5 percent from the prior 4-week average. Increases were reported for South Korea (9,800 MT), Japan (4,900 MT), Mexico (4,600 MT), Australia (2,100 MT), and Hong Kong (1,300 MT). Reductions were reported for Honduras (100 MT). Exports of 19,500 MT were up 43 percent from the previous week and 9 percent from the prior 4-week average. The primary destinations were Mexico (7,400 MT), Japan (3,500 MT), South Korea (2,500 MT), Canada (1,900 MT), and Hong Kong (800 MT).
August 16, 2018 1 FOREIGN AGRICULTURAL SERVICE/USDA
Terry Reilly
Senior Commodity Analyst – Grain and Oilseeds
Futures International │190 S LaSalle St., Suite 410│Chicago, IL 60603
W: 312.604.1366
AIM: fi_treilly
ICE IM: treilly1
Skype: fi.treilly

Trading of futures, options, swaps and other derivatives is risky and is not suitable for all persons. All of these investment products are leveraged, and you can lose more than your initial deposit. Each investment product is offered only to and from jurisdictions where solicitation and sale are lawful, and in accordance with applicable laws and regulations in such jurisdiction. The information provided here should not be relied upon as a substitute for independent research before making your investment decisions. Futures International, LLC is merely providing this information for your general information and the information does not take into account any particular individual’s investment objectives, financial situation, or needs. All investors should obtain advice based on their unique situation before making any investment decision. The contents of this communication and any attachments are for informational purposes only and under no circumstances should they be construed as an offer to buy or sell, or a solicitation to buy or sell any future, option, swap or other derivative. The sources for the information and any opinions in this communication are believed to be reliable, but Futures International, LLC does not warrant or guarantee the accuracy of such information or opinions. Futures International, LLC and its principals and employees may take positions different from any positions described in this communication. Past results are not necessarily indicative of future results.