From: Terry Reilly
Sent: Thursday, August 30, 2018 7:44:26 AM (UTC-06:00) Central Time (US & Canada)
Subject: FI Weekly USDA Export Sales Snapshot 8/23/2018
PDF attached
USDA export sales
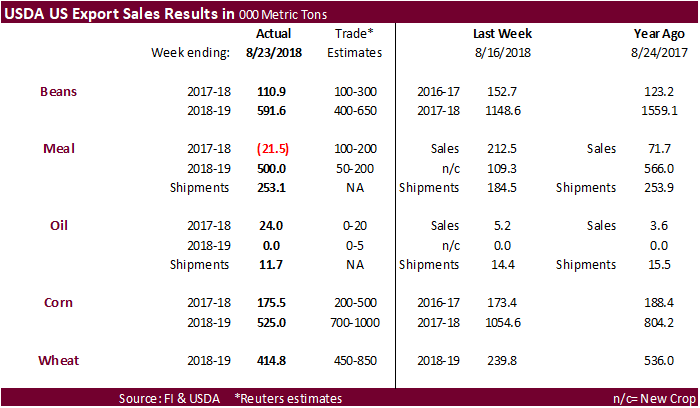
· Neutral soybeans and wheat
· Negative corn
· Supportive soybean products led by meal
U.S. EXPORT SALES FOR WEEK ENDING 8/23/2018
|
|
CURRENT MARKETING YEAR |
NEXT MARKETING YEAR |
||||||
|
COMMODITY |
NET SALES |
OUTSTANDING SALES |
WEEKLY EXPORTS |
ACCUMULATED EXPORTS |
NET SALES |
OUTSTANDING SALES |
||
|
CURRENT YEAR |
YEAR |
CURRENT YEAR |
YEAR |
|||||
|
|
THOUSAND METRIC TONS |
|||||||
|
WHEAT |
|
|
|
|
|
|
|
|
|
HRW |
114.4 |
1,312.5 |
1,583.4 |
76.0 |
1,264.3 |
2,905.4 |
0.0 |
0.0 |
|
SRW |
89.0 |
569.8 |
552.8 |
59.1 |
603.5 |
639.3 |
0.0 |
0.0 |
|
HRS |
107.8 |
1,317.7 |
1,422.1 |
174.1 |
1,407.0 |
1,838.7 |
0.0 |
0.0 |
|
WHITE |
78.7 |
931.4 |
1,274.4 |
89.0 |
1,348.1 |
1,656.6 |
0.0 |
0.0 |
|
DURUM |
24.8 |
171.8 |
106.9 |
6.1 |
45.5 |
104.0 |
0.0 |
0.0 |
|
TOTAL |
414.8 |
4,303.2 |
4,939.5 |
404.3 |
4,668.3 |
7,144.0 |
0.0 |
0.0 |
|
BARLEY |
0.5 |
40.2 |
28.7 |
0.4 |
11.8 |
7.5 |
0.0 |
0.0 |
|
CORN |
175.4 |
4,540.3 |
2,064.4 |
1,344.4 |
56,001.0 |
54,699.4 |
525.0 |
10,438.1 |
|
SORGHUM |
0.5 |
9.1 |
343.3 |
90.8 |
5,079.4 |
4,828.8 |
30.0 |
30.0 |
|
SOYBEANS |
110.9 |
3,381.6 |
3,442.1 |
973.1 |
55,491.0 |
57,401.0 |
591.6 |
13,217.8 |
|
SOY MEAL |
-21.5 |
1,446.1 |
1,078.1 |
253.1 |
10,983.6 |
9,310.9 |
500.0 |
1,455.6 |
|
SOY OIL |
24.0 |
136.4 |
75.3 |
11.7 |
924.6 |
1,047.2 |
0.0 |
40.5 |
|
RICE |
|
|
|
|
|
|
|
|
|
L G RGH |
22.1 |
195.1 |
142.3 |
15.7 |
73.7 |
100.5 |
0.0 |
0.0 |
|
M S RGH |
2.5 |
2.5 |
11.0 |
0.0 |
0.0 |
0.0 |
0.0 |
0.0 |
|
L G BRN |
0.1 |
1.6 |
1.2 |
0.3 |
1.2 |
0.5 |
0.0 |
0.0 |
|
M&S BR |
0.1 |
0.2 |
4.1 |
0.1 |
0.3 |
0.2 |
0.0 |
0.0 |
|
L G MLD |
67.0 |
126.1 |
212.0 |
4.8 |
58.6 |
29.6 |
0.0 |
0.0 |
|
M S MLD |
-1.1 |
45.0 |
38.7 |
3.0 |
37.7 |
17.0 |
0.0 |
0.0 |
|
TOTAL |
90.7 |
370.6 |
409.2 |
23.8 |
171.6 |
147.7 |
0.0 |
0.0 |
|
COTTON |
|
THOUSAND RUNNING BALES |
||||||
|
UPLAND |
150.6 |
8,048.1 |
5,945.5 |
172.6 |
613.4 |
692.5 |
49.6 |
1,370.3 |
|
PIMA |
10.6 |
227.6 |
198.4 |
2.4 |
20.2 |
12.1 |
0.0 |
24.9 |
Export Sales Highlights
This summary is based on reports from exporters for the period August 17-23, 2018.
Wheat: Net sales of 414,800 MT for 2018/2019 were up 73 percent from the previous week, but down 5 percent from the prior 4-week average. Increases were reported for the Philippines (102,700 MT, including 78,000 MT switched from unknown destinations), Japan (90,300 MT, including decreases of 21,600 MT), Mexico (80,700 MT, including decreases of 400 MT), Indonesia (53,000 MT), and Jamaica (22,400 MT, including 9,000 MT switched from unknown destinations). Reductions were for unknown destinations (23,500 MT) and Honduras (1,500 MT). Exports of 404,300 MT were down 12 percent from the previous week and 2 percent from the prior 4-week average. The destinations were primarily to the Philippines (139,700 MT), Japan (61,200 MT), Mexico (47,000 MT), South Korea (44,900 MT), and Peru (27,400 MT).
Corn: Net sales of 175,400 MT for 2017/2018 were up 1 percent from the previous week, but down 46 percent from the prior 4-week average. Increases were reported for Japan (103,600 MT, including 58,500 MT switched from unknown destinations and decreases of 22,700 MT), Mexico (96,400 MT, including decreases of 6,900 MT), Taiwan (78,500 MT, including decreases 2,100 MT), Egypt (75,700 MT, including 25,000 MT switched from unknown destinations), and Saudi Arabia (73,600 MT, including 70,000 MT switched from unknown destinations). Reductions were primarily for unknown destinations (331,400 MT) and Panama (35,000 MT). For 2018/2019, net sales of 525,000 MT reported for Mexico (136,400 MT), unknown destinations (114,500 MT), and Panama (98,300 MT), were partially offset by reductions for Taiwan (1,200 MT). Exports of 1,344,400 MT were up 2 percent from the previous week, but down 3 percent from the prior 4-week average. The destinations were primarily to Japan (436,800 MT), Mexico (232,600 MT), Taiwan (155,600 MT), Peru (143,900 MT), and South Korea (129,200 MT).
Optional Origin Sales: For 2018/2019, the current outstanding balance of 965,000 MT is for South Korea (412,000 MT), unknown destinations (298,000 MT), Vietnam (130,000 MT), Saudi Arabia (70,000 MT), and Malaysia (55,000 MT).
Export Adjustments: Accumulated exports of corn to Japan were adjusted down 67,868 MT for week ending August 9th. The correct destination for this shipment was Taiwan and is included in this week’s report. Accumulated exports of corn to Mexico were adjusted down 8 MT for the week ending July 26th. This shipment was canceled.
Barley: Net sales of 500 MT for 2018/2019 were for Taiwan. Exports of 400 MT were to Japan (300 MT) and South Korea (100 MT).
Sorghum: Net sales of 500 MT for 2017/2018 resulted as increases for Spain (59,100 MT, including 60,000 MT switched from unknown destinations and decreases of 1,400 MT), Burma (1,200 MT), and Mexico (200 MT), were partially offset by reductions for unknown destinations (60,000 MT). For 2018/2019, net sales of 30,000 MT were reported for unknown destinations. Exports of 90,800 MT were primarily to Spain (89,100 MT) and China (1,100 MT).
Rice: Net sales of 90,700 MT for 2018/2019 were reported for Haiti (32,200 MT), Iraq (30,000 MT), Mexico (8,700 MT), Costa Rica (7,300 MT), and Guatemala (4,800 MT). Exports of 23,800 MT were primarily to Venezuela (13,500 MT), Mexico (3,700 MT), Canada (1,600 MT), Haiti (1,400 MT), and Jordan (900 MT).
Export Adjustments: Accumulated exports of rice to Taiwan were adjusted down 360 MT for week ending April 5th, 720 MT for week ending April 19th, and 620 MT for week ending May 3rd. These shipments were rejected by Taiwan and brought back to the U.S.
Soybeans: Net sales of 110,900 MT for 2017/2018 were down 27 percent from the previous week and 39 percent from the prior 4-week average. Increases were reported for the Netherlands (155,200 MT, including 149,500 MT switched from unknown destinations and decreases of 1,000 MT), Iran (139,600 MT, including 128,000 MT switched from unknown destinations), Spain (60,000 MT, switched from unknown destinations), Tunisia (39,200 MT, including 36,500 MT switched from unknown destinations and decreases of 300 MT), and Egypt (38,300 MT, including 30,000 MT switched from unknown destinations). Reductions were for unknown destinations (409,600 MT), China (61,500 MT), and Mexico (20,800 MT). For 2018/2019, net sales of 591,600 MT reported for unknown destinations (360,200 MT), Mexico (131,200 MT), and Pakistan (65,000 MT), were partially offset by reductions for Indonesia (5,200 MT) and Canada (2,500 MT). Exports of 973,100 MT were up 55 percent from the previous week and 30 percent from the prior 4-week average. The destinations included Mexico (218,800 MT), the Netherlands (155,200 MT), Iran (139,600 MT), Egypt (91,300 MT), and Vietnam (76,800 MT).
Optional Origin Sales: For 2018/2019, the current outstanding balance of 63,000 MT is for unknown destinations.
Export for Own Account: The current exports for own account outstanding balance is 130,900 MT, all Canada.
Soybean Cake and Meal: Net sales reductions of 21,500 MT for 2017/2018–a marketing-year low–were down noticeably from the previous week and from the prior 4-week average. Increases reported for Israel (16,200 MT), Japan (10,500 MT), Singapore (8,100 MT), Canada (7,400 MT), and Sri Lanka (5,900 MT), were more than offset by reductions for unknown destinations (30,000 MT), Ireland (30,000 MT), the Dominican Republic (16,900 MT), and Mexico (8,700 MT). For 2018/2019, net sales of 500,000 MT reported for unknown destinations (280,000 MT), Mexico (83,900 MT), Ecuador (30,000 MT), and Ireland (30,000 MT), were partially offset by reductions for Thailand (4,400 MT) and Vietnam (1,800 MT). Exports of 253,100 MT were up 37 percent from the previous week and 13 percent from the prior 4-week average. The primary destinations were Mexico (63,300 MT), Denmark (36,000 MT), Ecuador (31,700 MT), Colombia (20,500 MT), and the Dominican Republic (16,900 MT).
Soybean Oil: Net sales of 24,000 MT for 2017/2018 were up noticeably from the previous week and from the prior 4-week average. Increases reported for South Korea (17,000 MT), Peru (5,000 MT), El Salvador (1,200 MT), and the Dominican Republic (600 MT), were partially offset by reductions for Morocco (200 MT) and Nicaragua (200 MT). Exports of 11,700 MT were down 19 percent from the previous week and 35 percent from the prior 4-week average. The primary destinations were Venezuela (5,500 MT), Mexico (3,300 MT), and Colombia (2,500 MT).
Cotton: Net sales of 150,600 RB for 2018/2019 were reported for China (44,500 RB, including decreases of 500 RB), Vietnam (30,400 RB, including 4,400 RB switched from China, 1,700 RB switched from South Korea, and 300 RB switched from Thailand), Pakistan (20,400 RB), South Korea (16,400 RB), and Bangladesh (8,800 RB). Reductions were reported for Japan (2,300 RB) and El Salvador (1,600 RB). For 2019/2020, net sales of 49,600 RB were reported for China (48,400 RB) and India (1,200 RB). Exports of 172,600 RB were primarily to Vietnam (61,000 RB), Mexico (18,200 RB), Indonesia (17,900 RB), Turkey (11,000 RB), and South Korea (9,600 RB). Net sales of Pima totaling 10,600 RB for 2018/2019 were reported for India (6,100 RB), China (3,500 RB), and Peru (700 RB). Exports of 2,400 RB were primarily to India (1,200 RB), Turkey (500 RB), Peru (300 RB), and Bangladesh (300 RB).
Optional Origin Sales: For 2018/2019, the current optional origin outstanding balance of 6,200 RB is for Indonesia (4,400 RB) and Vietnam (1,800 RB).
Exports for Own Account: The current exports for own account outstanding balance is 7,400 RB, all China.
Hides and Skins: Net sales of 408,000 pieces reported for 2018 were up 5 percent from the previous week, but down 26 percent from the prior 4-week average. Whole cattle hide sales totaling 408,700 pieces were primarily for China (238,300 pieces, including decreases of 21,900 pieces), South Korea (85,400 pieces, including decreases of 6,600 pieces), Mexico (38,200 pieces, including decreases of 7,400 pieces), Indonesia (16,200 pieces, including decreases of 200 pieces), and Brazil (13,800 pieces, including decreases of 700 pieces). Exports of 537,400 pieces reported for 2018 were up 29 percent from the previous week and 30 percent from the prior 4-week average. Whole cattle hide exports of 528,800 pieces were primarily to China (284,600 pieces), South Korea (92,500 pieces), Thailand (71,500 pieces), Mexico (43,500 pieces), and Brazil (7,300 pieces).
Net sales of 137,700 wet blues for 2018 were up noticeably from the previous week and up 40 percent from the prior 4-week average. Increases were reported for China (60,500 unsplit), Mexico (34,700 grain splits and 23,700 unsplit), Thailand (12,000 unsplit), and Vietnam (3,700 unsplit). Reductions were reported for India (2,000 unsplit), Brazil (1,800 grain splits), Italy (100 grain splits), and the Dominican Republic (100 unsplit). For 2019, net sales of 77,200 unsplit were reported for Italy. Exports of 150,000 wet blues for 2018 were up 31 percent from the previous week, but down 5 percent from the prior 4-week average. The primary destinations were China (56,500 unsplit), Italy (35,300 unsplit and 4,800 grain splits), and Mexico (9,900 grain splits and 9,300 unsplit). Net sales reductions of splits totaling 50,200 pounds for 2018 resulted as increases for China (1,200 pounds), were more than offset by reductions for Vietnam (50,200 pounds) and Taiwan (1,200 pounds). Exports of 768,800 pounds were up 56 percent from the previous week and 42 percent from the prior 4-week average. The destinations were Vietnam (688,800 pounds) and South Korea (80,000 pounds).
Beef: Net sales of 20,600 MT for 2018 were unchanged from the previous week, but up 13 percent from the prior 4-week average. Increases were primarily for Japan (8,900 MT, including decreases of 1,100 MT), South Korea (3,900 MT, including decreases of 400 MT), Hong Kong (2,600 MT, including decreases of 300 MT), Canada (1,500 MT, including decreases of 100 MT), and Mexico (1,300 MT, including decreases of 300 MT). For 2019, net sales of 700 MT were primarily for Japan. Exports of 17,800 MT were up 5 percent from the previous week, but unchanged from the prior 4-week average. The primary destinations were Japan (6,100 MT), South Korea (4,900 MT), Mexico (1,700 MT), Hong Kong (1,500 MT), and Taiwan (1,200 MT).
Pork: Net sales of 29,100 MT for 2018 were up 9 percent from the previous week and 2 percent from the prior 4-week average. Increases were reported for Mexico (12,500 MT), South Korea (5,800 MT), Japan (3,500 MT), Colombia (2,200 MT), and Canada (1,500 MT). Reductions were reported for China (300 MT). Exports of 22,100 MT were up 6 percent from the previous week and 17 percent from the prior 4-week average. The primary destinations were Mexico (8,500 MT), Japan (3,600 MT), Canada (2,000 MT), South Korea (1,900 MT), and Hong Kong (1,500 MT).
August 30, 2018 1 FOREIGN AGRICULTURAL SERVICE/USDA
SUMMARY OF EXPORT TRANSACTION
REPORTED UNDER THE DAILY REPORTING SYSTEM
FOR PERIOD ENDING AUGUST 23, 2018
COMMODITY DESTINATION QUANTITY MARKETING YEAR
SOYBEANS UNKNOWN 146,000 MT 1/ 2018/2019
SOYBEAN CAKE AND MEAL UNKNOWN 250,000 MT 1/ 2018/2019
1/ Export sales.
Terry Reilly
Senior Commodity Analyst – Grain and Oilseeds
Futures International │190 S LaSalle St., Suite 410│Chicago, IL 60603
W: 312.604.1366
AIM: fi_treilly
ICE IM: treilly1
Skype: fi.treilly

Trading of futures, options, swaps and other derivatives is risky and is not suitable for all persons. All of these investment products are leveraged, and you can lose more than your initial deposit. Each investment product is offered only to and from jurisdictions where solicitation and sale are lawful, and in accordance with applicable laws and regulations in such jurisdiction. The information provided here should not be relied upon as a substitute for independent research before making your investment decisions. Futures International, LLC is merely providing this information for your general information and the information does not take into account any particular individual’s investment objectives, financial situation, or needs. All investors should obtain advice based on their unique situation before making any investment decision. The contents of this communication and any attachments are for informational purposes only and under no circumstances should they be construed as an offer to buy or sell, or a solicitation to buy or sell any future, option, swap or other derivative. The sources for the information and any opinions in this communication are believed to be reliable, but Futures International, LLC does not warrant or guarantee the accuracy of such information or opinions. Futures International, LLC and its principals and employees may take positions different from any positions described in this communication. Past results are not necessarily indicative of future results.