From: Terry Reilly
Sent: Monday, July 09, 2018 10:06:30 AM (UTC-06:00) Central Time (US & Canada)
Subject: GRAINS INSPECTED AND/OR WEIGHED FOR EXPORT w/PDF
PDF attached
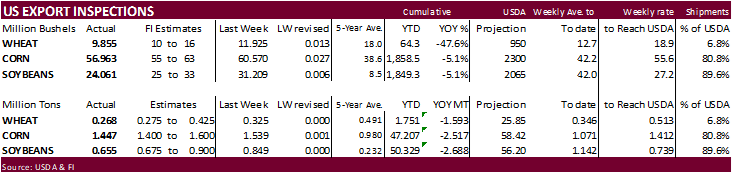
USDA inspections versus Reuters trade range
Wheat 268,221 versus 275,000-425,000
Corn 1,446,926 versus 850,000-1,600,000
Soybeans 654,834 versus 375,000-900,000
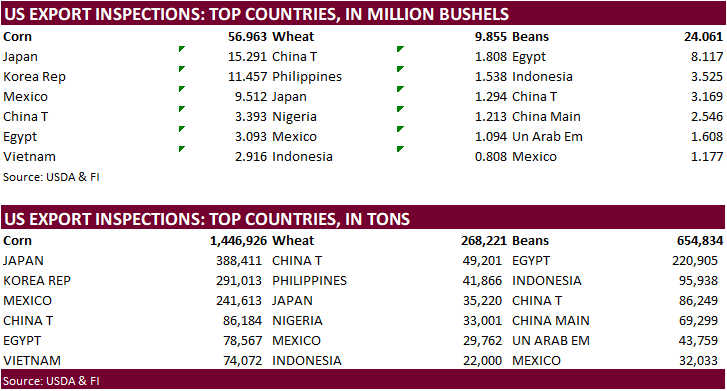
USDA US all-wheat export inspections as of July 05, 2018 were 268,221 tons, within a range of trade expectations, below 324,548 tons previous week and compares to 536,002 tons year ago. Major countries included China T for 49,201 tons, Philippines for 41,866 tons, and Japan for 35,220 tons.
USDA US corn export inspections as of July 05, 2018 were 1,446,926 tons, within a range of trade expectations, below 1,538,556 tons previous week and compares to 1,010,889 tons year ago. Major countries included Japan for 388,411 tons, Korea Rep for 291,013 tons, and Mexico for 241,613 tons.
USDA US soybean export inspections as of July 05, 2018 were 654,834 tons, above a range of trade expectations, below 849,374 tons previous week and compares to 477,140 tons year ago. Major countries included Egypt for 220,905 tons, Indonesia for 95,938 tons, and China T for 86,249 tons.
WA_GR101
Washington, DC Mon Jul 9, 2018 USDA Market News
*CORRECTIONS AT BOTTOM OF REPORT ARE INCLUDED IN CURRENT MARKET YEAR TO DATE*
COUNTRY OF DESTINATION IS REPORTED AS KNOWN AT THE TIME OF EXPORTATION.
INFORMATION CONTAINED IN THIS REPORT REFLECTS EXPORTED GRAIN INSPECTED AND
WEIGHED THROUGH THE AUTHORITY UNDER THE U.S. GRAIN STANDARDS ACT.
NO ADDITIONAL ANALYSIS, COMPILATIONS OR DATA IS AVAILABLE.
GRAINS INSPECTED AND/OR WEIGHED FOR EXPORT
REPORTED IN WEEK ENDING JUL 05, 2018
— METRIC TONS —
————————————————————————-
CURRENT PREVIOUS
———– WEEK ENDING ———- MARKET YEAR MARKET YEAR
GRAIN 07/05/2018 06/28/2018 07/06/2017 TO DATE TO DATE
BARLEY 0 709 2,295 807 5,221
CORN 1,446,926 1,538,556 1,010,889 47,207,472 49,724,027
FLAXSEED 0 0 686 24 2,399
MIXED 0 0 24 24 24
OATS 0 0 0 599 898
RYE 0 0 0 0 0
SORGHUM 10,584 9,416 112,046 4,781,677 5,136,986
SOYBEANS 654,834 849,374 477,140 50,328,713 53,016,687
SUNFLOWER 335 0 0 335 383
WHEAT 268,221 324,548 536,002 1,751,010 3,343,553
Total 2,380,900 2,722,603 2,139,082 104,070,661 111,230,178
————————————————————————-
CROP MARKETING YEARS BEGIN JUNE 1 FOR WHEAT, RYE, OATS, BARLEY AND
FLAXSEED; SEPTEMBER 1 FOR CORN, SORGHUM, SOYBEANS AND SUNFLOWER SEEDS.
INCLUDES WATERWAY SHIPMENTS TO CANADA.
SOYBEANS INSPECTED AND/OR WEIGHED FOR EXPORT
BY PORT AREA AND COUNTRY OF DESTINATION
REPORTED IN WEEK ENDING JUL 05, 2018
— METRIC TONS —
————————————————–
N. ATLANTIC
INDONESIA 2594
S. ATLANTIC
EGYPT 50100 INDONESIA 1566
MALAYSIA 490 THAILAND 931
VIETNAM 612
MISSISSIPPI R.
COLOMBIA 17644 COSTA RICA 14014
DOMINICN REP 3600 EGYPT 170805
INDONESIA 72466 JAPAN 10723
MALAYSIA 25169 UN ARAB EM 43759
COLUMBIA R.
CHINA T 68249 JAPAN 3016
PUGET SOUND
CHINA MAIN 69299
INTERIOR
BURMA 1371 CHINA T 18000
INDONESIA 19312 JAPAN 930
KOREA REP 245 MALAYSIA 5093
MEXICO 32033 PHILIPPINES 1541
THAILAND 14616 VIETNAM 6656
TOTAL 654834
————————————————–
INCLUDES SHIPMENTS TO CANADA.
WHEAT INSPECTED AND/OR WEIGHED FOR EXPORT BY CLASS, REGION AND PORT AREA
REPORTED IN WEEK ENDING JUL 05, 2018
— METRIC TONS —
——————————————————————————–
HARD RED HARD RED SOFT RED SOFT
REGION/PORT AREA SPRING WINTER WINTER WHITE DURUM MIXED TOTALS
ST LAWR SWY
MONTREAL 0 0 0 0 0 0 0
SEAWAY 0 0 0 0 0 0 0
SUBTOTAL 0 0 0 0 0 0 0
LAKES
CHICAGO 0 0 7,085 0 0 0 7,085
DULUTH-SUP 0 0 0 0 0 0 0
TOLEDO 0 0 0 0 0 0 0
PORT HURON 0 0 0 0 0 0 0
LAKE ONTARIO 0 0 0 0 0 0 0
LAKE SUPERIOR 0 0 0 0 0 0 0
LAKE ERIE 0 0 0 0 0 0 0
SUBTOTAL 0 0 7,085 0 0 0 7,085
ATLANTIC
N. ATLANTIC 0 0 0 0 0 0 0
S. ATLANTIC 0 0 980 0 0 0 980
SUBTOTAL 0 0 980 0 0 0 980
GULF
MISSISSIPPI R. 0 9,977 39,601 0 0 0 49,578
EAST GULF 0 0 0 0 0 0 0
N. TEXAS 0 1,100 0 0 0 0 1,100
S. TEXAS 0 0 0 0 0 0 0
SUBTOTAL 0 11,077 39,601 0 0 0 50,678
PACIFIC
COLUMBIA R. 74,458 34,621 0 50,297 7,973 30,222 197,571
PUGET SOUND 0 0 0 0 0 0 0
CALIFORNIA 0 0 0 98 0 0 98
SUBTOTAL 74,458 34,621 0 50,395 7,973 30,222 197,669
INTERIOR
INTERIOR 0 499 10,811 499 0 0 11,809
SUBTOTAL 0 499 10,811 499 0 0 11,809
TOTAL 74,458 46,197 58,477 50,894 7,973 30,222 268,221
SHIPMENTS TO CANADA* 0 0 0 0 0 0 3,241
——————————————————————————–
*NOT INCLUDED IN TOTAL INSPECTION FOR EXPORTS
WHEAT SHIPPED FOR STORAGE IN CANADA IS REPORTED AT TIME OF SHIPMENT FROM
ST LAWR SWY PORTS
PRIOR TO MAY 1, 1990, ALL HARD AND SOFT WHITE WHEAT VARIETIES WERE CLASSIFIED
AS WHITE WHEAT.
GRAINS INSPECTED AND/OR WEIGHED FOR EXPORT BY REGION AND PORT AREA
REPORTED IN WEEK ENDING JUL 05, 2018
— METRIC TONS —
———————————————————————————
CORN CORN SUN
REGION/PORT AREA WHEAT YELLOW WHITE SORGHUM SOYBEANS FLOWER TOTALS
LAKES
CHICAGO 7,085 0 0 0 0 0 7,085
TOLEDO 0 3,241 0 0 0 0 3,241
SUBTOTAL 7,085 3,241 0 0 0 0 10,326
ATLANTIC
N. ATLANTIC 0 0 0 0 2,594 0 2,594
S. ATLANTIC 980 0 0 0 53,699 0 54,679
SUBTOTAL 980 0 0 0 56,293 0 57,273
GULF
MISSISSIPPI R. 49,578 672,515 23,855 0 358,180 0 1,104,128
N. TEXAS 1,100 0 31,018 73 0 0 32,191
SUBTOTAL 50,678 672,515 54,873 73 358,180 0 1,136,319
PACIFIC
CALIFORNIA 98 49 0 0 0 0 147
COLUMBIA R. 197,571 430,151 0 10,056 71,265 0 709,043
PUGET SOUND 0 193,227 0 0 69,299 0 262,526
SUBTOTAL 197,669 623,427 0 10,056 140,564 0 971,716
INTERIOR
INTERIOR 11,809 92,870 0 455 99,797 335 205,266
SUBTOTAL 11,809 92,870 0 455 99,797 335 205,266
TOTAL 268,221 1,392,053 54,873 10,584 654,834 335 2,380,900
———————————————————————————
INCLUDES SHIPMENTS TO CANADA AND DOES NOT INCLUDE SHIPMENTS OF U.S. GRAIN FROM
THE ST. LAWRENCE SEAWAY.
MIXED CORN IS INCLUDED IN YELLOW CORN.
GRAINS INSPECTED AND/OR WEIGHED FOR EXPORT BY REGION AND COUNTRY OF DESTINATION
REPORTED IN WEEK ENDING JUL 05, 2018
— METRIC TONS —
———————————————————————————-
CORN CORN
REGION COUNTRY WHEAT YELLOW WHITE SORGHUM SOYBEANS TOTALS
LAKES MEXICO 7,085 0 0 0 0 7,085
SUBTOTAL 7,085 0 0 0 0 7,085
ATLANTIC CHINA T 980 0 0 0 0 980
EGYPT 0 0 0 0 50,100 50,100
INDONESIA 0 0 0 0 4,160 4,160
MALAYSIA 0 0 0 0 490 490
THAILAND 0 0 0 0 931 931
VIETNAM 0 0 0 0 612 612
SUBTOTAL 980 0 0 0 56,293 57,273
GULF CAMEROON 0 0 0 73 0 73
COLOMBIA 0 48,810 19,161 0 17,644 85,615
COSTA RICA 0 30,851 0 0 14,014 44,865
DOMINICN REP 0 12,306 0 0 3,600 15,906
EGYPT 0 78,567 0 0 170,805 249,372
GUATEMALA 0 31,257 0 0 0 31,257
HONDURAS 5,977 21,836 8,800 0 0 36,613
INDONESIA 0 0 0 0 72,466 72,466
JAPAN 0 85,697 4,694 0 10,723 101,114
KOREA REP 0 31,712 0 0 0 31,712
MALAYSIA 0 0 0 0 25,169 25,169
MEXICO 11,700 147,901 22,218 0 0 181,819
NIGERIA 33,001 0 0 0 0 33,001
SAUDI ARABIA 0 110,020 0 0 0 110,020
UN ARAB EM 0 0 0 0 43,759 43,759
VIETNAM 0 73,558 0 0 0 73,558
SUBTOTAL 50,678 672,515 54,873 73 358,180 1,136,319
PACIFIC CHINA MAIN 0 0 0 0 69,299 69,299
CHINA T 48,221 68,235 0 0 68,249 184,705
GUATEMALA 50,362 0 0 0 0 50,362
INDONESIA 22,000 0 0 0 0 22,000
JAPAN 35,220 297,555 0 10,056 3,016 345,847
KOREA REP 0 257,637 0 0 0 257,637
PHILIPPINES 41,768 0 0 0 0 41,768
THAILAND 98 0 0 0 0 98
SUBTOTAL 197,669 623,427 0 10,056 140,564 971,716
INTERIOR BURMA 734 0 0 0 1,371 2,105
CHINA T 0 17,949 0 0 18,000 35,949
COSTA RICA 0 49 0 0 0 49
INDONESIA 0 0 0 0 19,312 19,312
JAPAN 0 465 0 0 930 1,395
KOREA REP 0 1,664 0 0 245 1,909
MALAYSIA 0 490 0 0 5,093 5,583
MEXICO 10,977 71,494 0 455 32,033 115,294
PHILIPPINES 98 245 0 0 1,541 1,884
THAILAND 0 0 0 0 14,616 14,616
VIETNAM 0 514 0 0 6,656 7,170
SUBTOTAL 11,809 92,870 0 455 99,797 205,266
TOTAL 268,221 1,388,812 54,873 10,584 654,834 2,377,659
SHIPMENTS TO CANADA* 0 3,241 0 0 0 3,241
———————————————————————————-
*NOT INCLUDED IN TOTAL INSPECTION FOR EXPORTS
GRAIN SHIPPED FOR STORAGE IN CANADA IS REPORTED AT TIME OF SHIPMENT FROM
ST LAWR SWY PORTS
Monday JULY 9, 2018
CORRECTIONS TO PREVIOUS PUBLICATIONS:
FOR CERTDATE 06/22/18 ADD 367 WHC CORN FROM CALIFORNIA TO KOREA REP
FOR CERTDATE 06/27/18 ADD 367 SWH WHEAT FROM PUGET SOUND TO JAPAN
FOR CERTDATE 06/27/18 ADD 318 YC CORN FROM N. TEXAS TO HONDURAS
FOR CERTDATE 06/28/18 ADD 48 YSB SOYBEANS FROM INTERIOR TO CHINA T
FOR CERTDATE 06/28/18 ADD 122 YSB SOYBEANS FROM INTERIOR TO INDONESIA
Source: USDA, FGIS
USDA Market News Service, Moses Lake, WA
Robin Cusato-Wood 509-762-6169 MosesLake.LPGMN@ams.usda.gov
www.ams.usda.gov/mnreports/wa_gr101.txt
www.ams.usda.gov/market-news/livestock-poultry-grain
11:00e rlc
Terry Reilly
Senior Commodity Analyst – Grain and Oilseeds
Futures International │190 S LaSalle St., Suite 410│Chicago, IL 60603
W: 312.604.1366
AIM: fi_treilly
ICE IM: treilly1
Skype: fi.treilly

Trading of futures, options, swaps and other derivatives is risky and is not suitable for all persons. All of these investment products are leveraged, and you can lose more than your initial deposit. Each investment product is offered only to and from jurisdictions where solicitation and sale are lawful, and in accordance with applicable laws and regulations in such jurisdiction. The information provided here should not be relied upon as a substitute for independent research before making your investment decisions. Futures International, LLC is merely providing this information for your general information and the information does not take into account any particular individual’s investment objectives, financial situation, or needs. All investors should obtain advice based on their unique situation before making any investment decision. The contents of this communication and any attachments are for informational purposes only and under no circumstances should they be construed as an offer to buy or sell, or a solicitation to buy or sell any future, option, swap or other derivative. The sources for the information and any opinions in this communication are believed to be reliable, but Futures International, LLC does not warrant or guarantee the accuracy of such information or opinions. Futures International, LLC and its principals and employees may take positions different from any positions described in this communication. Past results are not necessarily indicative of future results.