From: research
Sent: Sunday, April 12, 2020 10:52:05 AM (UTC-06:00) Central Time (US & Canada)
To: research
Subject: Weekend Market Report – April 12, 2020
Happy Long Weekend.
On Thursday, the EIA reported a 38 Bcf injection for the first injection of the year. This fell on the high end of estimates, with the average being at ~29-31 Bcf. The 38 Bcf injection compares with last year’s 25 Bcf increase in storage and the five-year average injection of 6 Bcf.
The larger-than-expected build sent prompt gas futures tumbling – breaking from the inverse price relationship with oil we had seen earlier in the week. Leading up to the release, the May futures were trading at $1.757, but by noon EST prices were hovering around 1.73. Prices closed at 1.738 ahead of the long weekend.
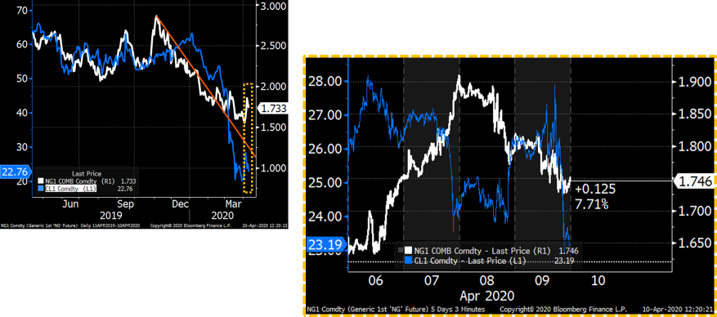
This report was a difficult one to forecast, as consumption habits were switching from winter to summer, and we continue to deal with plummeting demand from the COVID-19 pandemic growing across North America. The two back-to-back bearish reports tell us that demand destruction is potentially larger than we are able to capture from the pipeline flow data.
In today’s report we try to better assess the demand destruction we are currently seeing.
INDUSTRIAL USE IMPACT
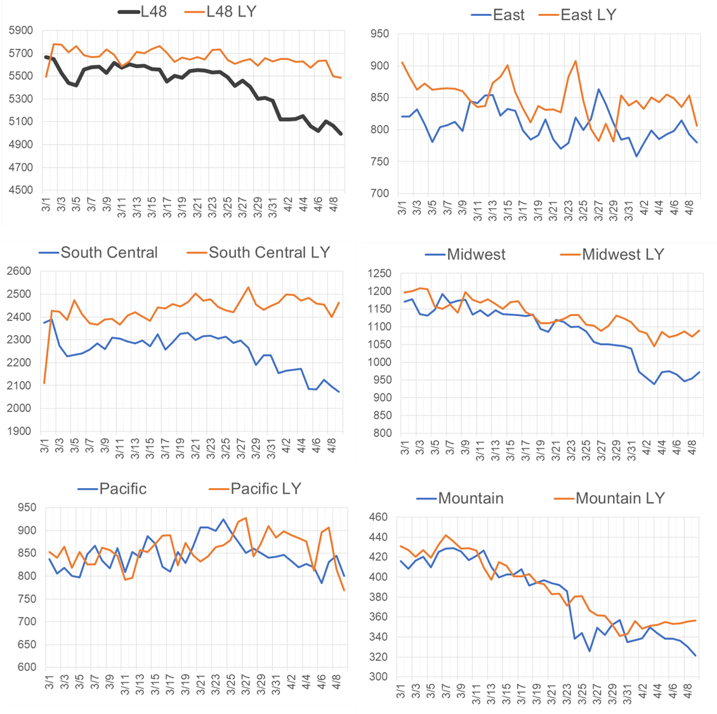
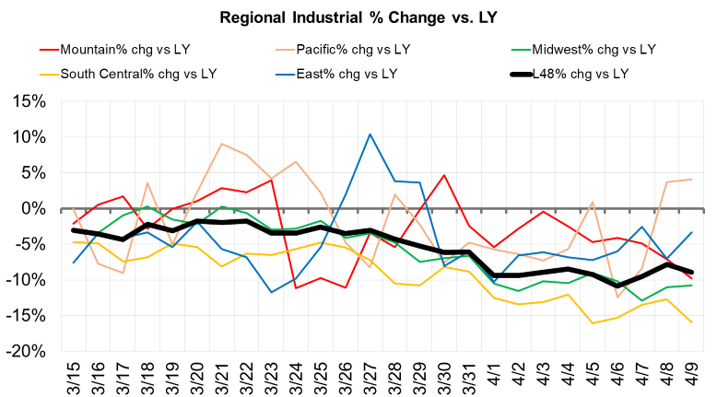
Our assessment of the pipeline flow data tell us that industrial demand is down approximately ~10% vs. last year. Industrial demand for the most part is quite constant throughout the year, but it does slightly fluctuate with weather. The charts below do not correct for weather differences between the current year and last year. This year was 5F warmer, and so the overall level of demand destruction could be slight less than we are capturing from the raw pipeline data. The raw pipeline data captures ~25% of the total industrial consumption.
Pipeline Deliveries to Industrial End Users
Below is the same data, but shown as total % change from last year.
YoY % change in Pipeline Deliveries to Industrial End Users
POWER BURNS
We performed the same analysis for power generator gas burns. This one is a bit more difficult to understand clearly, because we have the dynamics of closing businesses, people working from home, regional differences in temperature, varying levels of renewables & hydro, and of course a natural gas price levels.
The latest EEI Generation data show us that total electric output is lower, but pipeline flow data to gas burning power plants tell show us increased power burns this year vs. last years.

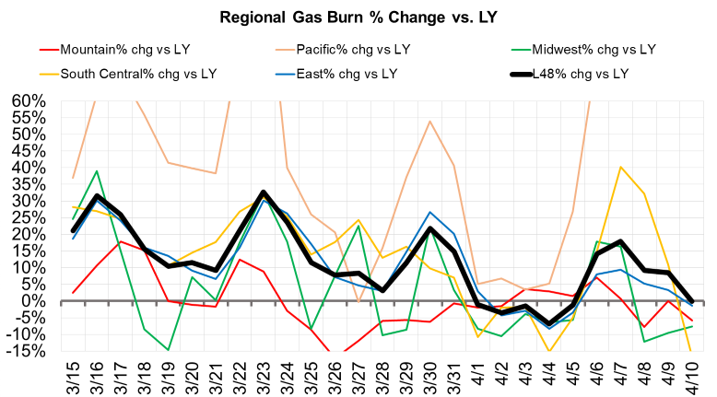
Below is our assessment of the change in regional gas burn by EIA Storage region. As can be seen overall gas burns have been strong since the mid-March, when the COVID pandemic started to influence our lives. Burns have been on average 12% higher since March 15th, but declining. The raw pipeline data captures ~75% of the total power burns.
YoY % change in Pipeline Deliveries to Natural Gas Burning Power Plants
We put weather-adjusted absolute burns about 3.0 Bcf/d higher YoY (for Mar 15 to Apr 10) as seen in the scatterplot of gas deliveries to power plant vs. L48 temps.
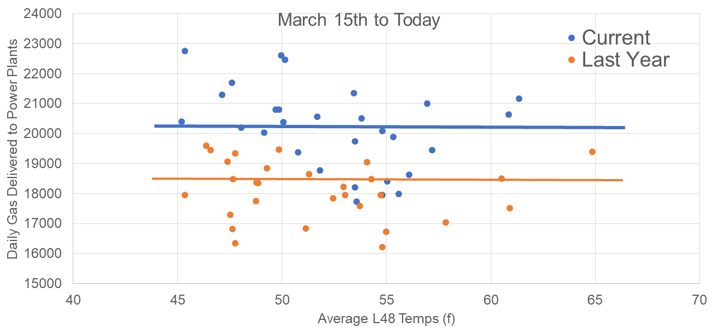
The YoY increase in power burns has been decreasing over our observed time frame. We are starting to head toward lower gas burns vs last year. We dived into this a bit further to see what is changing in addition to more states closing the doors to non-essential businesses.
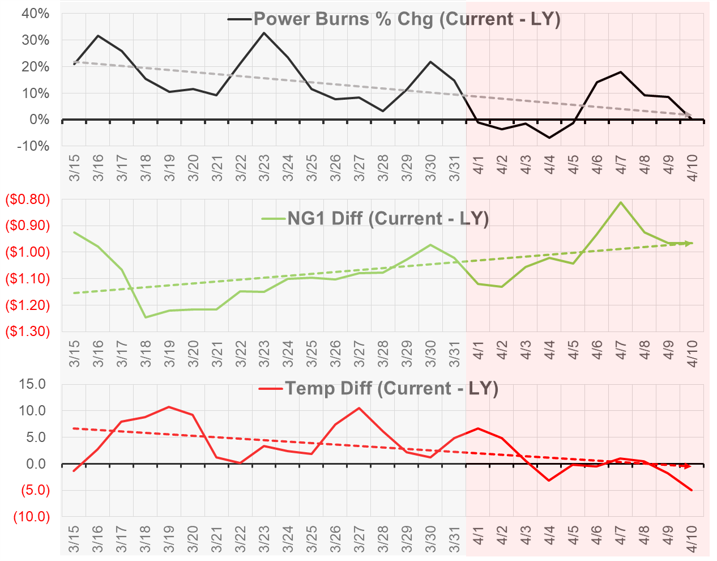
These series of charts tell us a more full story. The % difference of power burns have been declining since the mid-March because:
- The NG1 prices spread between the two years continues to converge. NG1 averaged $2.73/MMBtu during the period of 3/15 to 4/10 last year, while this year it averaged $1.67. This spread started at $1.20, and is now at less than $1.00.
- Temps were warmer in the L48 in this March, and we are now approaching temp levels similar to last year.
So to conclude – it appears that if price levels and temps were similar to last year, then the lower demand and reshuffle of the power generation mix would likely lead to lower gas burns.
Fundamentals for week ending Mar 27: Our early view for the upcoming storage report is a +65 Bcf draw for the lower 48.
US natural gas dry production is slightly lower week-on-week with domestic production averaging 91.3 Bcf/d for the week.
Natural gas demand moved lower last week with warmer temps starting to creep in in major demand regions. The warmer temps resulted in 3.3 Bcf/d of less gas consumption. Residential and commercial sector demand dropped by 3.3 Bcf/d WoW, while power increased by 0.5 Bcf/d WoW.
Canadian imports were also lower last week averaging 3.7 Bcf/d.
Mexican exports stayed flat to average 5.0 Bcf/d.
Deliveries to LNG facilities decreased week-on-week with Sabine LNG intake lower WoW. Total LNG deliveries were 8.3 Bcf/d.
Expiration and rolls: UNG ETF roll starts on Apr 14th and ends on Apr 17th.
May futures expire on Apr 28th, and May options expire on Apr 27th.
Het Shah
Bloomberg IM: Het Shah
enelyst DM: @het.co
Tel: 917-975-2960
This email, any information contained herein and any files transmitted with it (collectively, the Material) are the sole property of OTC Global Holdings LP and its affiliates (OTCGH); are confidential, may be legally privileged and are intended solely for the use of the individual or entity to whom they are addressed. Unauthorized disclosure, copying or distribution of the Material, is strictly prohibited and the recipient shall not redistribute the Material in any form to a third party. Please notify the sender immediately by email if you have received this email by mistake, delete this email from your system and destroy any hard copies. OTCGH waives no privilege or confidentiality due to any mistaken transmission of this email.
