From: research
Sent: Sunday, May 31, 2020 9:46:24 AM (UTC-06:00) Central Time (US & Canada)
To: research
Subject: Weekend Market Report – May 31, 2020
This week we look closer at power burns. Refinitiv put on a webinar this past week with some great analysis and charts. We use these along with our analysis on historical burn levels to get a view on current and forward power burns.
Up until this this week, the summer fundamentals have been focused on COVID demand destruction, dropping production, and LNG cancellations. With June approaching, we need to start considering how burn levels can impact end of season storage levels.
Two specific factors make burns important this summer:
1) the potential for heat due to a high probability of a La Nina forming past July, and
2) low nat gas price pushing out coal.
Below is analysis on daily L48 burns (raw daily pipeline deliveries – not modelled up) vs average national temps.
3 MONTH SUMMARY:
Over the past three months burns were generally higher due to lower prices, especially in the March time frame. As weather warmed up, the burn levels have started lining up with last year’s levels.
2019 / 2020
Average recorded deliveries: 18.5 Bcf/d / 19.4 Bcf/d
Average daily L48 temps: 56.0 F / 56.7 F
Average Prompt Month (price proxy): $2.56/MMBtu / $1.81/MMBtu
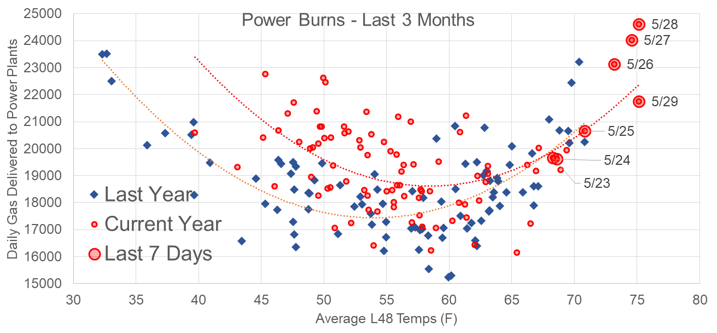
If we break this down monthly, we get a bit more clarity on the level of burns vs last year. It should be noted that we are not making any adjustment related to COVID for this analysis.
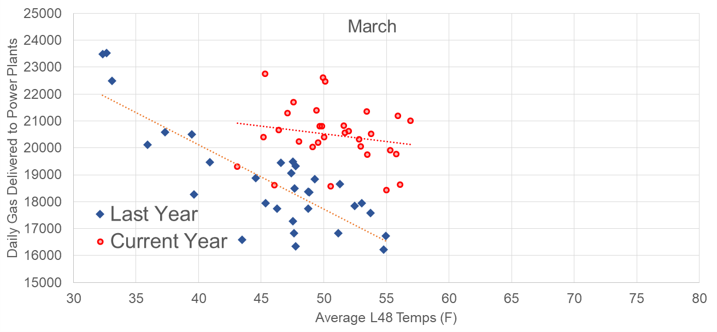
MARCH
Weather-adjusted burns look to be ~2.5 Bcf/d higher over the month.
Higher can be attributed to the lower prices in March YoY. It’s likely burns would have been higher with no COVID conditions.
2019 / 2020
Average recorded deliveries: 18.7 Bcf/d / 20.5 Bcf/d
Average daily L48 temps: 45.7 F / 50.8 F
Average Prompt Month (price proxy): $2.66/MMBtu / $1.64/MMBtu
APRIL
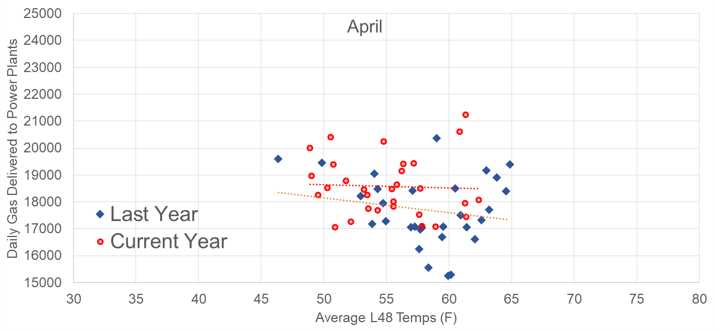
Weather-adjusted burns are marginally higher by ~0.5-1.0 Bcf/d over the month.
The modestly higher burns can be attributed to the lower prices (not as big of a delta as March). Temps were also cooler this April which would have led to even higher burns if 90% of the US was not in lockdown mode due to COVID conditions.
2019 / 2020
Average recorded deliveries: 17.7 Bcf/d / 18.6 Bcf/d
Average daily L48 temps: 58.2 F / 55.2 F
Average Prompt Month (price proxy): $2.58/MMBtu / $1.95/MMBtu
MAY
Weather-adjusted burns were flat to last year.
May is interesting because temps and burn levels were the same in both 2019 and 2020. The only difference is the lower price level experienced this year. So we can say that the COVID lock down presented the same conditions as prices being $0.60/MMBtu higher.
2019 / 2020
Average recorded deliveries: 19.2 Bcf/d / 19.4 Bcf/d
Average daily L48 temps: 64.7 F / 64.5 F
Average Prompt Month (price proxy): $2.45/MMBtu / $1.84/MMBtu
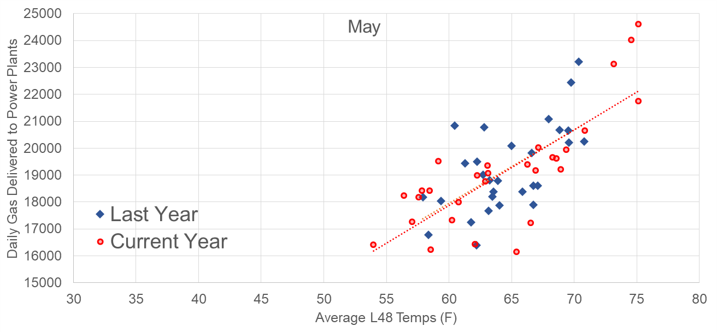
With no COVID condition, burns would have likely been higher but price would most probably been higher as well.
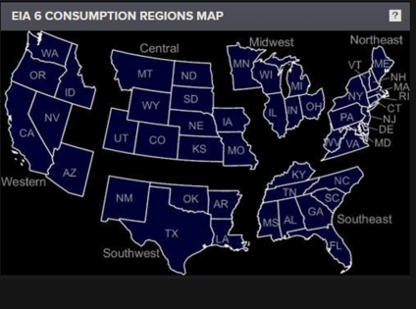
Next we jump into some great chart from Refinitiv that show the elasticity of power burns. Let’s first start with a map of their regions.
Source: Refinitiv
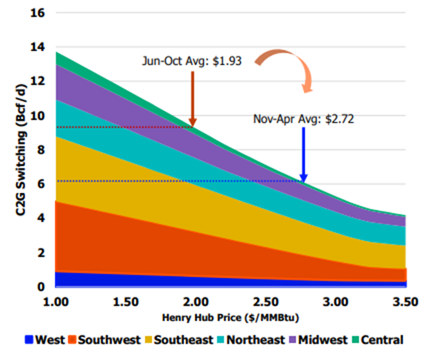
The first chart below shows C2G switching as a function of outright price levels. We are currently in the linear segment below $3.00/MMBtu.
Friday close for the July through Oct was closing $1.95/MMBtu. The same months last year averaged $2.37. Roughly looking at the charts (ignoring all other factors) – burns should be higher by ~1.5 Bcf/d purely based on the lower price expected this year.
Source: Refinitiv
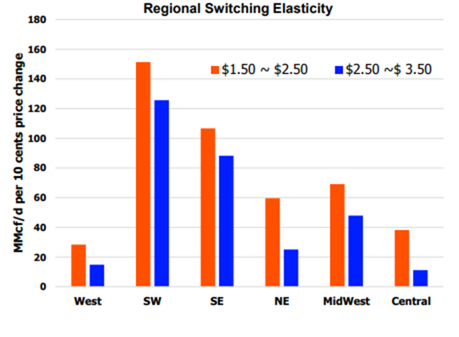
This next chart is a great view of how regional cash price impact burns. The relationship between price and C2G is non-linear; therefore Refinitiv broke up this chart into different price brackets. Let’s focus on the orange bars to see how ever 10c move increases or decreases burn levels.
Source: Refinitiv
Finally, we’ll end off with Refinitiv’s summer power burn outlook which takes into consideration CFV2 weather + their current switching assumptions + modelled COVID-19 impacts.

The expectation is for burns coming in -1.6 Bcf/d YoY lower for June through Oct, and -1.32 YoY weather adjusted.
Fundamentals for week ending May 29: Our early view for the upcoming storage report is a +98 Bcf injection for the lower 48. This would take storage levels to 2700 Bcf
US natural gas dry production is flat week-on-week with domestic production averaging 83.5 Bcf/d for the week. Average weekly production is 3.0 Bcf/d lower than 4 weeks ago.
Natural gas demand moved higher last week as weather patterns turned warmer in all regions except for the South Central. Residential and commercial sector consumption dropped by 2.6 Bcf/d, but power consumption rose by 3.2 Bcf/d.
Canadian imports were lower last week averaging 4.1 Bcf/d.
Mexican exports stayed flat to average 5.0 Bcf/d.
Deliveries to LNG facilities decreased week-on-week to 6.1 Bcf/d.
Expiration and rolls: UNG ETF roll starts on June 12th and ends on June 17th.
July futures expire on June 26th, and July options expire on June 25th
This email, any information contained herein and any files transmitted with it (collectively, the Material) are the sole property of OTC Global Holdings LP and its affiliates (OTCGH); are confidential, may be legally privileged and are intended solely for the use of the individual or entity to whom they are addressed. Unauthorized disclosure, copying or distribution of the Material, is strictly prohibited and the recipient shall not redistribute the Material in any form to a third party. Please notify the sender immediately by email if you have received this email by mistake, delete this email from your system and destroy any hard copies. OTCGH waives no privilege or confidentiality due to any mistaken transmission of this email.
