|
|
|
|
|
|
|
|
|
|
|
|
|
|
|
|
|
|
|
|
|
Prices as of 7:07 AM CST
|
|
|
|
|
|
|
|
|
|
|
|
|
|
|
|
|
Current Price
|
Previous Settle
|
% Change
|
Change
|
Volume
|
|
|
|
Natural Gas
|
$3.419
|
$3.471
|
-1.50%
|
-$0.052
|
226
|
|
|
|
WTI
|
$73.43
|
$73.77
|
-0.46%
|
-$0.34
|
67,434
|
|
|
|
Brent
|
$77.14
|
$77.49
|
-0.45%
|
-$0.35
|
3,949
|
|
|
|
ULSD
|
$2.448
|
$2.450
|
-0.10%
|
-$0.002
|
704
|
|
|
|
RBOB
|
$2.047
|
$2.053
|
-0.26%
|
-$0.005
|
1,852
|
|
|
|
|
|
|
|
|
|
|
|
|
Spreads
|
|
|
|
|
|
|
|
|
|
|
|
|
|
|
|
|
Current
|
Previous
|
% Change
|
Change
|
Contract
|
|
|
|
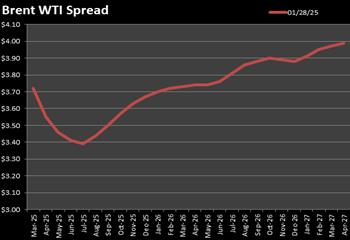
WTI-Brent
|
$3.63
|
$3.72
|
-2.42%
|
-$0.09
|
Mar-25
|
|
|
|
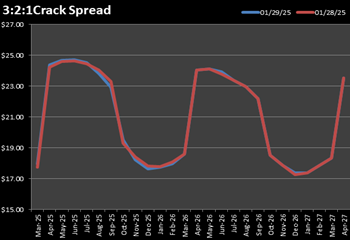
3:2:1 Crack
|
$17.97
|
$17.76
|
1.20%
|
$0.21
|
Mar-25
|
|
|
|
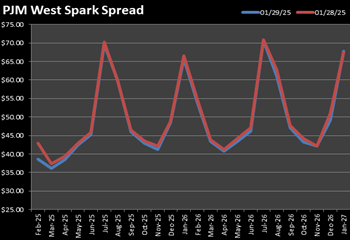
PJM West Spark
|
$38.63
|
$42.87
|
-9.89%
|
-$4.24
|
Feb-25
|
|
|
|
|
|
|
|
|
|
|
|
|
Baker Hughes Rig Count
|
|
|
|
|
|
|
|
|
|
|
|
|
|
|
|
|
Date
|
Count
|
Change
|
1 Year Chg.
|
1 Year Date
|
|
|
|
U.S.
|
01/24/25
|
576
|
-4
|
-45
|
01/27/24
|
|
|
|
Canada
|
01/24/25
|
245
|
16
|
15
|
01/27/24
|
|
|
|
International
|
Dec
|
909
|
-10
|
-46
|
Dec
|
|
|
|
|
|
|
|
|
|
|
|
|
CFTC Net Positions
|
|
|
|
|
|
|
|
|
|
|
|
|
|
|
|
As of 1/21/2025
|
Open Interest
|
Total Net Long
|
Total Net Short
|
Diff
|
|
|
|
PJM West On Peak
|
83,705
|
83,306
|
83,163
|
143
|
|
|
|
PJM West Off Peak
|
74,904
|
74,485
|
74,037
|
448
|
|
|
|
Natural Gas Henry Hub
|
337,797
|
326,735
|
326,736
|
-1
|
|
|
|
WTI – Light Sweet Crude Futures
|
327,153
|
279,757
|
264,766
|
14,991
|
|
|
|
Brent Crude Last Day
|
185,474
|
177,538
|
177,863
|
-325
|
|
|
|
NYM Ethanol
|
36,323
|
35,298
|
35,978
|
-680
|
|
|
|
Mt Belvieu LDH Propane Swap
|
143,330
|
142,484
|
143,141
|
-657
|
|
|
|
RBOB
|
433,059
|
406,292
|
416,700
|
-10,408
|
|
|
|
HSC Basis
|
882,712
|
874,326
|
870,241
|
4,085
|
|
|
|
|
|
|
|
|
|
|
|
|
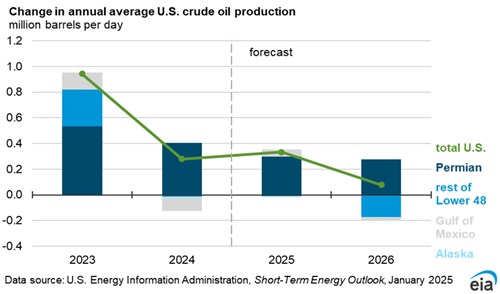
EIA Short Term Energy Outlook
|
|
|
|
|
|
|
|
|
|
|
|
|
|
|
|
|
2023
|
2024
|
2025 Projected
|
2026 Projected
|
|
|
|
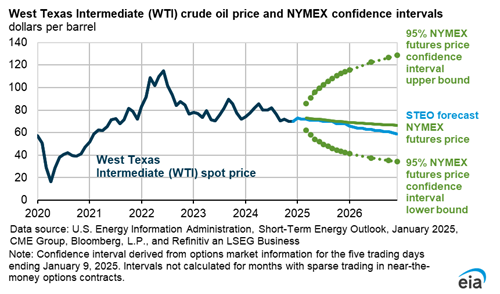
Brent
|
$82.00
|
$81.00
|
$74.00
|
$66.00
|
|
|
|
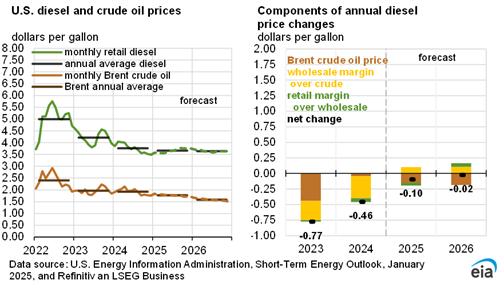
Gasoline
|
$3.50
|
$3.30
|
$3.20
|
$3.00
|
|
|
|
Crude Oil Production
|
$12.90
|
$13.20
|
$13.50
|
$13.60
|
|
|
|
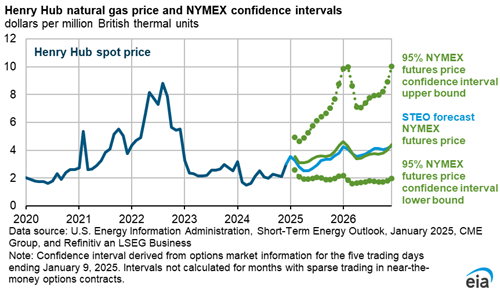
Natural Gas Spot
|
$2.50
|
$2.20
|
$3.10
|
$4.00
|
|
|
|
LNG Exports
|
12.00
|
12.00
|
14.00
|
16.00
|
|
|
|
|
|
|
|
|
|
|
|
|
Electrical Generation %
|
2023
|
2024
|
2025 Projected
|
2026 Projected
|
|
|
|
Natural gas
|
42.00%
|
43.00%
|
41.00%
|
40.00%
|
|
|
|
Coal
|
17.00%
|
16.00%
|
15.00%
|
15.00%
|
|
|
|
Renewables
|
22.00%
|
23.00%
|
25.00%
|
27.00%
|
|
|
|
Nuclear
|
19.00%
|
19.00%
|
19.00%
|
19.00%
|
|
|
|
|
|
|
|
|
|
|
|
|
|
|
|
|
|
|
|
Short Term Energy Outlook
|
|
|
|
|
|
|
|
|
|
|
|
|
|
|
|
|
|
|
|
|
|
|
|
|
|
|
|
|
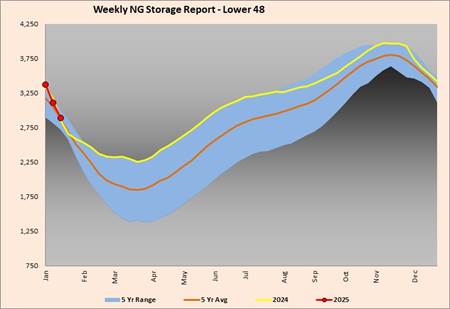
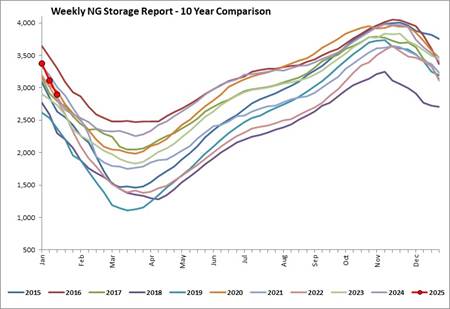
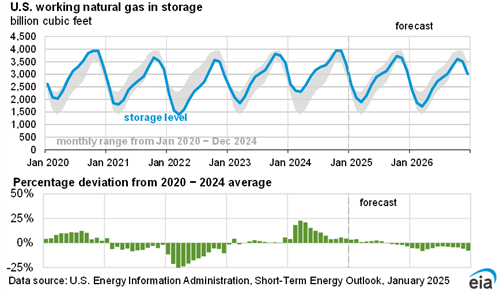
EIA Lower 48 Natural Gas Storage
|
|
|
|
|
|
|
|
|
|
|
|
|
|
01/17/20
|
|
|
|
|
|
1/17/25
|
1/10/25
|
Net Change
|
% Change
|
1/19/24
|
% Change
|
5 Year Avg.
|
% Change
|
|
|
|
East
|
613
|
669
|
-56
|
-8.37%
|
657
|
-6.70%
|
645
|
-4.96%
|
|
|
|
Midwest
|
744
|
808
|
-64
|
-7.92%
|
788
|
-5.58%
|
767
|
-2.95%
|
|
|
|
Mountain
|
229
|
240
|
-11
|
-4.58%
|
194
|
18.04%
|
160
|
43.48%
|
|
|
|
Pacific
|
269
|
283
|
-14
|
-4.95%
|
228
|
17.98%
|
215
|
25.23%
|
|
|
|
South
|
1,037
|
1,114
|
-77
|
-6.91%
|
990
|
4.75%
|
1,015
|
2.19%
|
|
|
|
Salt
|
297
|
326
|
-29
|
-8.90%
|
269
|
10.41%
|
295
|
0.75%
|
|
|
|
Non_Salt
|
739
|
788
|
-49
|
-6.22%
|
721
|
2.50%
|
720
|
2.67%
|
|
|
|
Total
|
2,892
|
3,115
|
-223
|
-7.16%
|
2,856
|
1.26%
|
2,801
|
3.26%
|
|
|
|
|
|
|
|
|
|
|
|
|
|
|
|
|
|
|
|
|
|
|
|
|
|
|
|
|
|
|
|
|
|
|
|
|
|
|
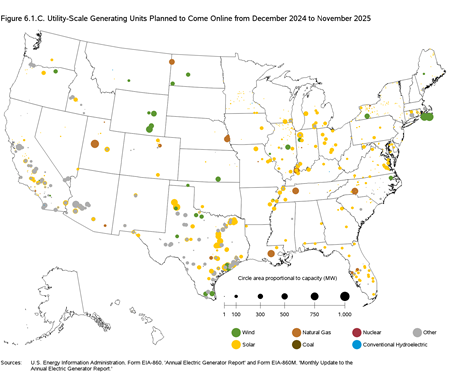
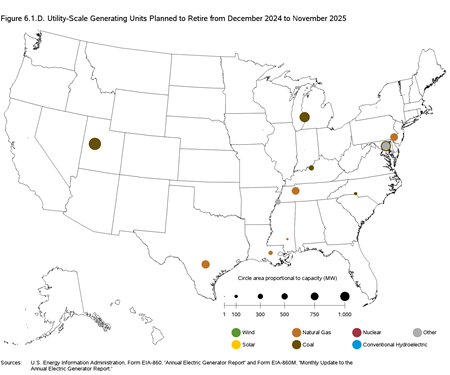
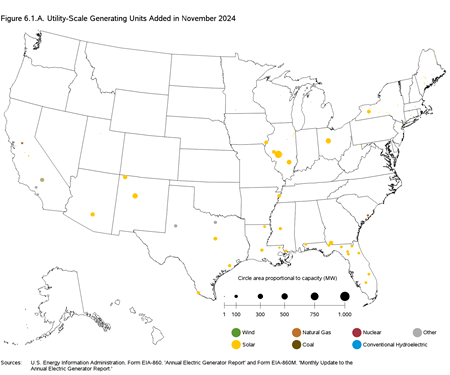
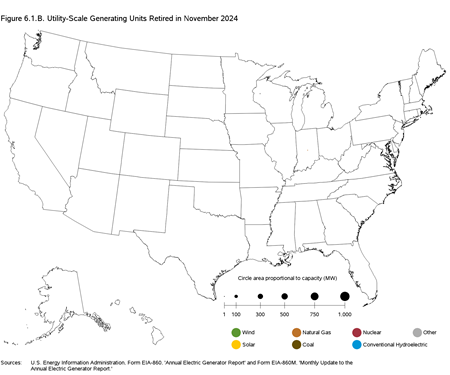
Power Generation Additions/Retirements
|
|
|
|
|
|
|
|
|
|
|
|
|
|
|
|
|
|
|
Front Month Prices
|
|
|
|
|
|
|
|
|
|
|
|
|
|
|
|
|
|
|
|
Electricity
|
|
|
|
OTCGH/EOXLive Market Data
|
|
|
|
|
Contract
|
1/28/25
|
1/27/25
|
% Change
|
Change
|
12/27/24
|
% Change
|
1/29/24
|
% Change
|
|
|
|
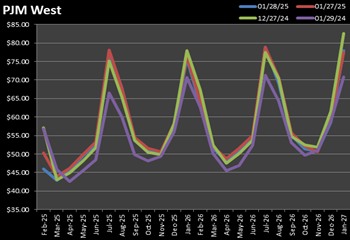
PJM West On Peak
|
Feb-25
|
$45.95
|
$50.29
|
-8.63%
|
-$4.34
|
$57.02
|
-19.41%
|
$56.83
|
-19.13%
|
|
|
|
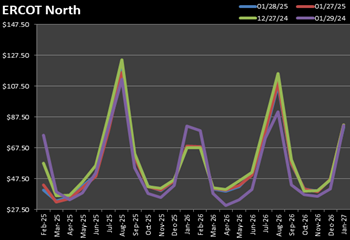
ERCOT North On Peak
|
Feb-25
|
$39.99
|
$43.31
|
-7.66%
|
-$3.32
|
$57.55
|
-30.50%
|
$75.64
|
-47.13%
|
|
|
|
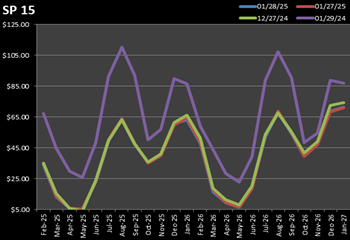
CAISO SP 15 On Peak
|
Feb-25
|
$34.12
|
$35.00
|
-2.50%
|
-$0.88
|
$34.90
|
-2.22%
|
$67.44
|
-49.40%
|
|
|
|
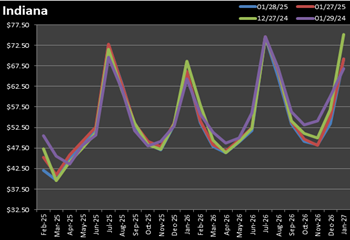
MISO Indiana On Peak
|
Feb-25
|
$42.05
|
$45.29
|
-7.16%
|
-$3.24
|
$47.30
|
-11.09%
|
$50.47
|
-16.68%
|
|
|
|
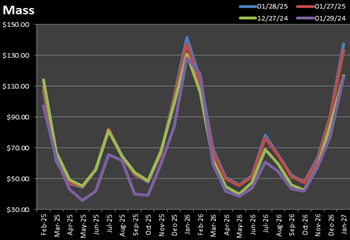
NEISO Mass On Peak
|
Feb-25
|
$107.07
|
$109.84
|
-2.52%
|
-$2.77
|
$114.25
|
-6.29%
|
$97.07
|
10.30%
|
|
|
|
WECC Mid C On Peak
|
Feb-25
|
$63.12
|
$63.93
|
-1.27%
|
-$0.81
|
$55.50
|
13.72%
|
$117.35
|
-46.21%
|
|
|
|
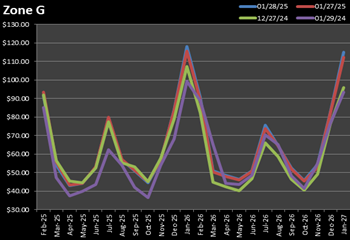
NYISO Zone G On Peak
|
Feb-25
|
$91.65
|
$93.41
|
-1.88%
|
-$1.75
|
$92.04
|
-0.42%
|
$85.14
|
7.65%
|
|
|
|
|
|
|
|
|
|
|
|
|
|
|
|
|
Natural Gas & Basis
|
|
|
|
OTCGH/EOXLive Market Data
|
|
|
|
|
Contract
|
1/28/25
|
1/27/25
|
% Change
|
Change
|
12/27/24
|
% Change
|
1/29/24
|
% Change
|
|
|
|
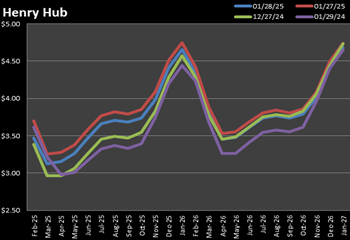
NYMEX Henry Hub
|
Feb-25
|
$3.471
|
$3.697
|
-6.11%
|
-$0.23
|
$3.38
|
2.60%
|
$3.62
|
-4.01%
|
|
|
|
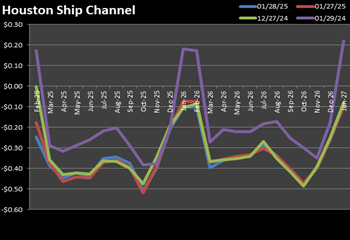
Houston Ship Channel
|
Feb-25
|
-$0.247
|
-$0.177
|
39.34%
|
-$0.07
|
$0.00
|
13594.44%
|
$0.17
|
-241.83%
|
|
|
|
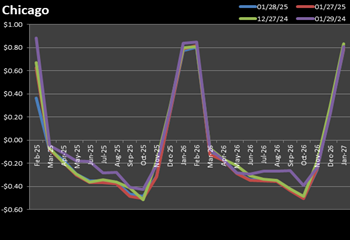
Chicago
|
Feb-25
|
$0.364
|
$0.626
|
71.95%
|
-$0.26
|
$0.67
|
-45.68%
|
$0.88
|
-58.67%
|
|
|
|
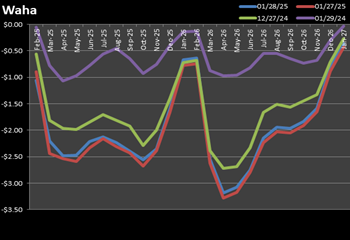
Waha
|
Feb-25
|
-$1.059
|
-$0.895
|
-18.39%
|
-$0.16
|
-$0.56
|
88.10%
|
-$0.05
|
1917.14%
|
|
|
|
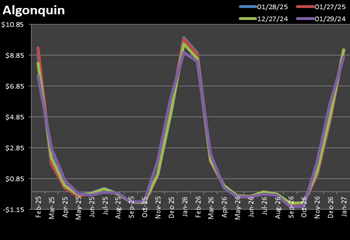
Algonquin
|
Feb-25
|
$8.935
|
$9.343
|
-4.36%
|
-$0.41
|
$8.33
|
7.24%
|
$7.51
|
18.96%
|
|
|
|
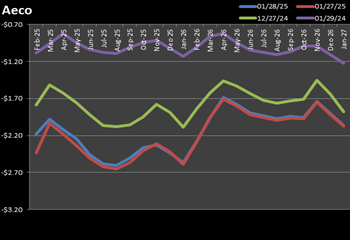
Aeco
|
Feb-25
|
-$2.183
|
-$2.433
|
-10.29%
|
$0.25
|
-$1.79
|
21.99%
|
-$1.09
|
100.89%
|
|
|
|
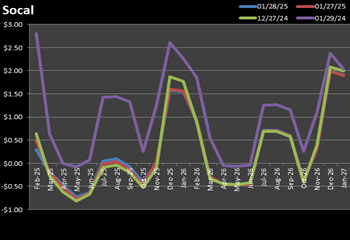
Socal
|
Feb-25
|
$0.299
|
$0.487
|
-38.58%
|
-$0.19
|
$0.64
|
-53.32%
|
$2.80
|
-89.32%
|
|
|
|
|
|
|
|
|
|
|
|
|
|
|
|
|
Natural Gas Liquids
|
|
|
|
OTCGH/EOXLive Market Data
|
|
|
|
|
Contract
|
1/28/25
|
1/27/25
|
% Change
|
Change
|
12/27/24
|
% Change
|
1/29/24
|
% Change
|
|
|
|
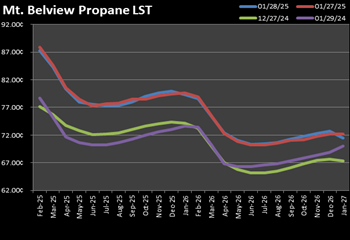
Mt. Belvieu Propane LST
|
Feb-25
|
$0.873
|
$0.879
|
-0.75%
|
-$0.01
|
$0.77
|
13.14%
|
$0.79
|
10.84%
|
|
|
|
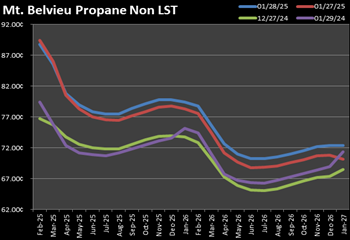
Mt. Belvieu Propane non LST
|
Feb-25
|
$0.888
|
$0.894
|
-0.76%
|
-$0.01
|
$0.77
|
15.61%
|
$0.79
|
11.74%
|
|
|
|
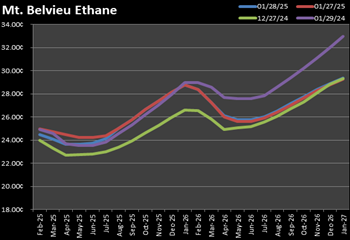
Mt. Belview Ethane
|
Feb-25
|
$0.245
|
$0.250
|
-2.00%
|
-$0.01
|
$0.24
|
2.07%
|
$0.25
|
-1.80%
|
|
|
|
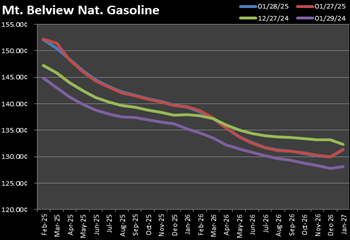
Mt. Belview Nat. Gasoline
|
Feb-25
|
$1.521
|
$1.522
|
-0.08%
|
$0.00
|
$1.47
|
3.31%
|
$1.45
|
5.01%
|
|
|
|
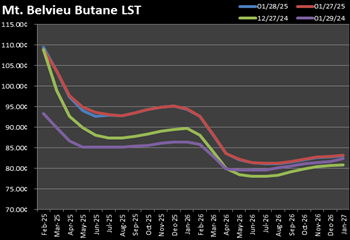
Mt. Belvieu Butane LST
|
Feb-25
|
$1.095
|
$1.089
|
0.57%
|
$0.01
|
$1.09
|
0.55%
|
$0.93
|
17.22%
|
|
|
|
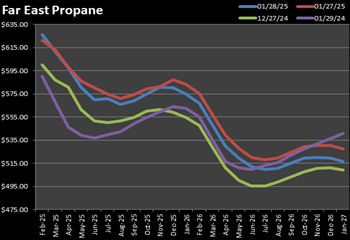
Far East Propane
|
Feb-25
|
$6.260
|
$6.213
|
0.76%
|
$0.05
|
$6.00
|
4.34%
|
$5.90
|
6.09%
|
|
|
|
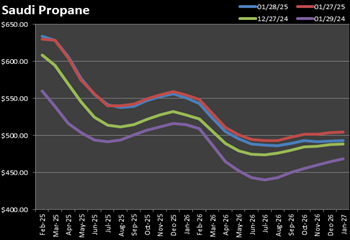
Saudi Propane
|
Feb-25
|
$6.340
|
$6.300
|
0.64%
|
$0.04
|
$6.09
|
4.10%
|
$5.60
|
13.18%
|
|
|
|
|
|
|
|
|
|
|
|
|
|
|
|
|
Crude Oil
|
|
|
|
OTCGH/EOXLive Market Data
|
|
|
|
|
Contract
|
1/28/25
|
1/27/25
|
% Change
|
Change
|
12/27/24
|
% Change
|
1/29/24
|
% Change
|
|
|
|
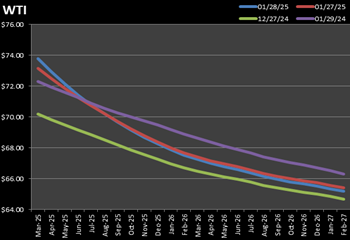
WTI
|
Mar-25
|
$73.77
|
$73.17
|
0.81%
|
$0.60
|
$70.18
|
5.12%
|
$72.31
|
2.02%
|
|
|
|
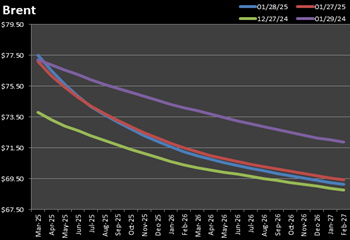
Brent
|
Mar-25
|
$77.49
|
$77.08
|
0.53%
|
$0.41
|
$73.79
|
5.01%
|
$77.22
|
0.35%
|
|
|
|
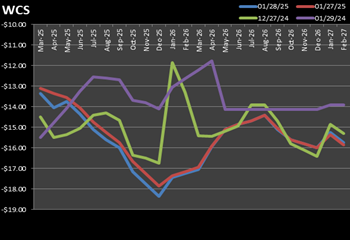
WCS
|
Mar-25
|
-$13.35
|
-$13.10
|
1.87%
|
-$0.25
|
-$14.50
|
-7.94%
|
-$15.50
|
-13.89%
|
|
|
|
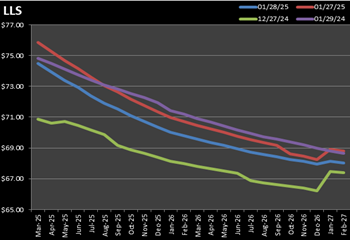
LLS
|
Mar-25
|
$74.49
|
$75.84
|
-1.82%
|
-$1.35
|
$70.87
|
5.11%
|
$74.82
|
-0.44%
|
|
|
|
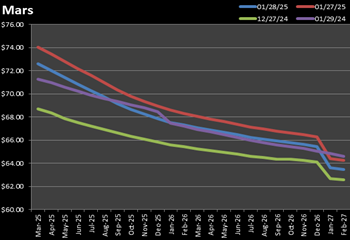
Mars
|
Mar-25
|
$72.59
|
$74.04
|
-2.00%
|
-$1.45
|
$68.72
|
5.64%
|
$71.28
|
1.84%
|
|
|
|
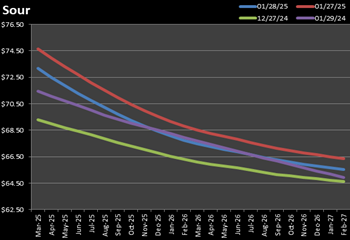
Sour
|
Mar-25
|
$73.17
|
$74.66
|
-2.03%
|
-$1.49
|
$69.28
|
5.61%
|
$71.44
|
2.42%
|
|
|
|
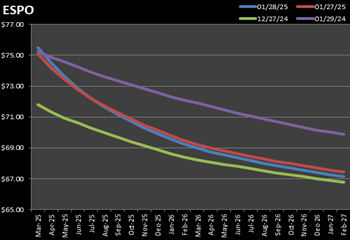
ESPO
|
Mar-25
|
$75.49
|
$75.08
|
0.54%
|
$0.41
|
$71.79
|
5.15%
|
$75.22
|
0.36%
|
|
|
|
|
|
|
|
|
|
|
|
|
|
|
|
|
Refined Products
|
|
|
|
OTCGH/EOXLive Market Data
|
|
|
|
|
Contract
|
1/28/25
|
1/27/25
|
% Change
|
Change
|
12/27/24
|
% Change
|
1/29/24
|
% Change
|
|
|
|
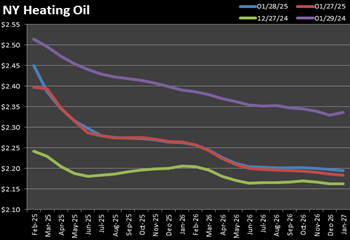
NY Heating Oil
|
Feb-25
|
$2.45
|
$2.40
|
2.21%
|
$0.05
|
$2.24
|
9.28%
|
$2.51
|
-2.55%
|
|
|
|
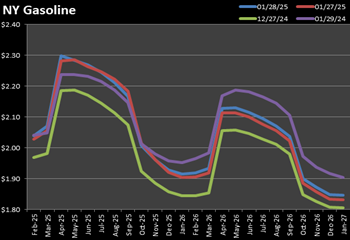
NY Gasoline
|
Feb-25
|
$2.04
|
$2.03
|
0.54%
|
$0.01
|
$1.97
|
3.66%
|
$2.04
|
-0.05%
|
|
|
|
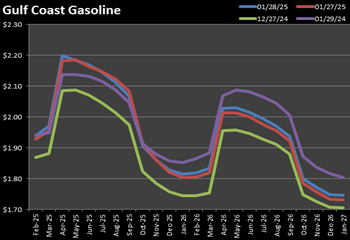
GC Gasoline
|
Feb-25
|
$1.94
|
$1.93
|
0.57%
|
$0.01
|
$1.87
|
3.85%
|
$1.94
|
-0.05%
|
|
|
|
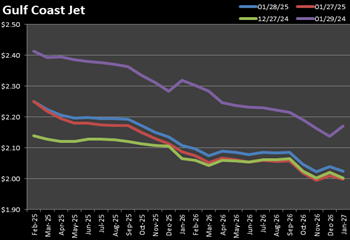
GC Jet
|
Feb-25
|
$2.25
|
$2.25
|
0.00%
|
$0.00
|
$2.14
|
5.19%
|
$2.41
|
-6.76%
|
|
|
|
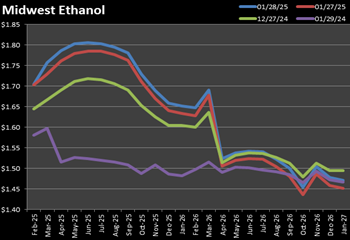
Chicago Ethanol
|
Feb-25
|
$1.71
|
$1.70
|
0.12%
|
$0.00
|
$1.64
|
3.65%
|
$1.58
|
7.84%
|
|
|
|
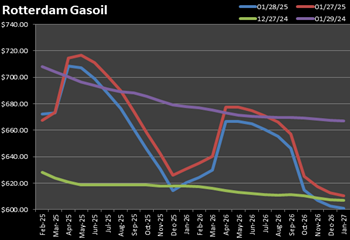
Rotterdam Gasoil
|
Feb-25
|
$672.16
|
$667.51
|
0.70%
|
$4.66
|
$628.25
|
6.99%
|
$708.05
|
-5.07%
|
|
|
|
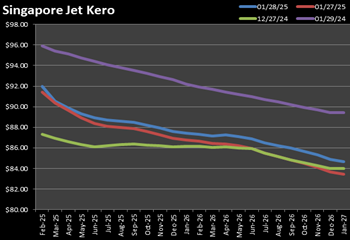
Singapore Jet Kero
|
Feb-25
|
$91.95
|
$91.42
|
0.58%
|
$0.53
|
$87.30
|
5.33%
|
$95.92
|
-4.13%
|
|
|
|
|
|
|
|
|
|
|
|
|
|
|
|
|
Implied Volatilities
|
|
|
|
OTCGH/EOXLive Market Data
|
|
|
|
|
Contract
|
1/28/25
|
1/27/25
|
% Change
|
Change
|
12/27/24
|
% Change
|
1/29/24
|
% Change
|
|
|
|
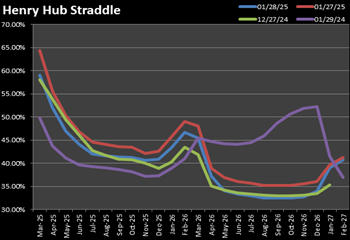
Henry Hub Straddle
|
Mar-25
|
59.02%
|
64.30%
|
-8.21%
|
-5.28%
|
58.05%
|
1.67%
|
49.77%
|
18.59%
|
|
|
|
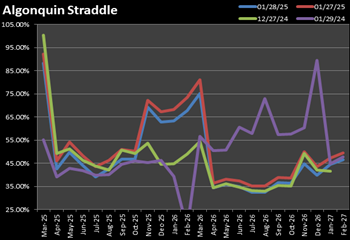
Algonquin Straddle
|
Mar-25
|
88.33%
|
92.10%
|
-4.09%
|
-3.77%
|
100.40%
|
-12.02%
|
55.12%
|
60.25%
|
|
|
|
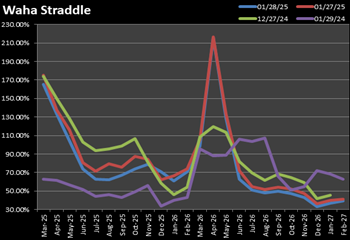
Waha Straddle
|
Mar-25
|
165.08%
|
175.36%
|
-5.86%
|
-10.28%
|
174.18%
|
-5.22%
|
63.12%
|
161.53%
|
|
|
|
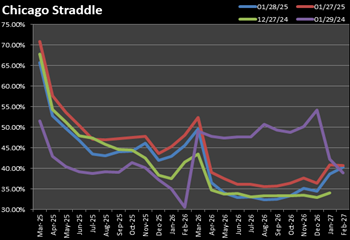
Chicago Straddle
|
Mar-25
|
65.72%
|
70.81%
|
-7.19%
|
-5.09%
|
67.81%
|
-3.08%
|
51.57%
|
27.44%
|
|
|
|
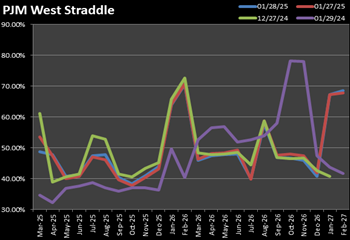
PJM West Straddle
|
Mar-25
|
48.79%
|
53.51%
|
-8.82%
|
-4.72%
|
61.07%
|
-20.11%
|
34.70%
|
40.61%
|
|
|
|
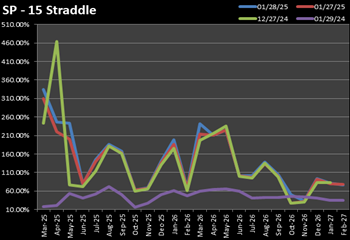
SP – 15 Straddle
|
Mar-25
|
333.93%
|
309.98%
|
7.73%
|
23.95%
|
242.52%
|
37.69%
|
17.40%
|
1819.14%
|
|
|
|
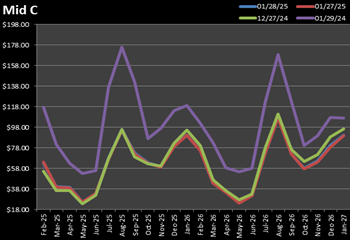
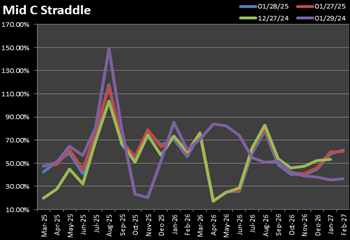
Mid. C Straddle
|
Mar-25
|
42.76%
|
47.71%
|
-10.38%
|
-4.95%
|
19.83%
|
115.63%
|
47.25%
|
-9.50%
|
|
|
|
|
|
|
|
|
|
|
|
|
|
|
|
|
Euro Gas and Power/LNG
|
|
|
OTCGH/EOXLive Market Data
|
|
|
|
|
Contract
|
1/28/25
|
1/27/25
|
% Change
|
Change
|
12/27/24
|
% Change
|
1/29/24
|
% Change
|
|
|
|
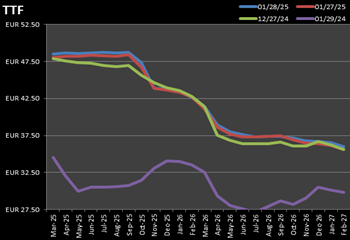
Dutch TTF
|
Mar-25
|
EUR 48.50
|
EUR 48.00
|
1.04%
|
EUR 0.50
|
EUR 47.86
|
1.33%
|
EUR 34.50
|
40.57%
|
|
|
|
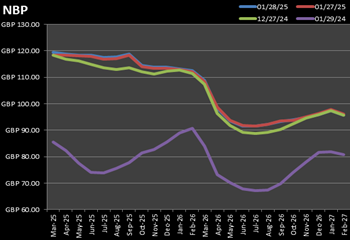
NBP
|
Mar-25
|
GBP 119.37
|
GBP 118.43
|
0.79%
|
GBP 0.94
|
GBP 118.29
|
0.92%
|
GBP 85.46
|
39.68%
|
|
|
|
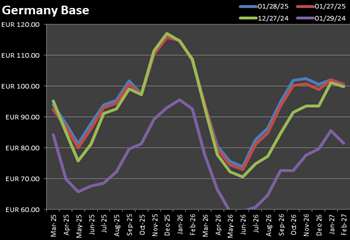
German Base
|
Mar-25
|
EUR 93.95
|
EUR 92.35
|
1.73%
|
EUR 1.60
|
EUR 95.25
|
-1.37%
|
EUR 84.29
|
11.46%
|
|
|
|
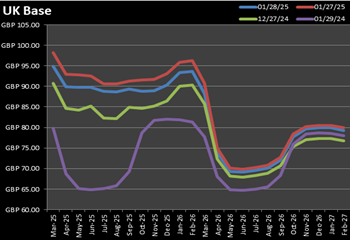
UK Base
|
Mar-25
|
GBP 94.90
|
GBP 98.25
|
-3.41%
|
-GBP 3.35
|
GBP 90.75
|
4.57%
|
GBP 79.81
|
18.91%
|
|
|
|
French Base
|
Mar-25
|
EUR 76.95
|
EUR 76.69
|
0.35%
|
EUR 0.27
|
EUR 82.50
|
-6.72%
|
EUR 86.75
|
-11.30%
|
|
|
|
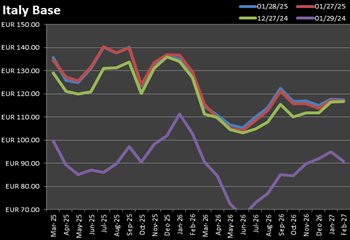
Italian Base
|
Mar-25
|
EUR 135.82
|
EUR 134.48
|
1.00%
|
EUR 1.34
|
EUR 129.01
|
5.28%
|
EUR 99.57
|
36.41%
|
|
|
|
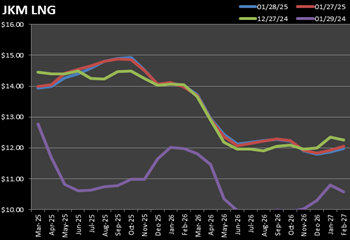
JKM LNG
|
Mar-25
|
$13.93
|
$13.99
|
-0.39%
|
-$0.06
|
$14.46
|
-3.67%
|
$12.77
|
9.07%
|
|
|
|
|
|
|
|
|
|
|
|
|
|
|
|
|
Freight Forwards (WET & DRY)
|
|
OTCGH/EOXLive Market Data
|
|
|
|
|
Contract
|
1/28/25
|
1/27/25
|
% Change
|
Change
|
12/27/24
|
% Change
|
1/29/24
|
% Change
|
|
|
|
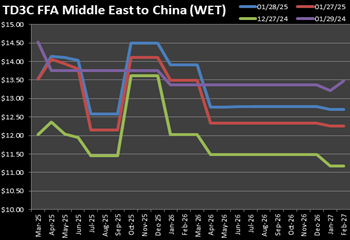
TD3C FFA Middle East to China (WET)
|
Mar-25
|
$48.50
|
$48.00
|
1.04%
|
$0.50
|
$47.86
|
1.33%
|
$34.50
|
40.57%
|
|
|
|
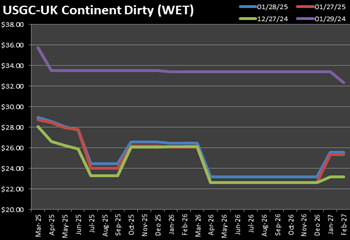
USGC-UK Continent Dirty (WET)
|
Mar-25
|
$119.37
|
$118.43
|
0.79%
|
$0.94
|
$118.29
|
0.92%
|
$85.46
|
39.68%
|
|
|
|
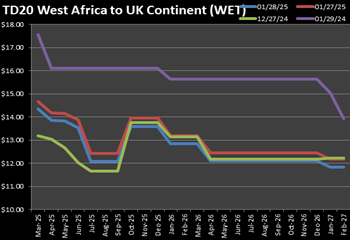
TD20 West Africa to UK Continent (WET)
|
Mar-25
|
$93.95
|
$92.35
|
1.73%
|
$1.60
|
$95.25
|
-1.37%
|
$84.29
|
11.46%
|
|
|
|
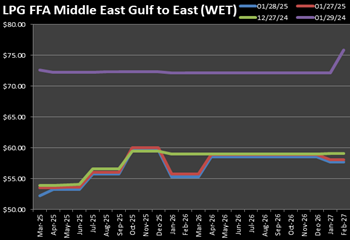
LPG FFA Middle East Gulf to East (WET)
|
Mar-25
|
$94.90
|
$98.25
|
-3.41%
|
-$3.35
|
$90.75
|
4.57%
|
$79.81
|
18.91%
|
|
|
|
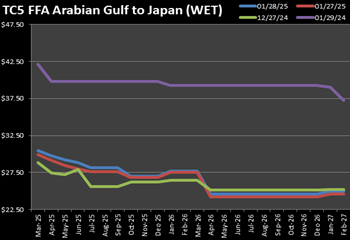
TC5 FFA Arabian Gulf to Japan (WET)
|
Mar-25
|
$76.95
|
$76.69
|
0.35%
|
$0.27
|
$82.50
|
-6.72%
|
$86.75
|
-11.30%
|
|
|
|
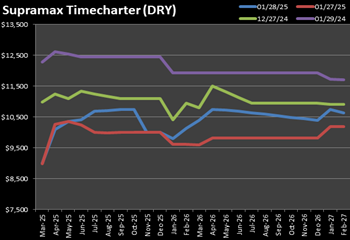
Supramax Timecharter (DRY)
|
Mar-25
|
$135.82
|
$134.48
|
1.00%
|
$1.34
|
$129.01
|
5.28%
|
$99.57
|
36.41%
|
|
|
|
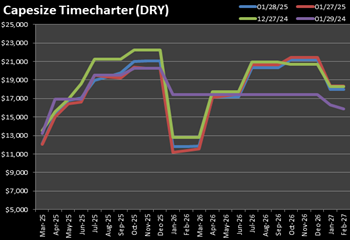
Capesize Timecharter (DRY)
|
Mar-25
|
$13.93
|
$13.99
|
-0.39%
|
-$0.06
|
$14.46
|
-3.67%
|
$12.77
|
9.07%
|
|
|
|
|
|
|
|
|
|
|
|
|
|
|
|
|
|
|
|
|
|
|
|
|
|
|
|
|
|
|
|
|
|
|
|
|
|
|
|
|
|
|
|
|
|
|
|
|
|
|
|
|
|
|
Cooling Degree Days
|
|
|
|
|
|
|
|
|
|
|
|
|
|
|
|
|
|
|
01/25/2025
|
Week Tot
|
Dev Norm
|
Dev L YR
|
Cum Tot
|
CumD Norm
|
CumD L YR
|
CumD Norm
|
CumD L YR
|
|
|
|
New England
|
0
|
0
|
0
|
0
|
0
|
0
|
NA
|
NA
|
|
|
|
Middle Atlantic
|
0
|
0
|
0
|
0
|
0
|
0
|
NA
|
NA
|
|
|
|
E N Central
|
0
|
0
|
0
|
0
|
0
|
0
|
NA
|
NA
|
|
|
|
W N Central
|
0
|
0
|
0
|
0
|
0
|
0
|
NA
|
NA
|
|
|
|
South Atlantic
|
1
|
-7
|
-3
|
4
|
-24
|
-5
|
NA
|
NA
|
|
|
|
E S Central
|
0
|
-1
|
0
|
0
|
-7
|
0
|
NA
|
NA
|
|
|
|
W S Central
|
0
|
-4
|
-1
|
1
|
-10
|
0
|
NA
|
NA
|
|
|
|
Mountain
|
0
|
0
|
0
|
0
|
0
|
0
|
NA
|
NA
|
|
|
|
Pacific
|
0
|
-1
|
0
|
0
|
-1
|
0
|
NA
|
NA
|
|
|
|
United States
|
0
|
-2
|
-1
|
1
|
-6
|
-1
|
NA
|
NA
|
|
|
|
|
|
|
|
|
|
|
|
|
|
|
|
Heating Degree Days
|
|
|
|
|
|
|
|
|
|
|
|
|
|
|
|
|
|
|
01/25/2025
|
Week Tot
|
Dev Norm
|
Dev L YR
|
Cum Tot
|
CumD Norm
|
CumD L YR
|
CumD Norm
|
CumD L YR
|
|
|
|
New England
|
332
|
48
|
53
|
3,270
|
-196
|
246
|
-6.00%
|
8.00%
|
|
|
|
Middle Atlantic
|
318
|
54
|
55
|
2,954
|
-170
|
151
|
-5.00%
|
5.00%
|
|
|
|
E N Central
|
373
|
77
|
82
|
3,206
|
-318
|
101
|
-9.00%
|
3.00%
|
|
|
|
W N Central
|
384
|
70
|
64
|
3,390
|
-432
|
46
|
-11.00%
|
1.00%
|
|
|
|
South Atlantic
|
209
|
63
|
56
|
1,573
|
-30
|
86
|
-2.00%
|
6.00%
|
|
|
|
E S Central
|
276
|
91
|
72
|
1,922
|
-154
|
-28
|
-7.00%
|
-1.00%
|
|
|
|
W S Central
|
216
|
83
|
63
|
1,198
|
-191
|
-205
|
-14.00%
|
-15.00%
|
|
|
|
Mountain
|
264
|
52
|
77
|
2,637
|
-284
|
-26
|
-10.00%
|
-1.00%
|
|
|
|
Pacific
|
128
|
3
|
12
|
1,532
|
-182
|
17
|
-11.00%
|
1.00%
|
|
|
|
United States
|
265
|
57
|
57
|
2,284
|
-197
|
45
|
-8.00%
|
2.00%
|
|
|
|
|
|
|
|
|
|
|
|
|
|
|
|
|
|
|
|
|
|
|
|
|
|
|
|
|
|
|
|
|
|
|
|
|
|
|
|
|
|
|
|
|
|
|
|
|
|
|
Gas * Power * NGL * Crude * Products * Vol * Freight * Spreads – Charts
|
|
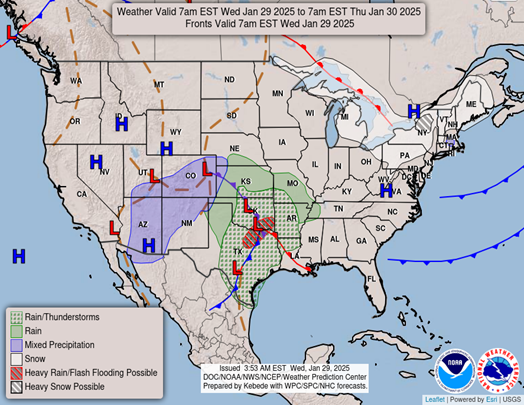
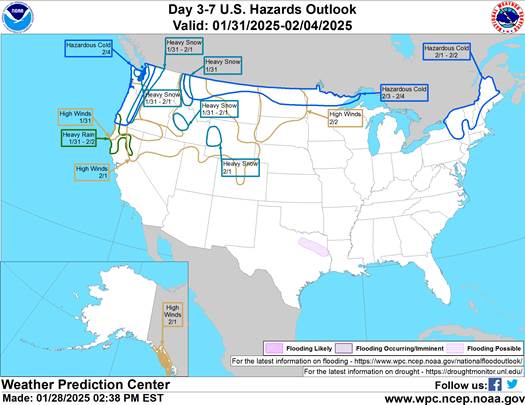
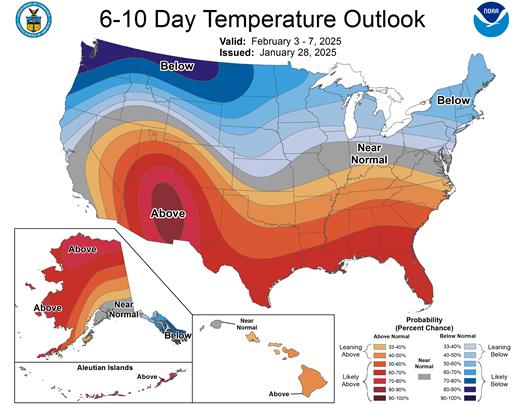
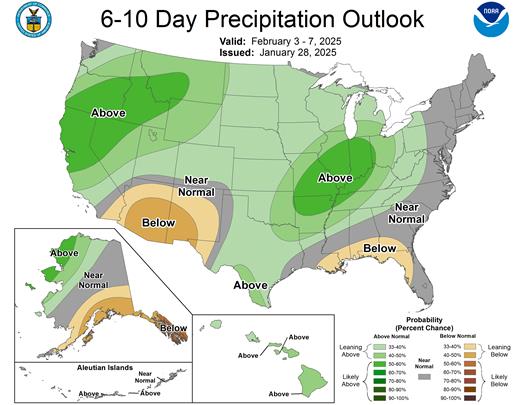
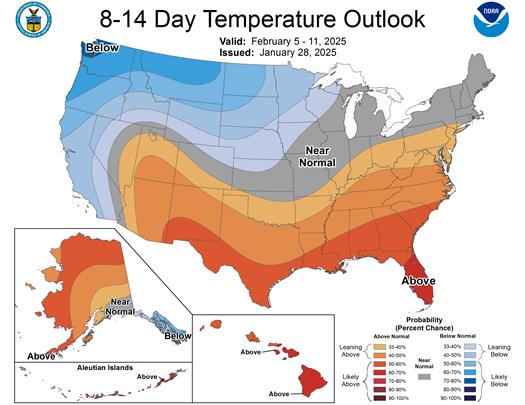
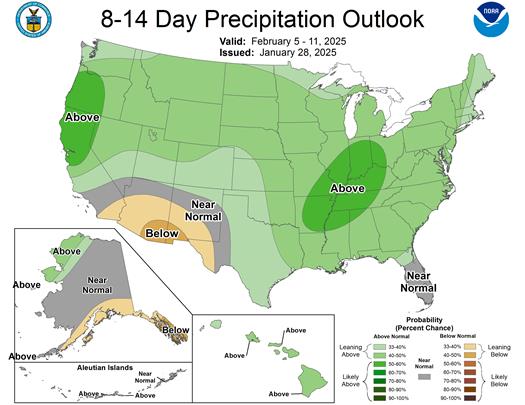
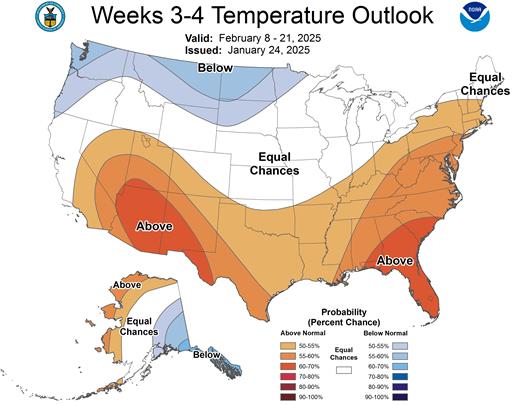
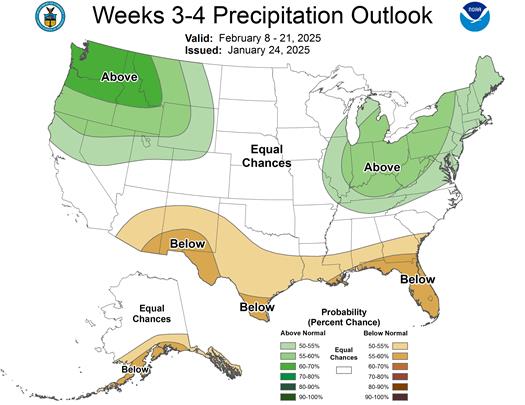
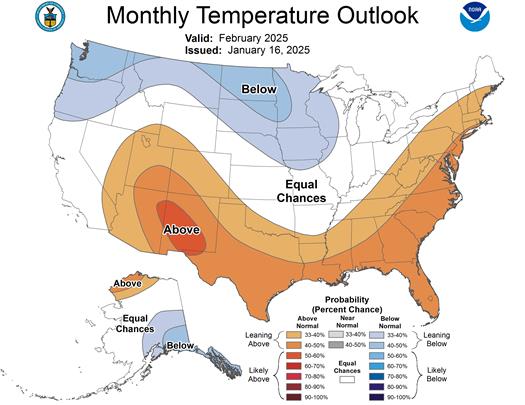
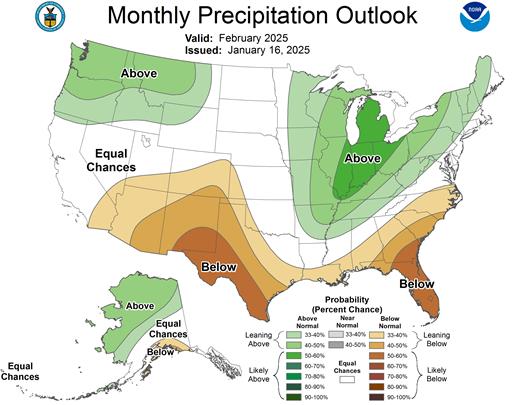
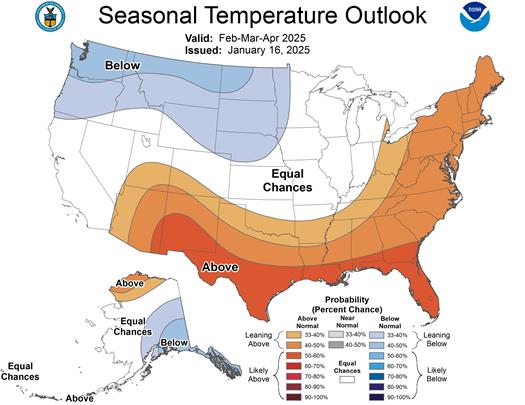
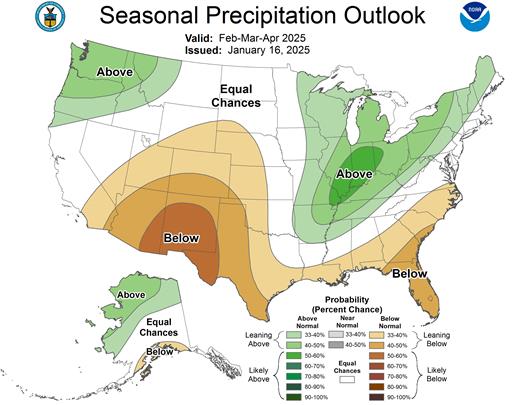
Weather Forecast & Seasonal Outlook
|
|
|
|
|
|
|
|
|
|
|
|
|
|
|
|
|
|
|
|
|
|
|
|
|
|
|