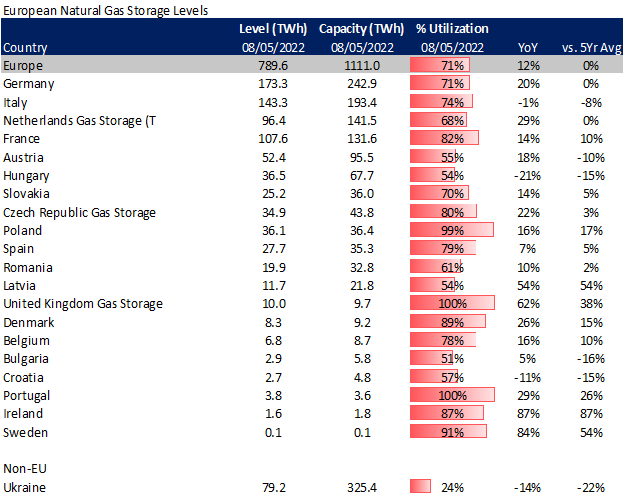
This week we start by looking at the critical position Europe has been in with the drop in Russian flows. At the top line, European storage levels have hit 71% as of August 5th which is right in line with the 5Yr average. Below we will outline the change in supply from domestic production, imports, and LNG sendout.

To keep the markets balanced we have observed an extreme price response in European markets, and it seems to be working so far. As seen in the chart below, TTF summer prices have traded at a continuous premium to Asian markets to attract every last LNG molecule and simultaneously reduce natural gas consumption.

From the consumption side, we see mainly a response from the industrial load with little to no impact on the power or LDC sector. The following series of charts put together the story needed to keep storage levels at the 5Yr average.
Russian natural gas imports:
(The 3 main inflows from Russian come via Mallnow, Velke Kapusany, and Nordstream1)


Main Non-Russian natural gas imports:


Total LNG Imports:

Domestic Production:


European Continent Natgas Consumption:


NatGas Storage Fundamentals:
The EIA reported a +41 Bcf injection for the week ending Jul 29th, which came in higher than the market consensus and our final estimate of +37. Although this number was off the consensus, our flow model was very lined up with this level of injection. It was the SnD model that failed this past week.
This storage report takes the total level to 2457 Bcf, which is 268 Bcf less than last year at this time and 337 Bcf below the five-year average of 2,794 Bcf.
What’s the push behind the higher injection week-on-week? It appears these are top contenders driving the story
1) weather moderating after extreme heat during the week ending July 22. The non-linear relationship between extreme heat and demand shot burns to an extreme level for the week ending July 22. For the reported week, we see power burns fall to more digestible levels.
2) wind generation jumping above normal levels once again, which
3) a jump in coal generation that ate into gas burns. This is the highest level of week coal usage we have seen since Aug 2021.
Here is a look at how the weather looked last week relative normal and the previous week:

So after a very tight number, the market flips to a loose number. The reasons above help fill in the gaps.
Overall, we see this +41 Bcf injection being +1.5 Bcf/d loose vs the historical rolling 5-week period (wx adjusted). The chart below builds in a rolling 5-week regression centered around the last EIA report – week #31 or week ending July 29th. The lines for 2018-2021 essentially show the resulting injection in those years (during week 29 through 33) if they experienced the same temps as this current summer (historicals + the 15-day forecast).


For the week ending Aug 5th, our early view is +37 Bcf. This reporting period will take L48 storage level to 2,494 Bcf (-275 vs LY, -345 vs. 5Yr). This upcoming report slightly helps us reduce the deficit to last year. Last year we injected +44 Bcf during the same week.

During the past week, weather in most regions continued to trend above normal. That being said, we are now in the summer phase where we observe a seasonal downtrend in CDDs. With that, we saw the L48 population wt. CDDs lower by -0.9F versus the previous week.

Domestic dry gas production was higher week-on-week with the rise to record daily levels last weekend. As we noted in the daily reports, the big jump from the SC and NE was short lived. We ended up settling the week at around 97 Bcf/d, which is still 3 Bcf/d higher than last year. For this past week, the average production was recorded at 97.7 Bcf/d, or 0.5 Bcf/d week-on-week.

Deliveries to LNG facilities averaged 10.9 Bcf/d last week, which is 0.2 Bcf/d higher than the previous week. Sabine Pass was the only facility that received more flow.

Also to note, is the big fiasco with Freeport LNG. Every mention of timing of this facility sends the market shooting higher or lower. So it appears that we are more than likely going to see the terminal fully operational by early October to meet contractual obligations. The “leaked” PR (the more complete one) had 4 additional paragraphs with loads of good info. Here are the main takeaways:
- Freeport LNG definition of a partial start-up means they will simply operate with two storage tanks vs three. (Sabine has been operating in that manner since early 2018)
- Final findings of the route cause will with be determined through metallurgical testing in mid-Sept.
- PHMSA is already less involved – daily to weekly meetings.
- a 60-notice has been submitted to the FERC, meaning the terminal could be up as early as Oct 1st.
Here is a write up including the “leaked” PR, and a link to the official Freeport statement.
All this means that end of summer storage estimates are going to move lower but roughly 30-60 Bcf, and more importantly this plant will be fully operational during the winter months. More fun in the Mar/Apr ahead.
This email, any information contained herein and any files transmitted with it (collectively, the Material) are the sole property of OTC Global Holdings LP and its affiliates (OTCGH); are confidential, may be legally privileged and are intended solely for the use of the individual or entity to whom they are addressed. Unauthorized disclosure, copying or distribution of the Material, is strictly prohibited and the recipient shall not redistribute the Material in any form to a third party. Please notify the sender immediately by email if you have received this email by mistake, delete this email from your system and destroy any hard copies. OTCGH waives no privilege or confidentiality due to any mistaken transmission of this email.
