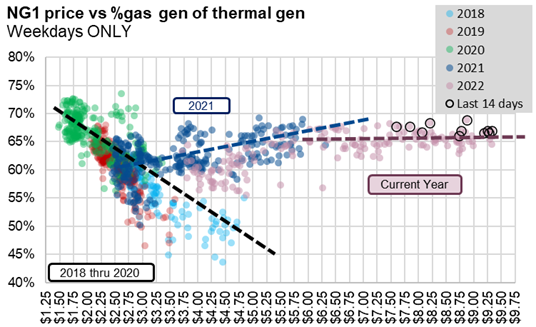
This week we start by looking at the EIA-930 data. With natural gas prices continuing to bounce around, natural gas generation continues to operate at a very stable level. The coal-to-gas switching element no longer exists like we once knew it. As can be seen, natural gas generation’s share of thermal generation continues to hold flat at the 64-67% level past $6/MMBtu.
![]() Source: Analytix.AI, EIA 930
Source: Analytix.AI, EIA 930
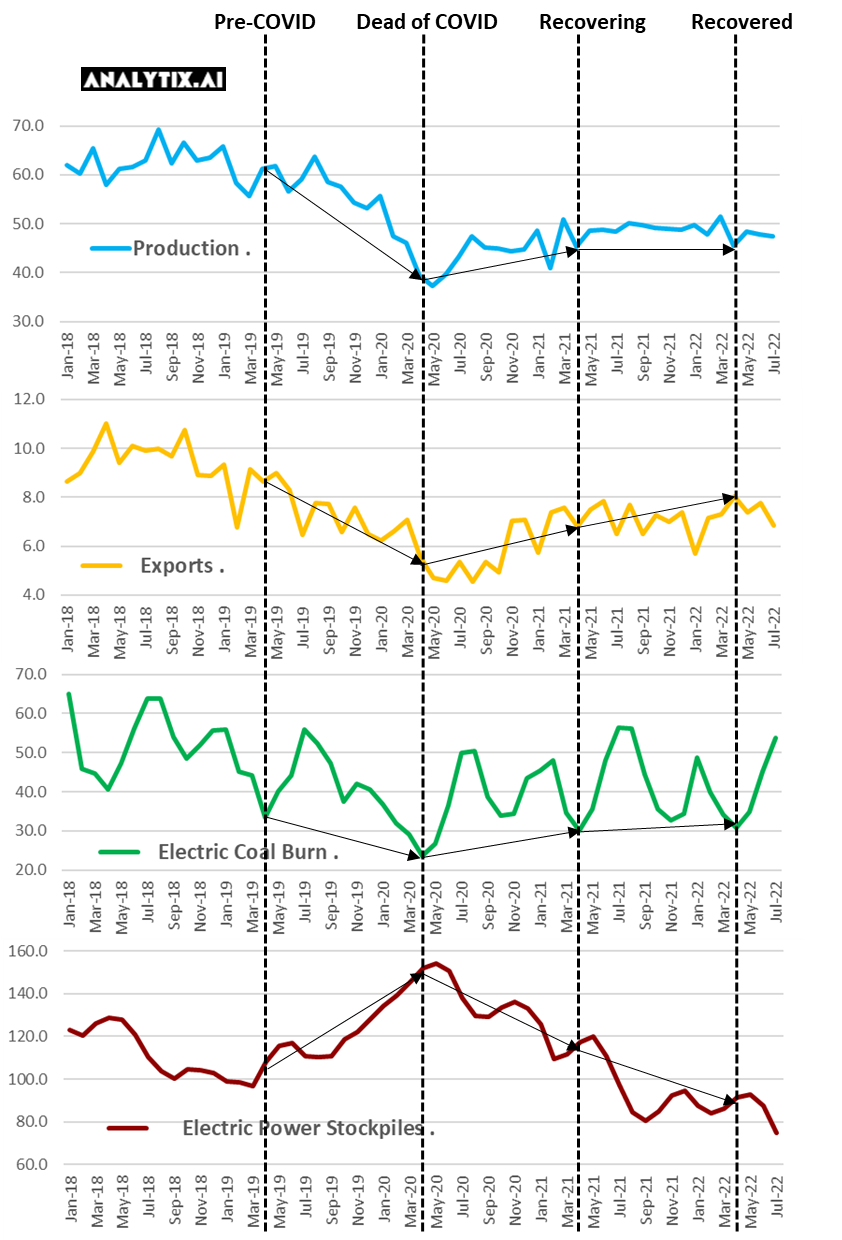
The primary reason for the loss of coal-to-gas switching flexibility is the massive coal supply shortage. The current coal shortage is the result of a combination of factors that started with COVID lockdowns.
2020: the lower electricity demand and low natural gas prices drove coal to burn to all-time lows. As a result, coal mines were altogether shut down or reduced output.
2021: US and global markets reopened leading to higher electricity demand. As a result, global natural gas prices spiked leading to soaring demand for coal. For the US this meant a massive reduction of stockpiles for local use and exports.
2022: global natural gas prices continued to soar with the Russian/Ukraine conflict, but production is unable to respond at the same rate due to mine closures and lack of labor.
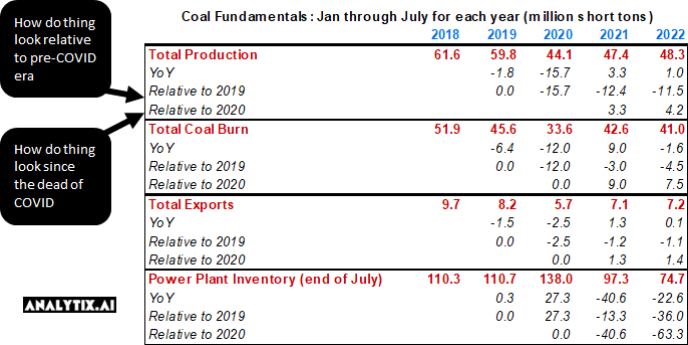
Source: Analytix.AI, raw data from EIA STEO
The table above tells a very compelling story of what’s leading to the current coal market imbalance:
1) coal production cannot respond quickly to increased demand. As can be seen above, coal supply has only been able to recover by 4.2 million short tons (MMSt) from 2020 to 2022, while coal burns and coal exports have increased by 7.5 MMSt and 1.4 MMSt.
2) after coal inventories ballooned to 138 MMSt in July 2020, the massive coal supply-demand gap has pushed coal power plant inventories to an all-time low.
Coal Exports:
After the war in Ukraine, the price of thermal coal has increased dramatically as European consumers look to import coal from the Eastern US to replace Russian coal. All uncommitted Eastern coals (NAPP, CAPP, and ILB) have been sold to export markets, which reduces the availability of coal to service US spot markets or rebuild inventory levels.
Coal Contacting:
Unlike natural gas pipe delivery, coal is difficult and expensive to transport. Coal generators typically contract 80+% of their coal 6-12 months in advance. This means that the coal gens need to have a pretty strong guestimate of how much coal they will burn over that time frame. The spot market for coal is non-existent because matching excess coal supply (if any) with rail transport is virtually impossible.
Chart marks April of each year.
NatGas Storage Fundamentals:
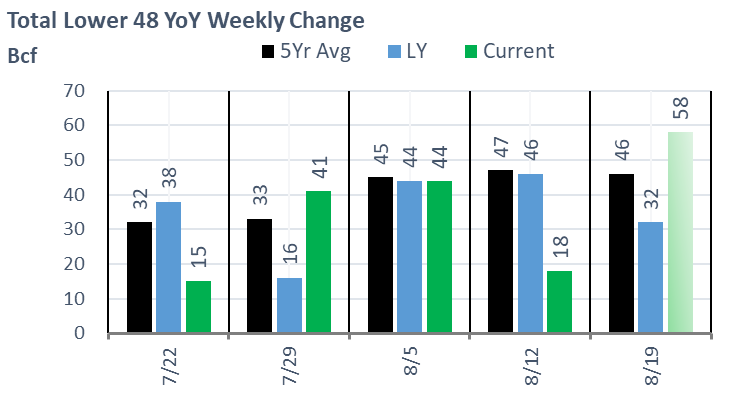
The EIA reported a +18 Bcf injection for the week ending Aug 12th, which came as a complete surprise to the market. 95% of estimates were at least over +20 Bcf; hence this one is tough to explain. There was a discrepancy between our flow model and SnD model this week, but we were still nowhere near the actual posted number.
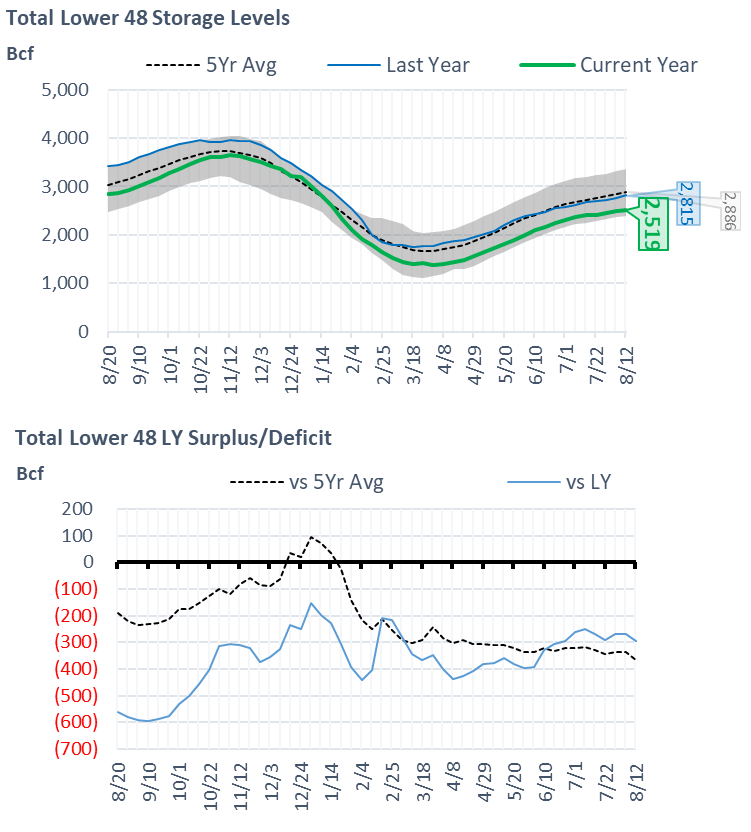
This storage report takes the total level to 2519 Bcf, which is 296 Bcf less than last year at this time and 367 Bcf below the five-year average of 2,794 Bcf.
Here are the few factors that help us understand the push behind the low weekly injection:
1) +0.8F more CDDs on average over the week leading to 1.3 Bcf/d of strong burns
2) lower Canadian imports with FM/maintenance on the Northern Borders pipeline, T-South, and GTN.
3) weak wind levels (more on that below)
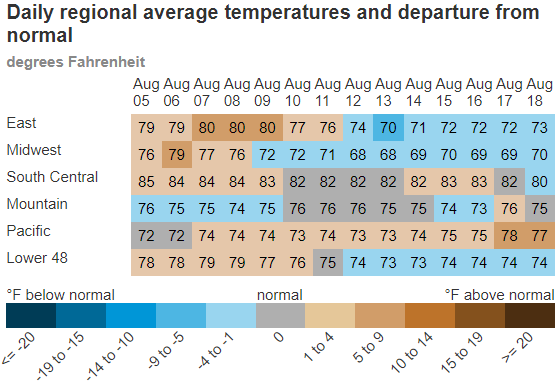
Here is a look at how the weather looked last week relative normal and the previous week:
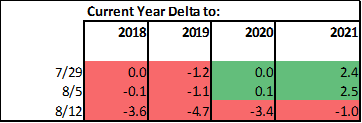
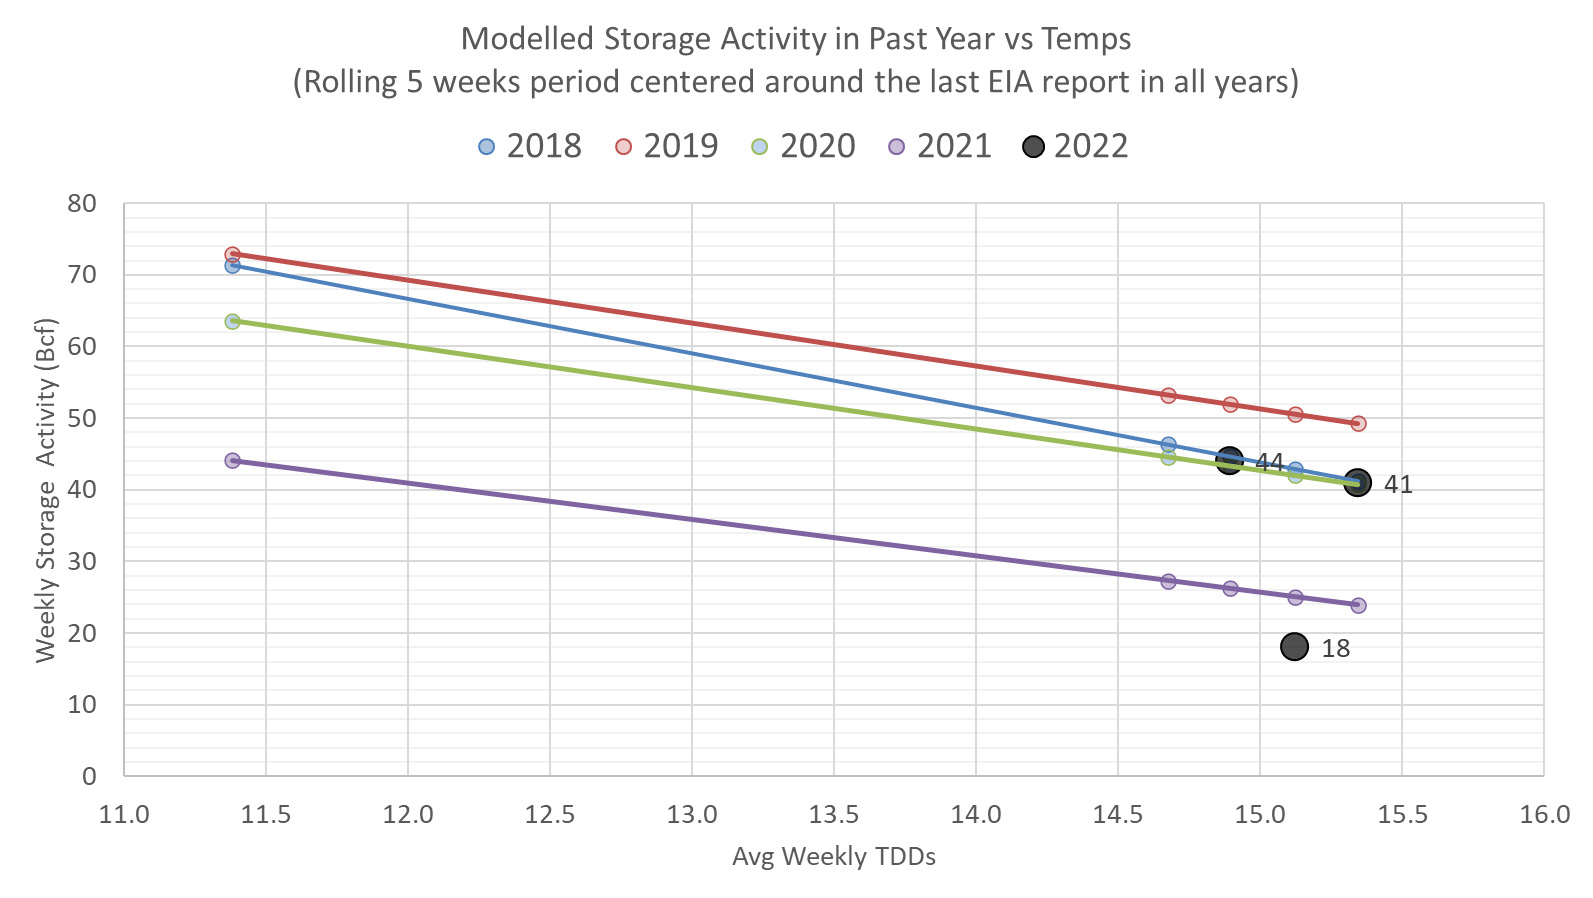
So after back-to-back loose numbers, this number lies on the other extreme. We calculate the +18 Bcf injection being -1.0 Bcf/d tight YoY wx adjusted. [We compare this report to LY’s rolling 5-week regression centered around week #33 or week ending Aug 12th.
The image below shows the same data in chart format. The lines for 2018-2021 essentially show the resulting injection in those years (during week 31 through 35) if they experienced the same temps as this current summer (historicals + the 15-day forecast).
Take this one step further, we now #wind adjust the storage number as the level of wind generation largely influences power burns. For this reporting period, the wind average came in much below expected levels for this time of the year and at this level of installed capacity. For week ending Aug 12th, wind generators produced 32.8 GWh of power while we should have expected 35-36 GWh according to our math; hence the low wind generation added approximately 0.6 Bcf/d or 4 Bcf/week of power burns.
Was this a completely random number? Yes and no. Remember the +15 Bcf injection for week ending July 22nd. That report came in -0.85 Bcf/d tight wx adjusted (based on the same methodology as above). A few things to remember from that storage report: 1) domestic dry gas production was 1-1.5 Bcf/d lower than week ending Aug 12th 2) that particular week was the hottest week of the year with some extra non-linear PB 3) wind levels were stronger than expected leading to lighter burns.
Without getting too technical, this past report was somewhat in line with week ending July 22nd.
So back to the surprise – in the last four weeks we had two very loose numbers and two very tight numbers. What to expect next?
For the week ending Aug 19th, our early view is +58 Bcf. This reporting period will take L48 storage level to 2,577 Bcf (-270 vs LY, -355 vs. 5Yr). This upcoming report should help reduce the YoY deficit. Last year we injected +46 Bcf during the same week.
During the past week, the weather in most regions cooled significantly. This kept the L48 population wt. CDDs below normal for the first time in months, and -4.7F versus the previous week. Wind also continued to drop this week, with wind levels at 27.9 aGWh. Based on our calculation, this level is 10 aGWh behind normal, leading to 1.8 Bcf/d of additional burns.
Domestic dry gas production fell slightly week-on-week with maintenance reducing production out of some key regions. The biggest contributor to the lower flows was related to work at Targa Resources Red Hills processing plant in the Permian (NM) which resulted in steep declines in gas volumes that typically hit NGPL and Transwestern. The impacted plant processes 0.97 Bcf/d and is located in Lea County, NM. Although the plant was supposed to be out until late-Sept, it appears that production rebounded in the region by Friday.
For the week, the average production was recorded at 98.3 Bcf/d or -0.6 Bcf/d week-on-week. Overall production has been trending higher to new highs, specifically out of the Permian and Haynesville regions.

Deliveries to LNG facilities averaged 10.9 Bcf/d last week, which is flat with the previous week. There was a bit of movement amongst all the plants, but nothing notable this week other than Calcasieu Pass trending to hits peak levels late in the week.
This email, any information contained herein and any files transmitted with it (collectively, the Material) are the sole property of OTC Global Holdings LP and its affiliates (OTCGH); are confidential, may be legally privileged and are intended solely for the use of the individual or entity to whom they are addressed. Unauthorized disclosure, copying or distribution of the Material, is strictly prohibited and the recipient shall not redistribute the Material in any form to a third party. Please notify the sender immediately by email if you have received this email by mistake, delete this email from your system and destroy any hard copies. OTCGH waives no privilege or confidentiality due to any mistaken transmission of this email.