This week we start by looking for evidence of any consumer-led demand destruction after reading a great Bloomberg article suggesting that 20M US homes are behind on their energy bills – that’s 1 in 6 Americans.
According to the National Energy Assistance Directors Association (Neada), the surge in power bills has resulted in billions of dollars of unpaid bills across the country. The article cited a few examples. California’s PG&E Corp said there had been a 40% jump in the number of residential customers behind on payments since February 2020, while New Jersey’s Public Service Enterprise Group (PSEG) reported a 30% rise in customers that were 90 days behind on payment in since March.
We have heard that customers are readjusting their power usage lower and now this article confirms customers are being turned off by their local utilities. With the staggering number of customers that could be impacted, we wanted to check to see if this was showing up in the data.
Below is a series of 3 charts that show US summer CDDs and power demand:
1) Average daily pwCDDs compared to LY and the 10Y Normal.
2) Cumulative summer pwCDDs compared to LY and the 10Y Normal
3) Weekday pwCDDs vs US aggregate power load for this summer and last
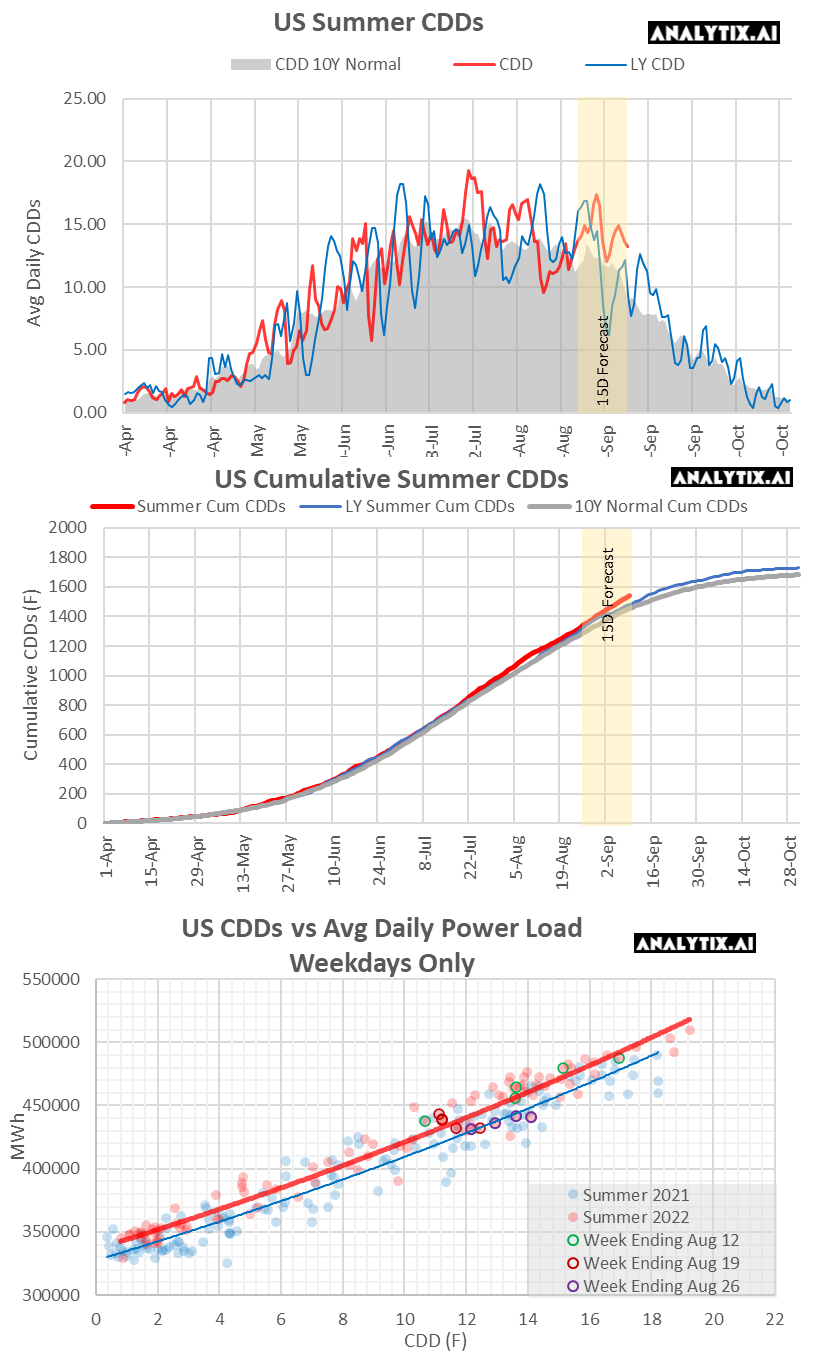
Our conclusion: There is not enough convincing evidence that demand has been altered relative to past years (we’re surprised). Based on the summer-wide data, the extreme power bills and power cut-offs do not look like they have impacted power consumption considerably. That being said, the last week had lower power usage than expected (purple circles). This could be the result of mass holidays before the start of school or maybe it is the first signs of a delayed response due to power bills just coming in for July. If the latter, this can be quite bearish as we make our way towards winter.
We build out the 3 series chart for all major power markets, and the data shows some interesting results. Shoot me an email at het@analytix.ai if you want to see it and have any further questions.

NatGas Storage Fundamentals:
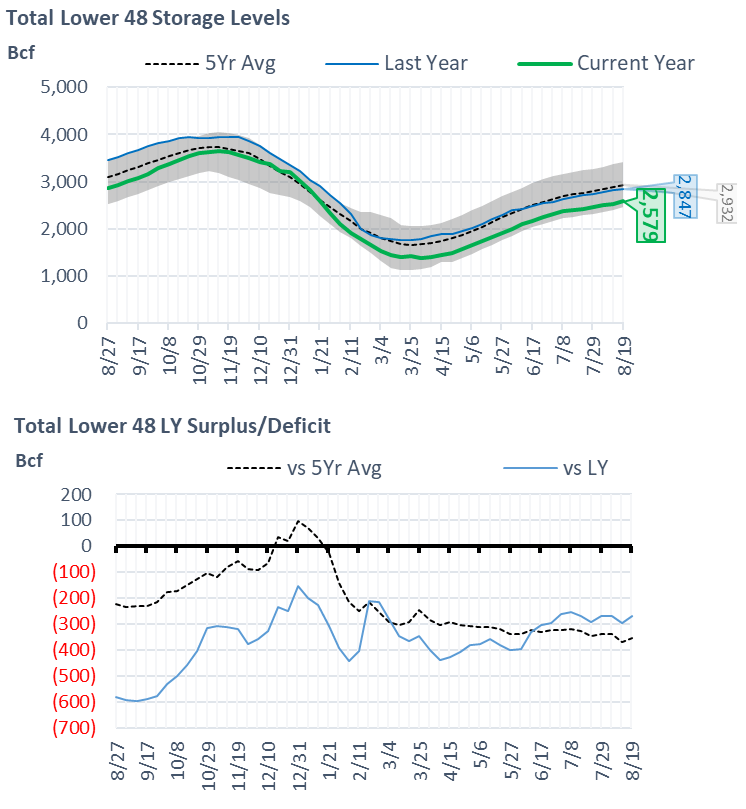
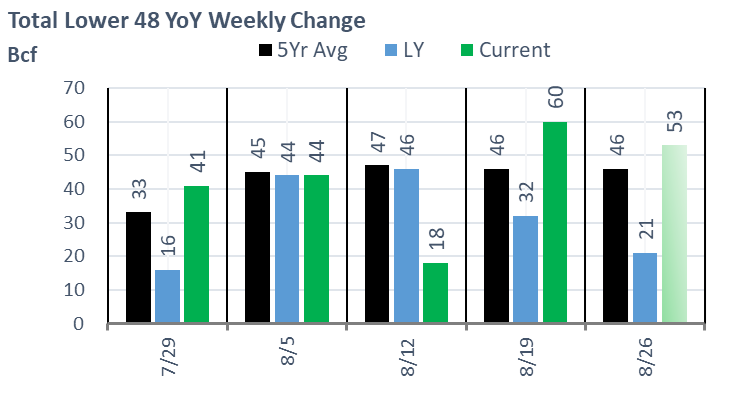
The EIA reported a +60 Bcf injection for the week ending Aug 19th, which was right on target. We have not seen the report fall within the tight range of our SnD and flow model in some time.
This storage report takes the total level to 2579 Bcf, which is 268 Bcf less than last year at this time and 353 Bcf below the five-year average of 2,932 Bcf.
Here are the few factors that moved the storage number last week:
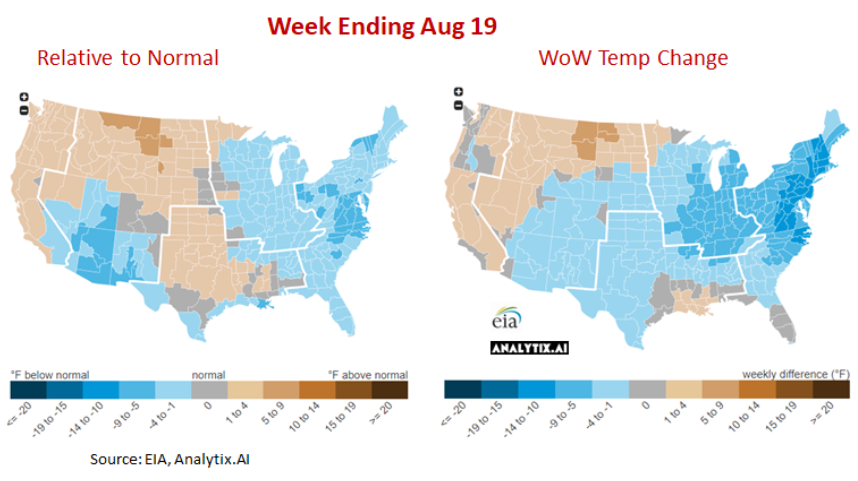
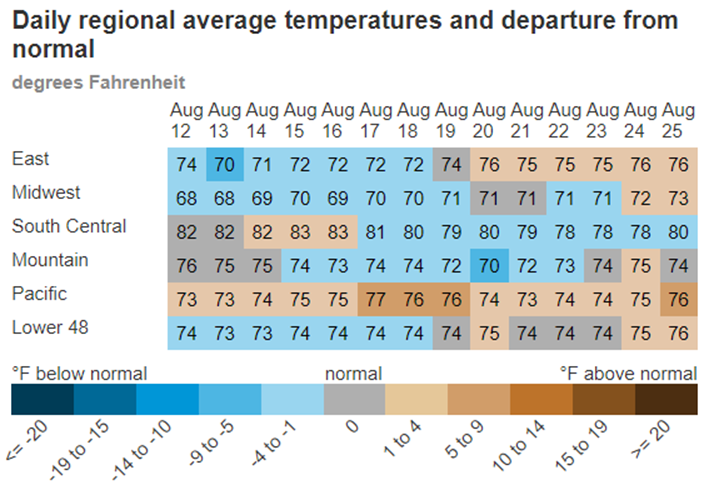
1) -4.7F fewer CDDs on average over the week leading to 6.1 Bcf/d of less burns. As can be seen in the map below, a good portion of the Midwest and Eastern corridor cooled to normal temps.
2) lower Canadian imports with FM/maintenance on the Northern Borders pipeline, T-South, Great Lakes, and GTN.
3) weak average wind generation of 28.4 aGWh (-4.6 aGWh WoW, -9.0 aGWh vs Expected). If we had hit the expected wind generation levels, we would have seen 1.7 Bcf/d of less burns (more on this below).
Here is a look at how the weather looked last week relative normal and the previous week:
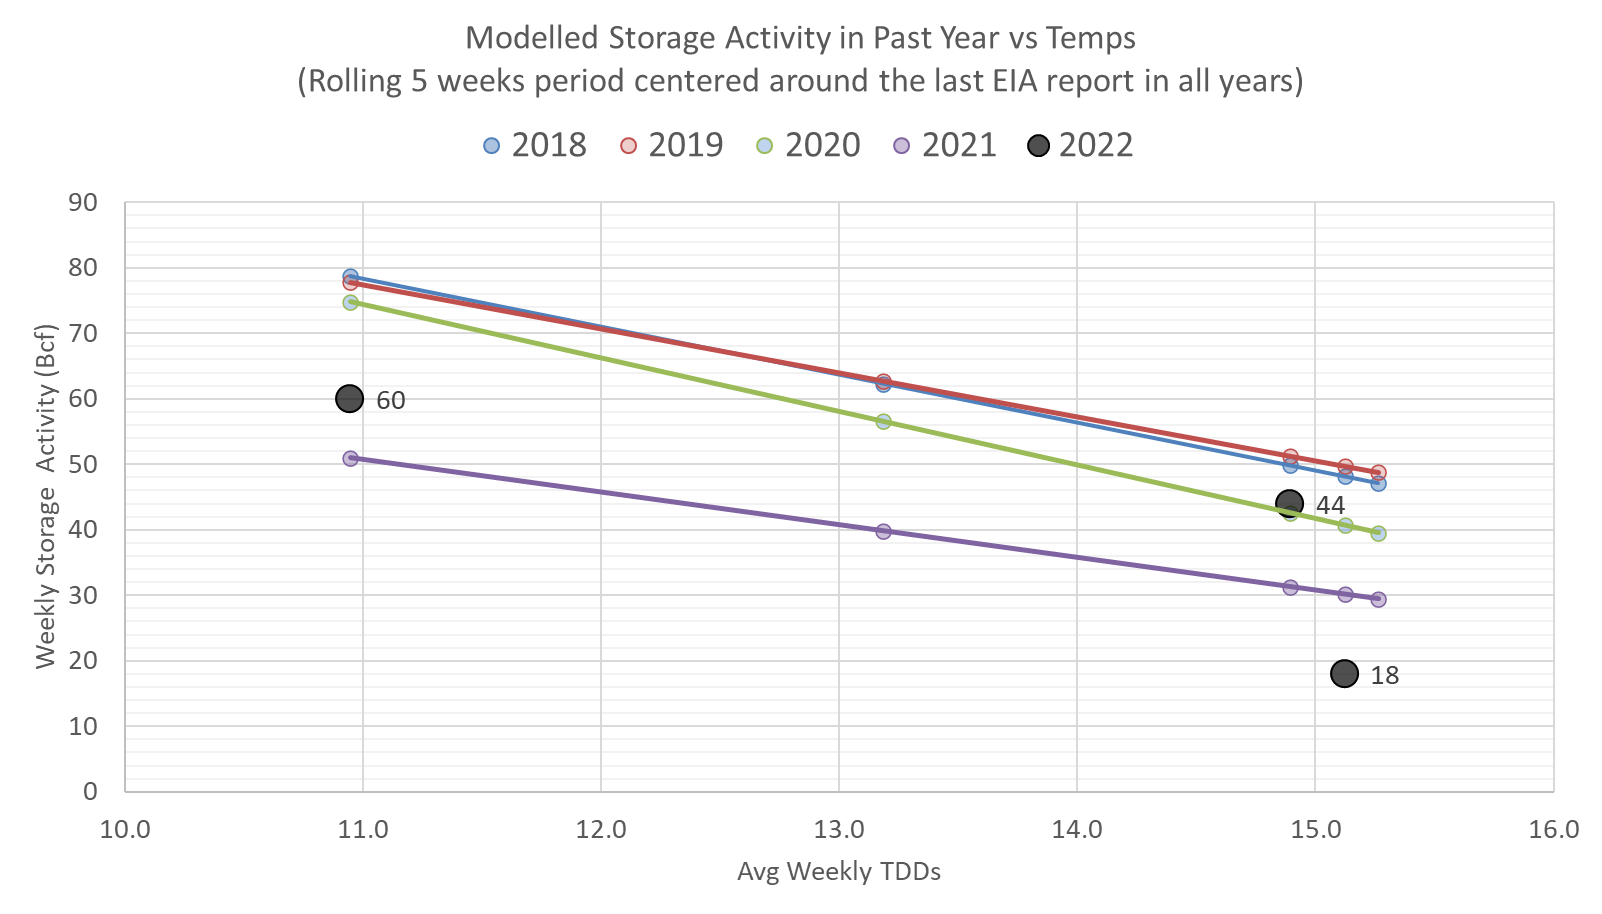
We calculate the +60 Bcf injection being +1.3 Bcf/d looseYoY wx adjusted. [We compare this report to LY’s rolling 5-week regression centered around week #34 or week ending Aug 19th.
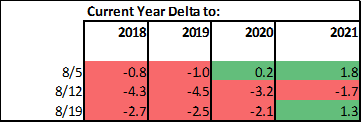
The image below shows the same data in chart format. The lines for 2018-2021 essentially show the resulting injection in those years (during week 32 through 36) if they experienced the same temps as this current summer (historicals + the 15-day forecast).
Take this one step further, we now #wind adjust the storage number as the level of wind generation largely influences power burns. For this reporting period, the wind generation level once again came in much below expected levels for this time of the year and at this level of installed capacity. The middle two weeks are typically the lowest wind weeks, we are seeing wind gen levels follow that pattern closely this year. For week ending Aug 19th, wind generators produced 28.4 GWh of power while we should have expected 37-38 GWh according to our math; hence the low wind generation added approximately 1.7 Bcf/d or 12 Bcf/week of power burns.
The takeaway is that if the wind was blowing then this report was quite loose. Normalizing for #weather and #wind suggests this report was +3.0 Bcf/d loose relative to LY.
For the week ending Aug 26th, our early view is +53 Bcf. This reporting period will take L48 storage level to 2,632 Bcf (-236 vs LY, -346 vs. 5Yr). This upcoming report should help reduce the YoY deficit. Last year we injected +21 Bcf during the same week.
During the past week, we saw weather remain warm in the Pacific and warm up across the East coast. This kept the L48 population wt. CDDs grew by 2.1F versus the previous week. Wind also continued to weaken with wind levels at 23.4 aGWh. Based on our calculation, this level is 14.5 aGWh behind normal, leading to 2.7 Bcf/d of additional burns.
Domestic dry gas production rose slightly week-on-week with the completion of some maintenance. The biggest contributor to last week’s drop was related to work being done at the Targa Resources Red Hills processing plant in the Permian (NM). Although the plan called for work to be completed in late-Sept, we see volumes recovered from the area. Either the plant is partially operational or the wet gas volumes are being shifted to another nearby processing facility.
For the week, the average production was recorded at 98.7 Bcf/d or +0.6 Bcf/d week-on-week. Overall production has been trending higher to new highs, specifically out of the Permian and Haynesville regions. The Northeast basins are still about 1.5 Bcf/d below their winter highs.
One note of the Northeast production before we move on. The team at SynMax put out some data on Northeast frac crews on Friday. They suggest that NE production is not lower (<34 Bcf/d) due to maintenance, but could be more related not enough new wells coming online to keep up with the steep shale decline curves. If this is the case, it will be interesting to see where production trends this winter from the App basin. Typically NE production rises in the winter as regional demand (and cash prices) pick up and pipeline takeaway capacity opens up – but maybe not the case this year. Could be an interesting story brewing for NE basis and overall tighter SnD this winter.
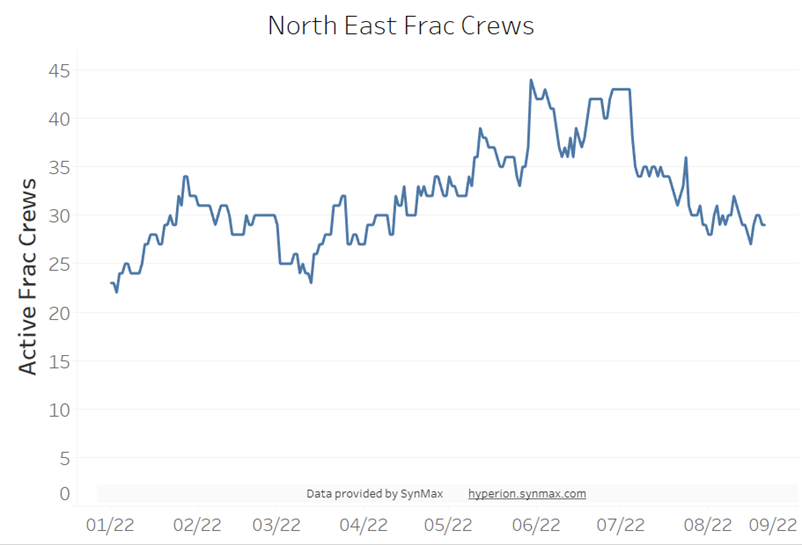
Source: https://twitter.com/SynMaxData/status/1563151404898074625
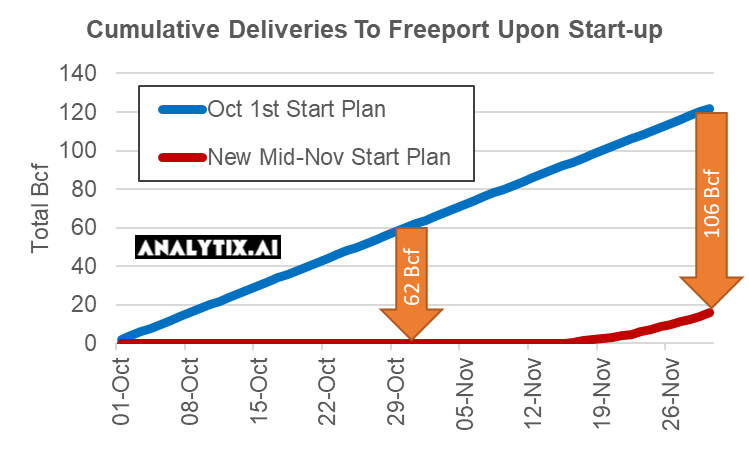
Deliveries to LNG facilities averaged 11.1 Bcf/d last week, which is slightly higher than the previous week. There is nothing notable about LNG flow this week, but we can reiterate some of the latest info released by Freeport LNG on start-up plans.
Freeport stated on Wednesday around 1:15pm EST stating a clearer restart timeline. Here is the official statement from Freeport:
“that initial production can commence in early to mid-November, and ramp up to a sustained level of at least 2 BCF per day by the end of November, representing over 85% of the export capacity of the facility. The recovery plan will utilize Freeport LNG’s second LNG loading dock as a lay berth until loading capabilities at the second dock are reinstated in March 2023, at which time we anticipate being capable of operating at 100% of our capacity”
Our original timeline suggested that the facility was planned to be operational by Oct 1st. This comes from the last press release they issued that stated they submitted the 60-day restart notice to FERC at the beginning of August. With the latest press release, we now assume that the facility brings on the first train on Nov 15th, the next one a week later, and the full 3 trains by the end of Nov. In this scenario, we calculate approximately 106 Bcf of natural gas being diverted back to US storage by the end of Nov.
Another interesting note in the press release was the suggestion that the export capacity of 2 Bcf/d was 85% of facility operation. Before the incident, 2.22 Bcf/d was the highest volume of natural gas delivered to the facility. This volume includes roughly 5% onsite usage (less than other LNG facilities since Freeport is primarily powered up by the local power grid). So the latest statement now suggests that full export capacity is 2.35 Bcf/d and that the facility could take as much as 2.47 Bcf on a daily basis past March 2023. This new higher export capacity level was authorized by the FERC recently after Freeport made a filing to the FERC in mid-2021 to increase its authorized level from 782 Bcf/year to 870 Bcf/d. FERC approved this expansion on July 28th, 2022.
Links:
https://news.bloomberglaw.com/safety/freeport-lng-expansion-authorized-by-regulators-after-explosion
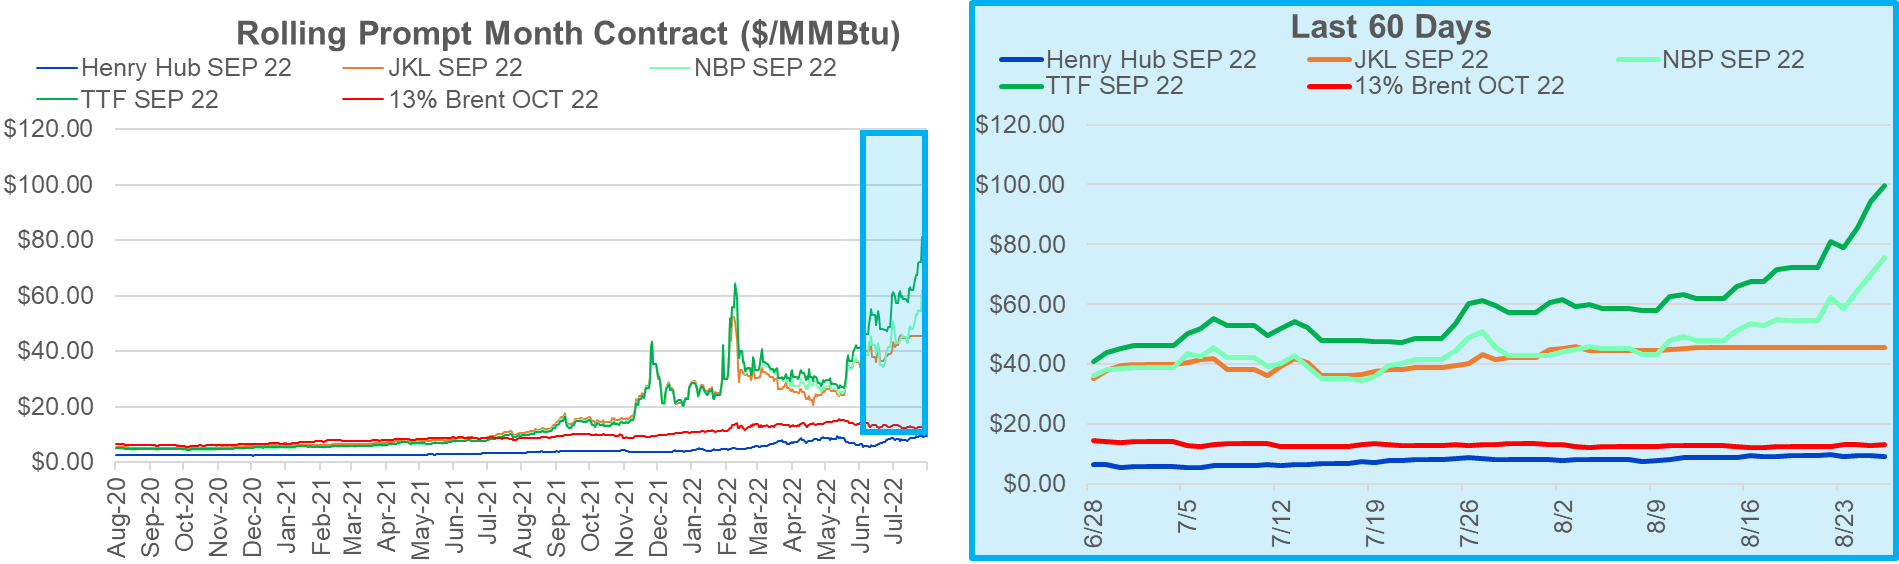
Finally we end with a chart on global natgas prices. TTF hit $100/MMBtu!
This email, any information contained herein and any files transmitted with it (collectively, the Material) are the sole property of OTC Global Holdings LP and its affiliates (OTCGH); are confidential, may be legally privileged and are intended solely for the use of the individual or entity to whom they are addressed. Unauthorized disclosure, copying or distribution of the Material, is strictly prohibited and the recipient shall not redistribute the Material in any form to a third party. Please notify the sender immediately by email if you have received this email by mistake, delete this email from your system and destroy any hard copies. OTCGH waives no privilege or confidentiality due to any mistaken transmission of this email.