This week we give an update on Freeport LNG expectations and also analyze how LNG liquefaction operations with changes in ambient temps.
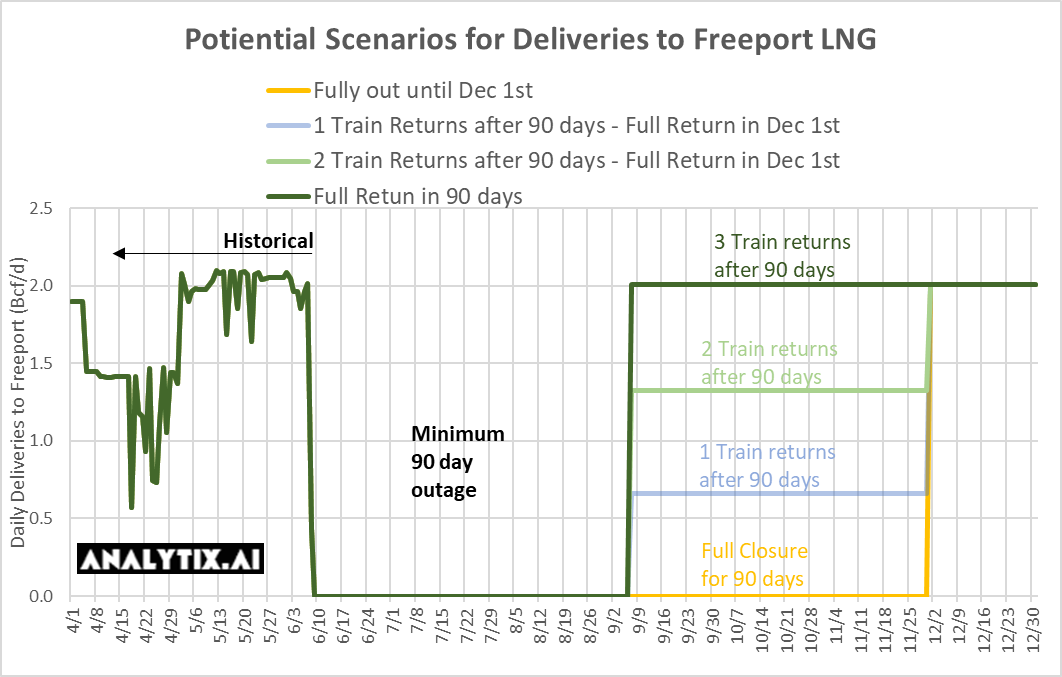
Due to damage from last week’s fire, Freeport LNG says its Gulf Coast LNG liquefaction plant will not resume full operations until the end of 2022. The corporation estimates that partial operations could resume in about 90 days.
The news was revealed in the company’s most recent fire update, which contained some preliminary results from its investigation into the incident. The incident happened in pipe racks that support the transfer of LNG from the facility’s storage tank area to the terminal’s dock facilities. The preliminary findings suggest that the event was caused by the overpressure and rupture of a segment of an LNG transfer line, resulting in the rapid flashing of LNG and the discharge and igniting of a natural gas vapor cloud.
According to the US Department of Energy, the Freeport LNG facility loaded 21 cargoes in March, carrying an estimated 64 billion cubic feet of gas to destinations in Europe, South Korea, and China, up from 15 cargoes in February and 19 in January.
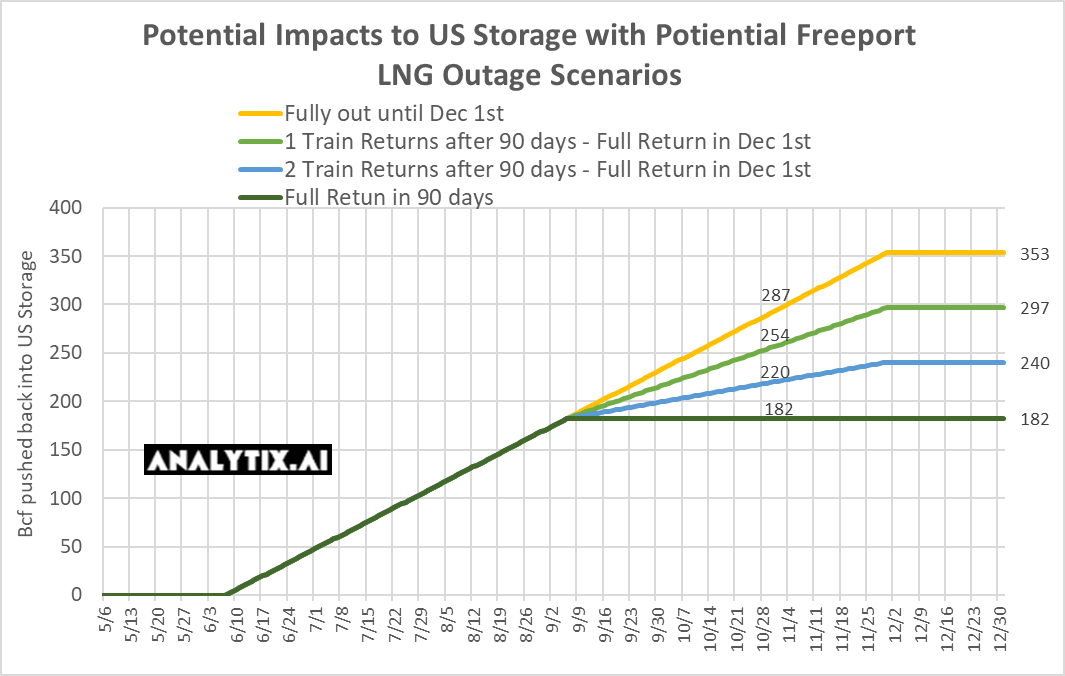
The new timeline projections are longer than originally estimated, adding to the global LNG market’s already constrained supply as a result of Russia’s invasion of Ukraine. That being said, US storage levels are now expected to reach more comfortable levels by end of this summer. The storage deficit should be reduced by 182 to 287 Bcf by the end of Oct.
Here is our latest projection of the impact of the Freeport outage.
Now, on to the next point, we wanted to discuss, which will reinforce reduced US LNG flows in the coming months. In most years, LNG shipments drop throughout the summer months due to lower demand, but this year, Europe is scooping every molecule it can to meet its winter storage needs. With the reduced flows on Nord Stream 1, this has become even more important.
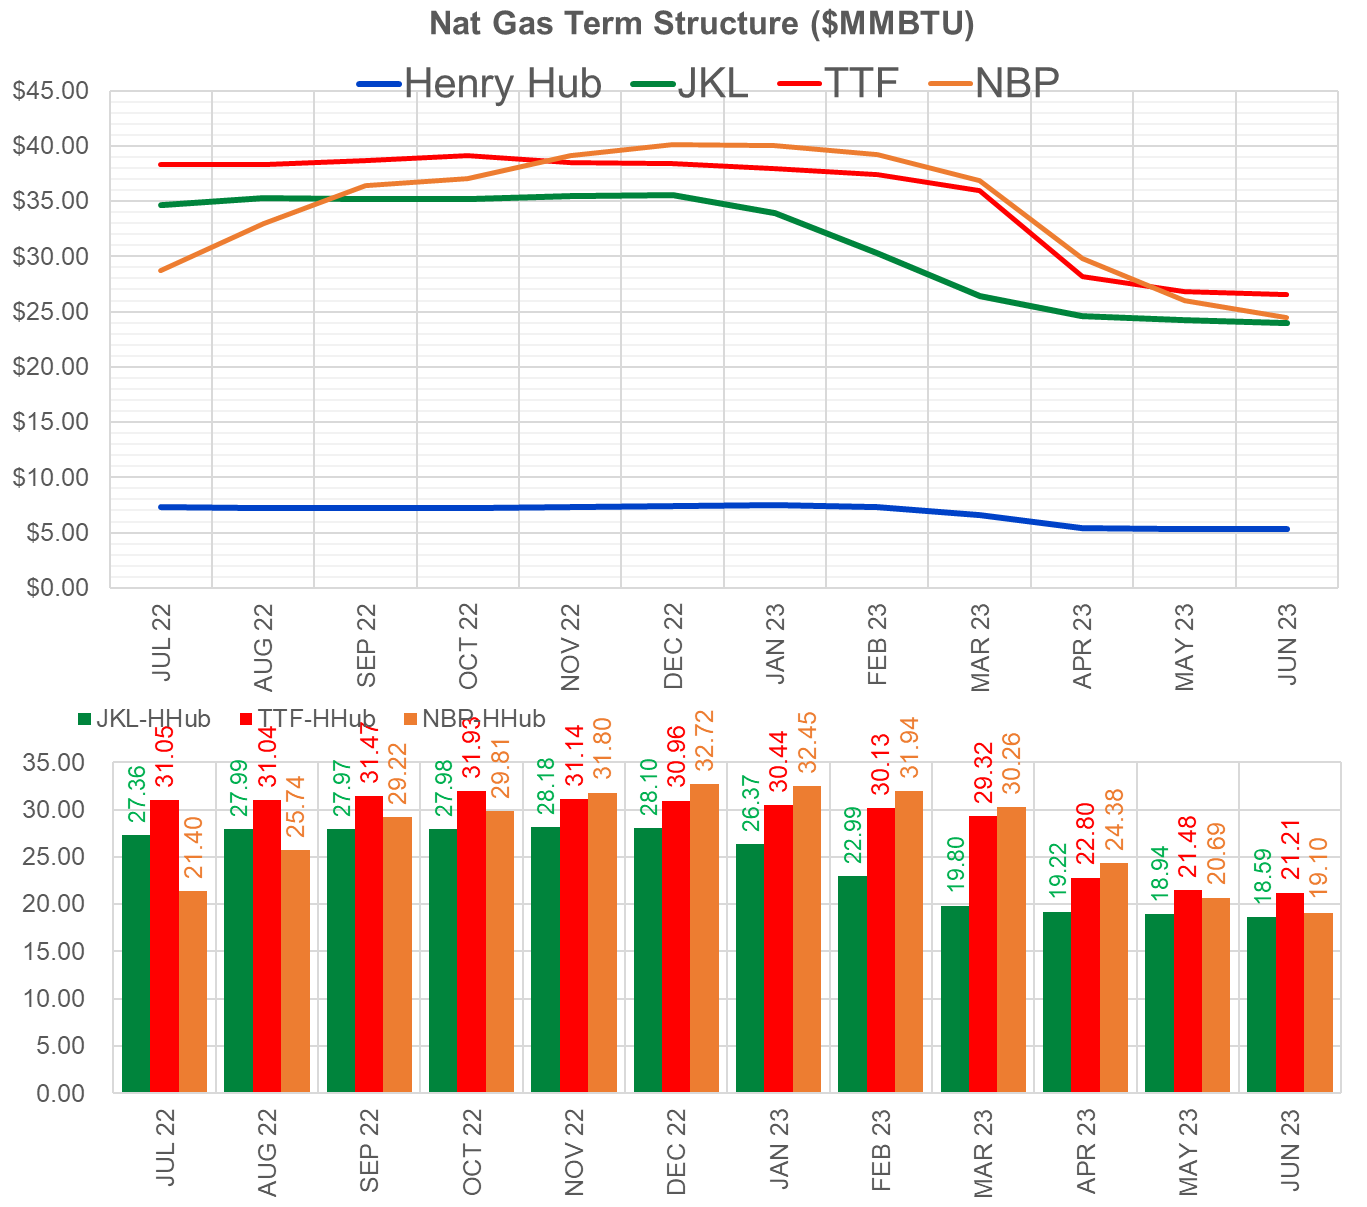
The arbs between the gulf coast and TTF/NBP/JKM blew out further this past week. At the moment, Europe is the preferred destination which is helping get natural gas storage levels to respectable levels.
With the LNG flowing well in the money, we would expect US LNG facilities to move as much product as possible this summer. LNG facilities can operate above their design capacity, and this has been demonstrated from the daily flow data that we capture. The Cheniere facilities have been observed to operate 8-9% above the design capacity.
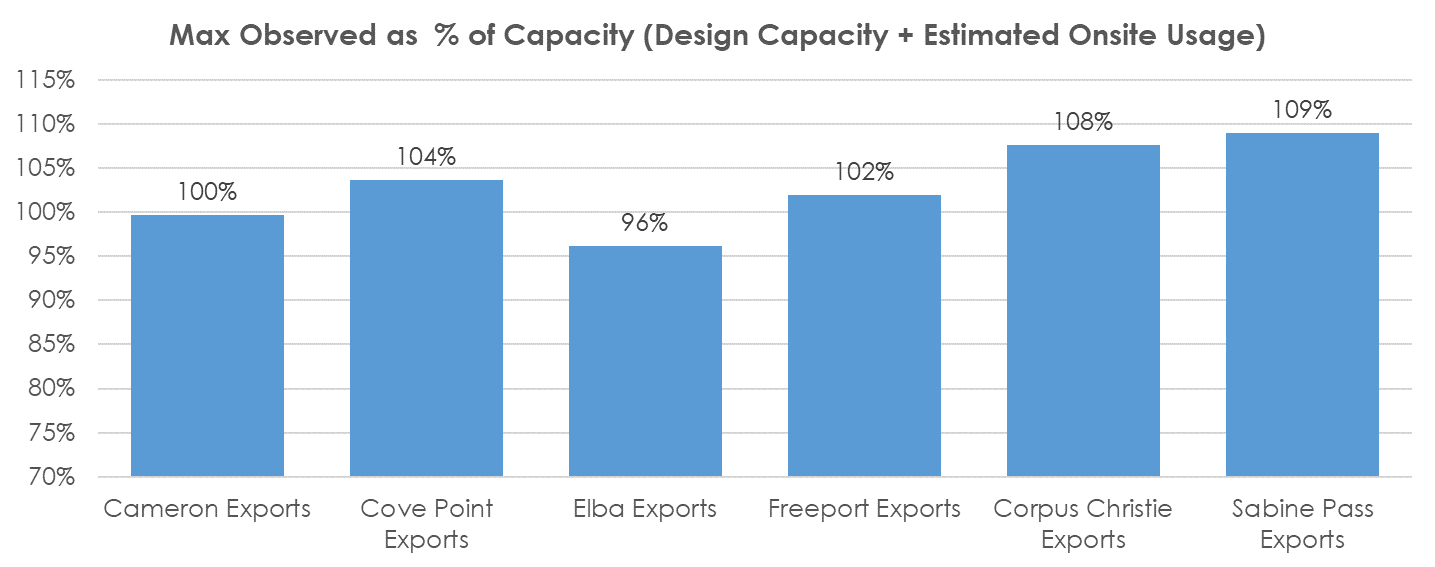
By our calculation, the design capacity + estimated onsite usage of the current facilities is 14.1 Bcf/d while the observed non-coincidental peak is 14.8 Bcf/d. The peak daily level we have seen is 13.75 Bcf on Mar 19th.

So what’s stopping LNG flows from at max observed levels this summer, other than the obvious forced majeure situation?
Here are the main reasons we came up with:
1) Plant and Feedgas Pipe Maintenance: typically each LNG train needs maintenance annually that lasts 1-3 weeks.
2) Above-ground storage of liquified gas is full: each facility requires some onsite storage to buffer the pace of liquefaction to tanker arrival.
3) Economic opportunity to sell gas back into the US market: LNG facilities can divert their gas to the market if cash prices are strong.
4) Extreme Weather Events: Heavy rain to hurricanes have an impact on facility operation.
5) Hot ambient temperatures slow operations.
Let’s focus on that last point today, which is usually not well understood.
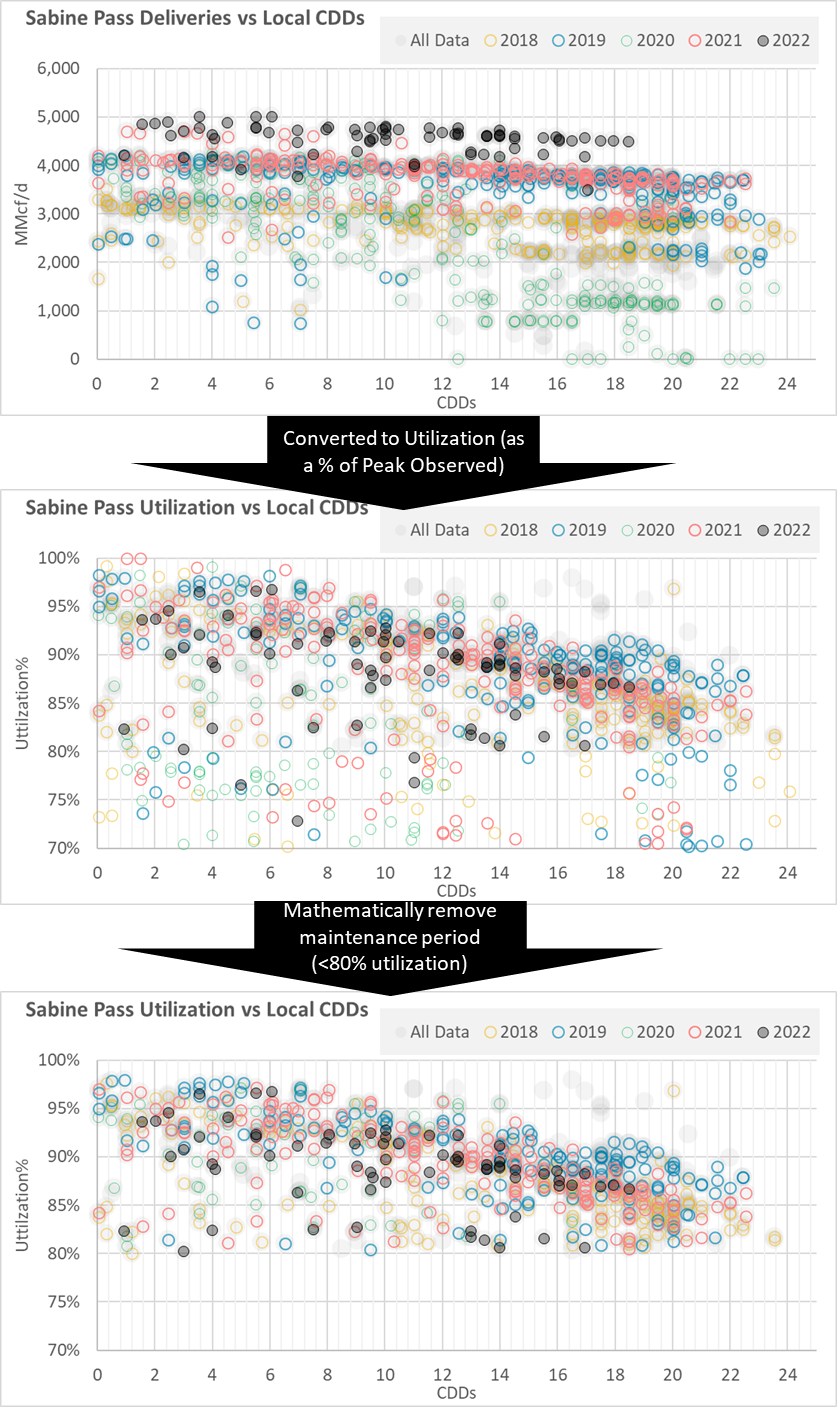
Here are some charts showing how the operations at the main Gulf Coast LNG facilities degrade as heat picks up. The charts show a cleaned-up version of daily temps vs. plant utilization (from max observed).
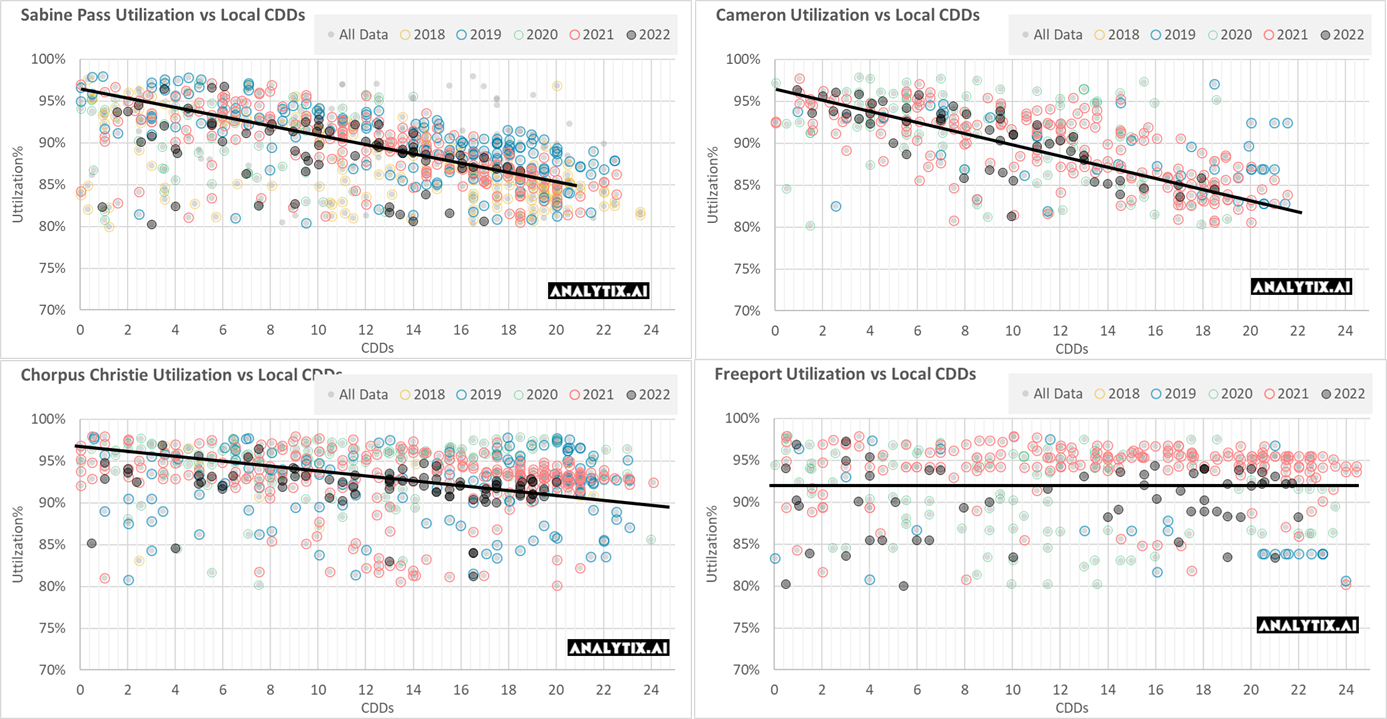
The impacts are quite large, where facility operations can drop by as much as 10% from optimal levels. I found a good explanation of the cause of this here:
Ambient conditions can have a significant impact on the overall operation of an LNG plant — particularly when it comes to liquefaction. Among all environmental factors, air temperature typically has the largest effect due to the fact that as it increases, the efficiency of turbines that drive the liquefaction process will decrease. This results in a corresponding decrease in the available power from the turbine, leading to a drop in overall production.
Coincidently, Freeport’s operations look unchanged with the weather, and that has to do with the facility being an all-electric drive motor plant. This method of powering up has its pros and cons, as the surrounding power grid operations can stall the plant if damaged, i.e. Hurricanes.
Using the data above, along with known maintenance, we can come up with a good estimate of plant utilization and LNG feedgas levels for the rest of summer. We now use this method for developing our end of season outlook.
NatGas Storage Fundamentals:
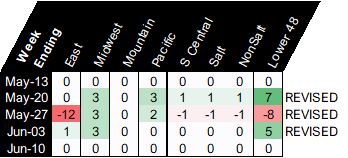
A revision is noted only if the net reported change to working gas levels exceeds 4 Bcf at either a regional or Lower 48 level. We typically do not see revisions across multiple regions and for multiple weeks; hence this one is a headscratcher.
I reached out to someone at the EIA, but he could not tell me much other than.. “announced revisions were not due to ANY EIA estimation issues”…meaning that the changes came straight from respondents. The main reasons for a revision are usually related to respondent error or reclassification of working and base storage (like PG&E LY).
With the latest revision, we get a triple-digit injection this quarter with the help of the long weekend demand dip and exceptional wind. The revisions all make sense to us except for the big hit to the East storage region for week ending May 27th. The scrape data shows >30 Bcf injection for the East, while the revised data now shows only 20 Bcf. This makes us believe there was some technical reassessment of a specific.
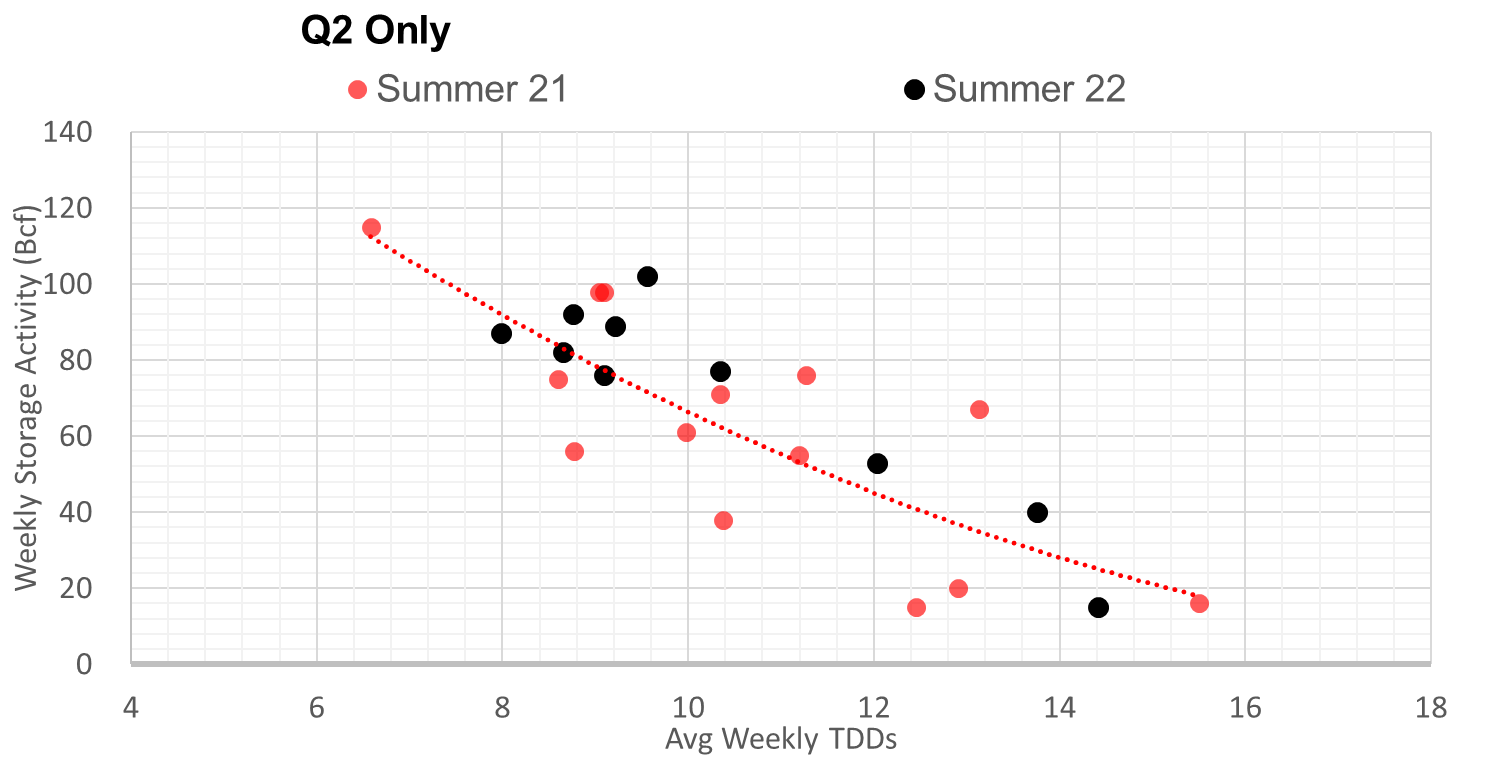
This storage report takes the total level to 2095 Bcf, which is 330 Bcf less than last year at this time and 323 Bcf below the five-year average of 2,418 Bcf. Overall, we estimate this +92 Bcf injection is ~1.9 Bcf/d loose vs last summer (wx adjusted). If we were to focus solely on the injection and weather relationship in Q2 2021 then this number was 1.5 Bcf/d looser (wx adjusted). See the chart below.
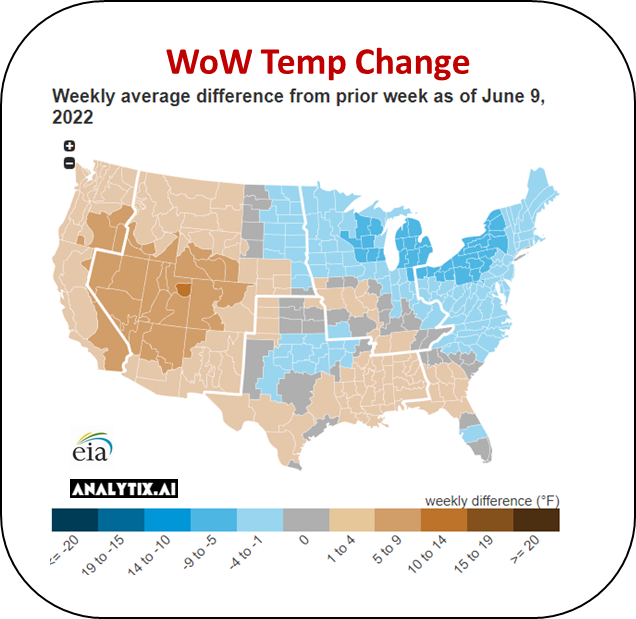
The lower injection week-on-week was due to more heat arriving in the West and South, and dropping wind.
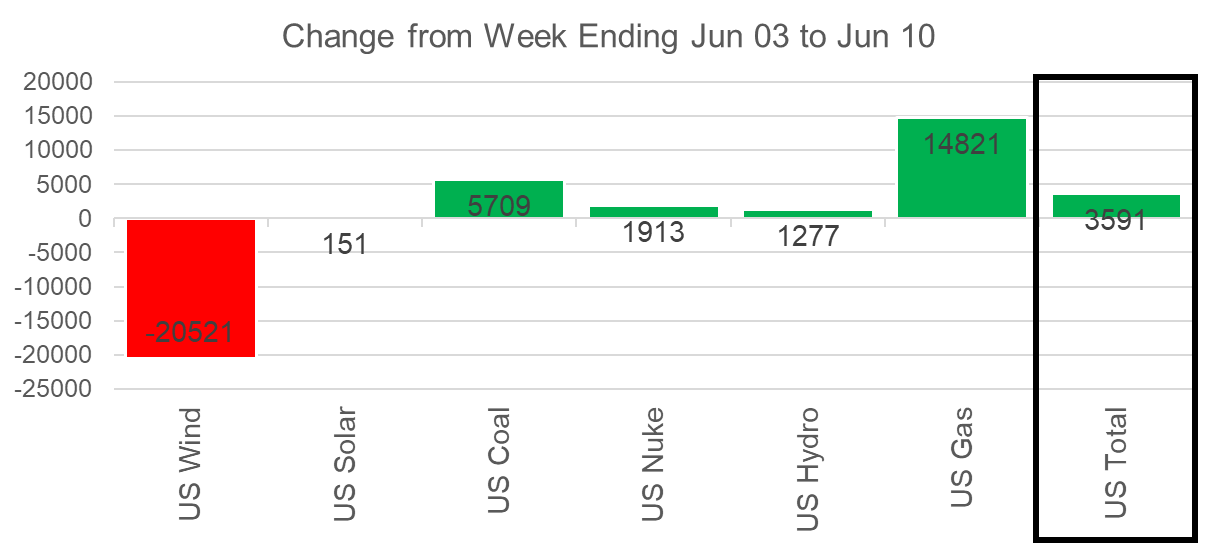
Here at the national level, we can see the bid drop in the wind that resulted in natgas and coal gen picking up.
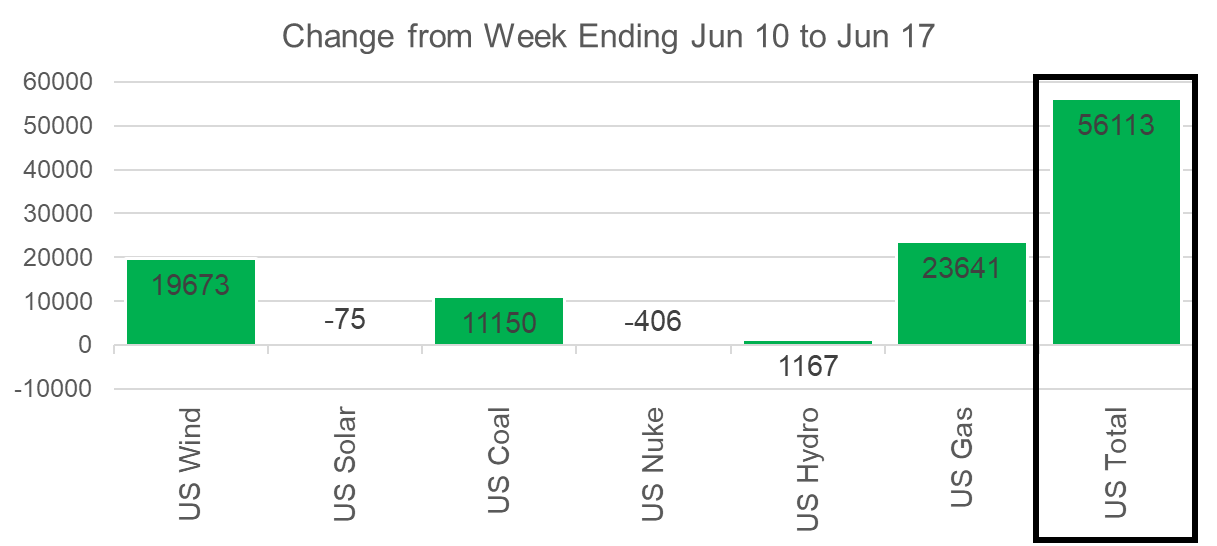
For the week ending June 17th, our early view is +59 Bcf. This reporting period will take L48 storage level to 2,154 Bcf (-320 vs LY, -346 vs. 5Yr). The full impact of the Freeport outage will be felt this week, which will start eating away at the storage deficit.
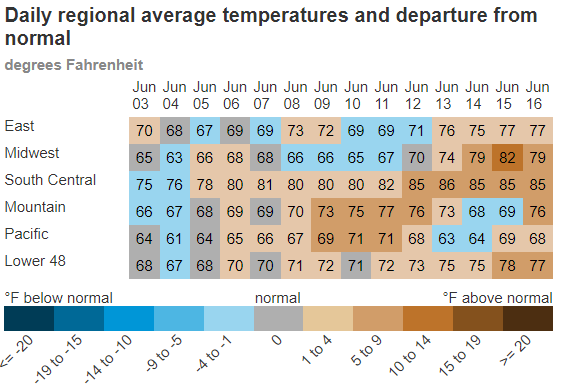
During the past week, we saw the heat pick up significantly with significant impacts on the ERCOT, MISO, and PJM regions. The net result was population wt. CDDs increased by 3.9F relative to the previous week.
With the exceptional heat in June, we see power load jumping by 11.6% week-on-week. Thankfully we saw a sizeable jump in wind which help alleviate the work thermal generation would have had to do otherwise. Natural gas gen jumped by an average of 20 GWh (11%) to keep up with the increasing load, while wind generation jumped by 23 GWh.
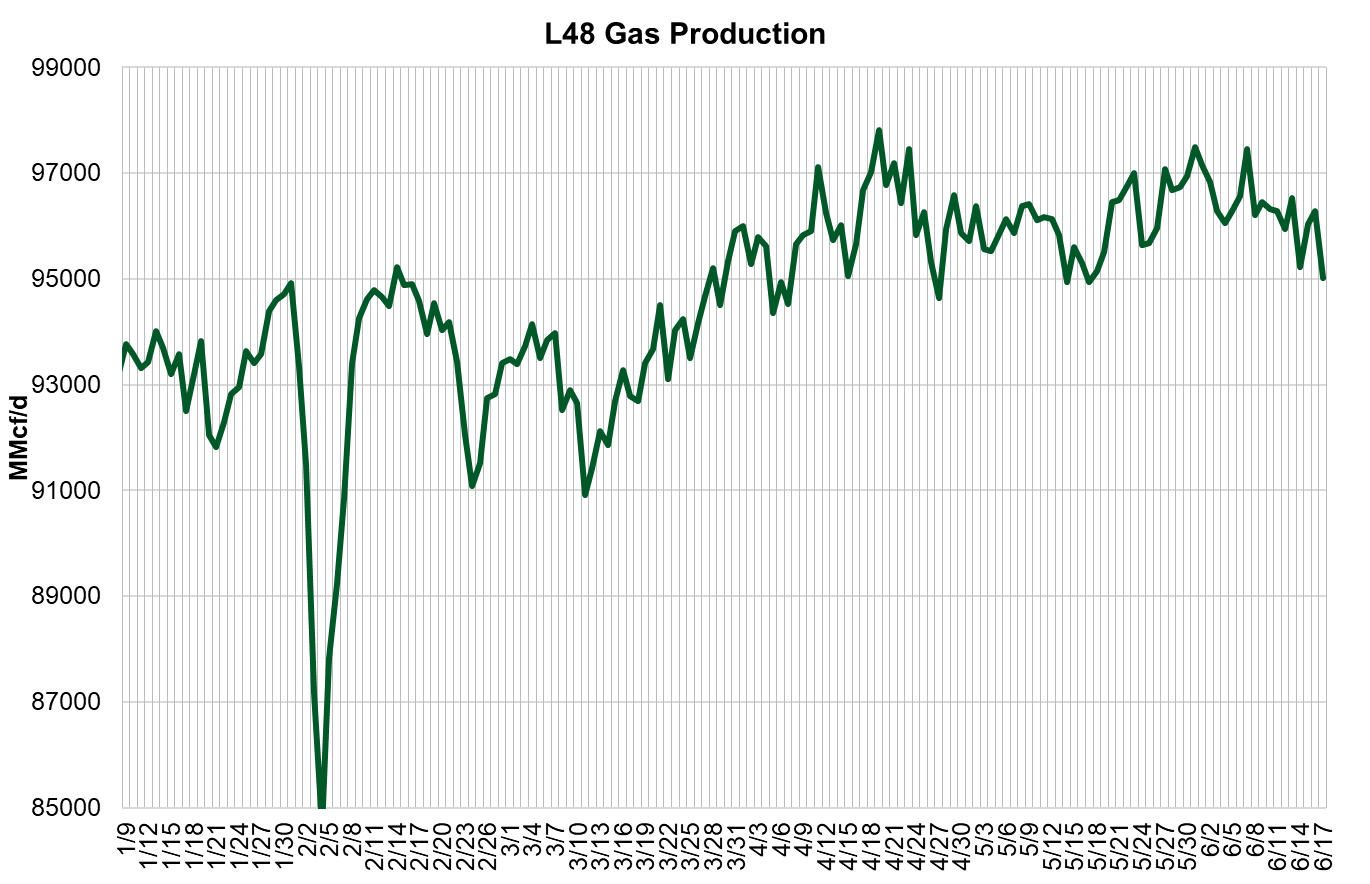
Domestic dry gas production was lower by 0.5 Bcf/d week-on-week. The drop was split between the South Central and the Northeast. We believe the intense heat was a factor in the drop. Compressors along gathering lines are not as efficient with high ambient heat. Up in Western Canada where compressors and other equipment are not protected against heat, we typically see production drop significantly during hot weather episodes. In the South Central, we do not see this as much because the equipment is designed to withstand the temps. [think of this as the opposite of freeze-offs … heat-offs] That being said, this bout of heat lines up well with the production drop.
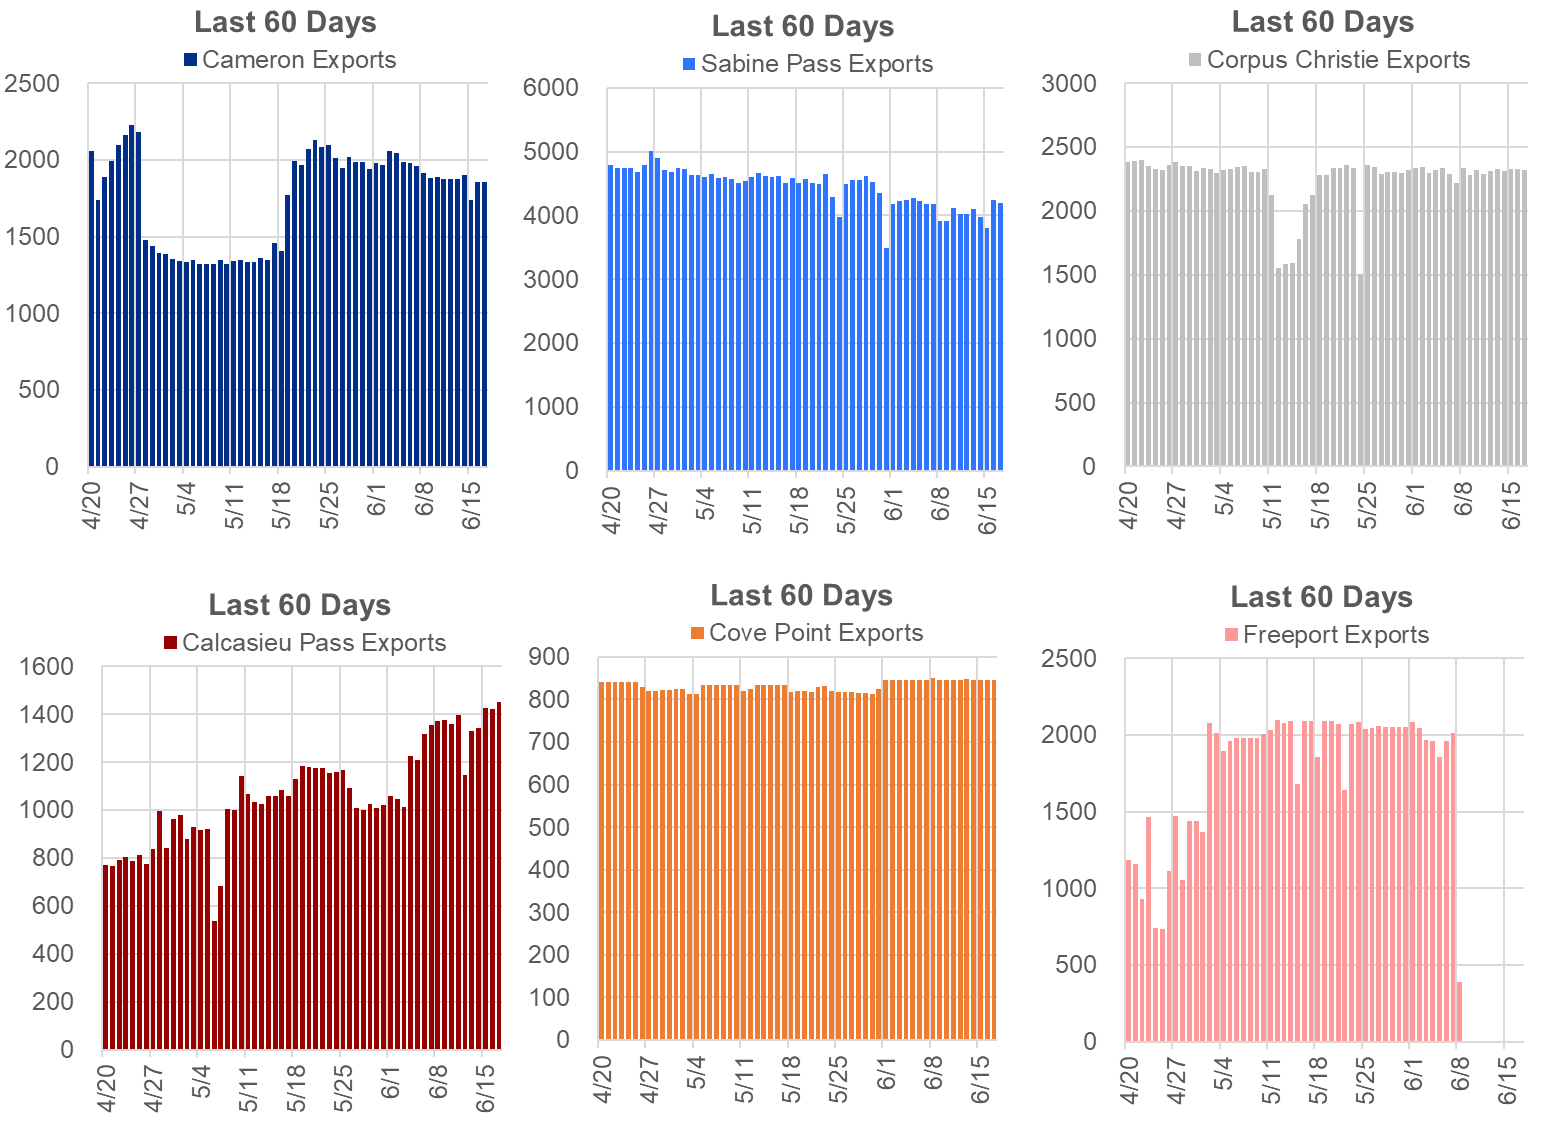
Deliveries to LNG facilities averaged 10.7 Bcf/d last week. Freeport deliveries were 0 all week, and we expect this to continue for some time as stated above. Sabine and Cameron’s operations were also lower midweek, and we believe that was related to the intense heat over Southern Texas as discussed in the above section.
The net balance was -4.9 Bcf/d tighter week-on-week.
Here is the method I used to create the chart above