Happy Long weekend. This week we start by recapping the last monthly EIA SnD data for June 2022. With this data, we now have a complete view of Q2 2022.
Click here to see dashboard: http://www.analytix.ai/natgas-sd-dashboard.html
Here are the few things we picked up on:
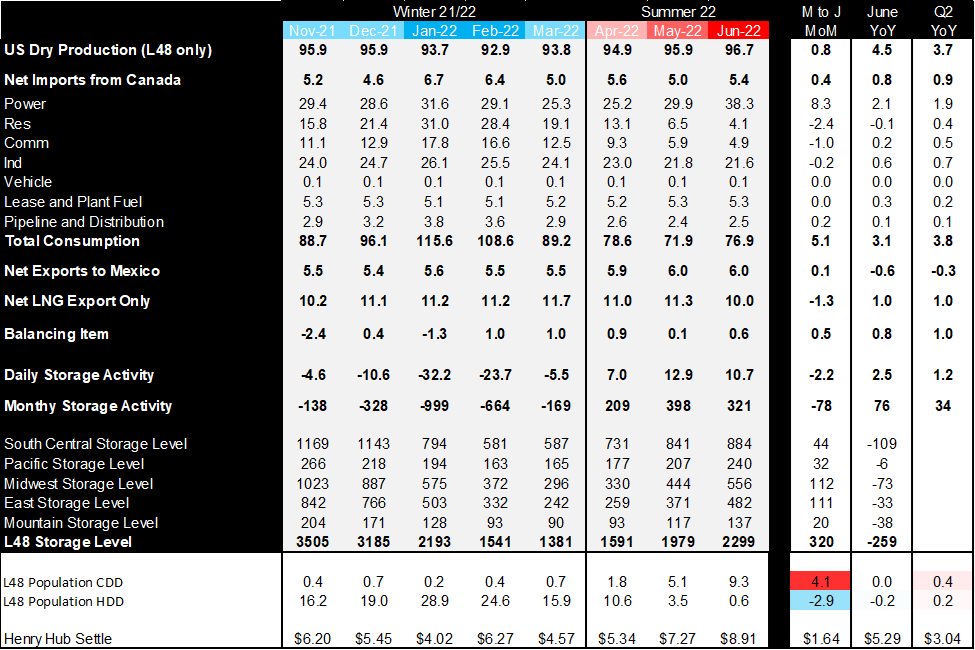
- Total supply was higher by +4.6 Bcf/d Q2-on-Q2 (Prod +3.7 Bcf/d & Canadian Imports +0.9 Bcf/d)
- Total consumption jumped by 3.8 Bcf/d Q2-on-Q2. PB made only half the difference. (More on the power gen stats)
- LNG was higher by 1.0 Bcf/d with the addition of Calcasieu Pass in the last year. Total exports would have been higher if Freeport was available throughout June.
- Lastly the Balancing Item is 1 Bcf/d looser Q2-on-Q2 indicating that either current stats are lower on production or over-estimating demand.
Here are the power gen stats which show overall power demand up 4%. Despite natgas prices being much higher this year, overall coal generation fell. Thankfully #natgas gen did not have to do all the work as wind and solar generation jumped to keep things balanced.
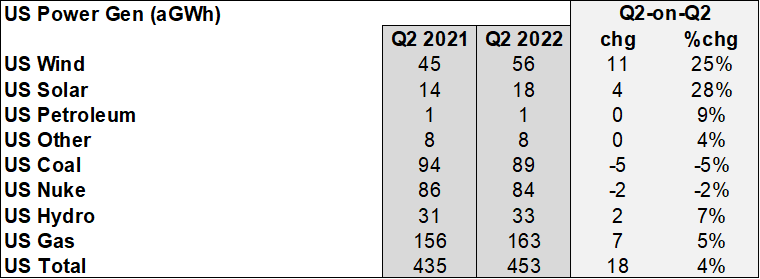
Source: EIA Hourly Generation data, Analytix.ai
NatGas Storage Fundamentals:
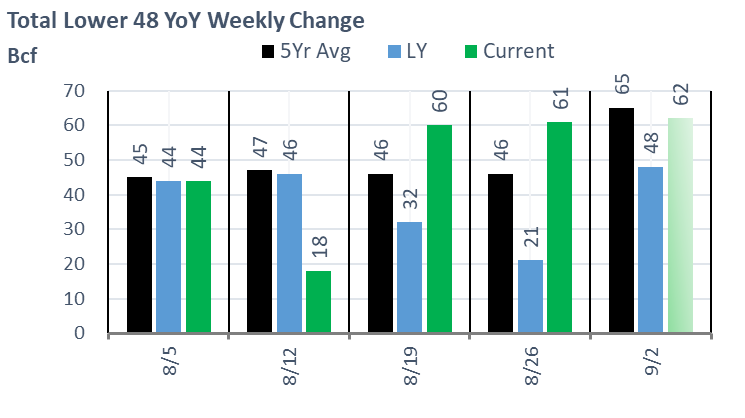
The EIA reported a +61 Bcf injection for the week ending Aug 26th, which fell right between our SnD and flow model. For this past week, our estimate was +60 Bcf.
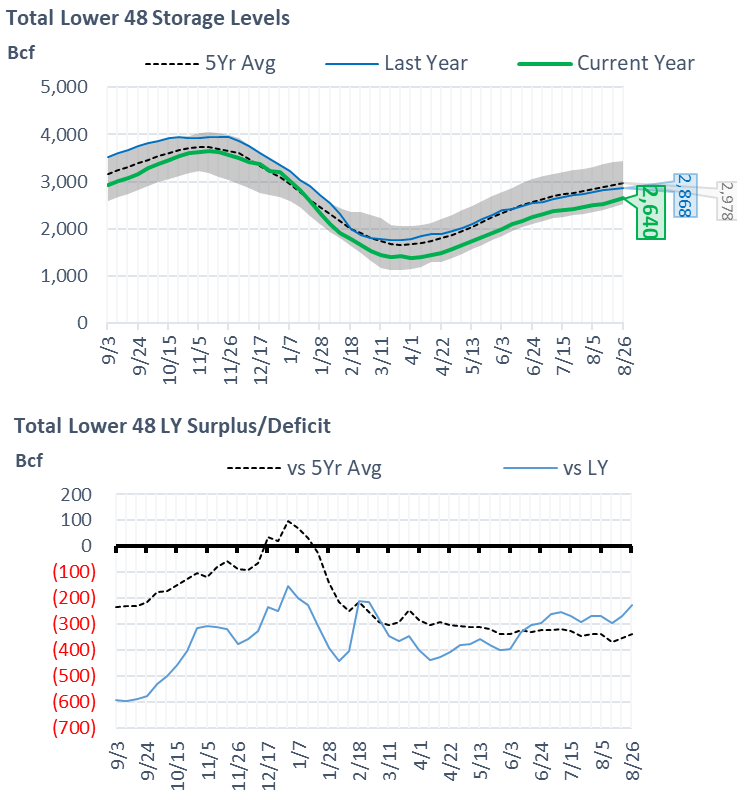
This storage report takes the total level to 2640 Bcf, which is 228 Bcf less than last year at this time and 338 Bcf below the five-year average of 2,978 Bcf.
Although this week’s reported storage build was quite close to the previous week, the fundamental makeup was quite different. Here are the few factors that led to this past week’s storage number:
- Total supply grew by +1.4 Bcf/d (+0.8 production out of the Rockies, Midcon, and West TX/NM, and net higher CAD imports with 0.6 Bcf/d more flowing from AECO to Northern Borders)
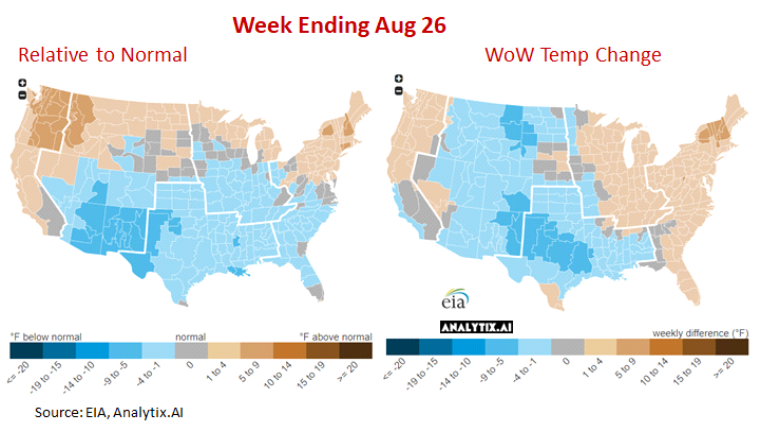
- Power burns jumped by 1.6 Bcf/d to offset the increase in supply with +2.1F more CDDs and extremely low wind led. The increase in CDDs was a result of the Midwest and East coast heating up as seen in the map below.
Here is a look at how the weather looked last week relative normal and the previous week:
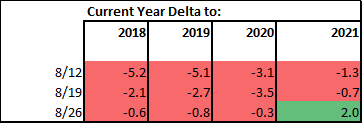
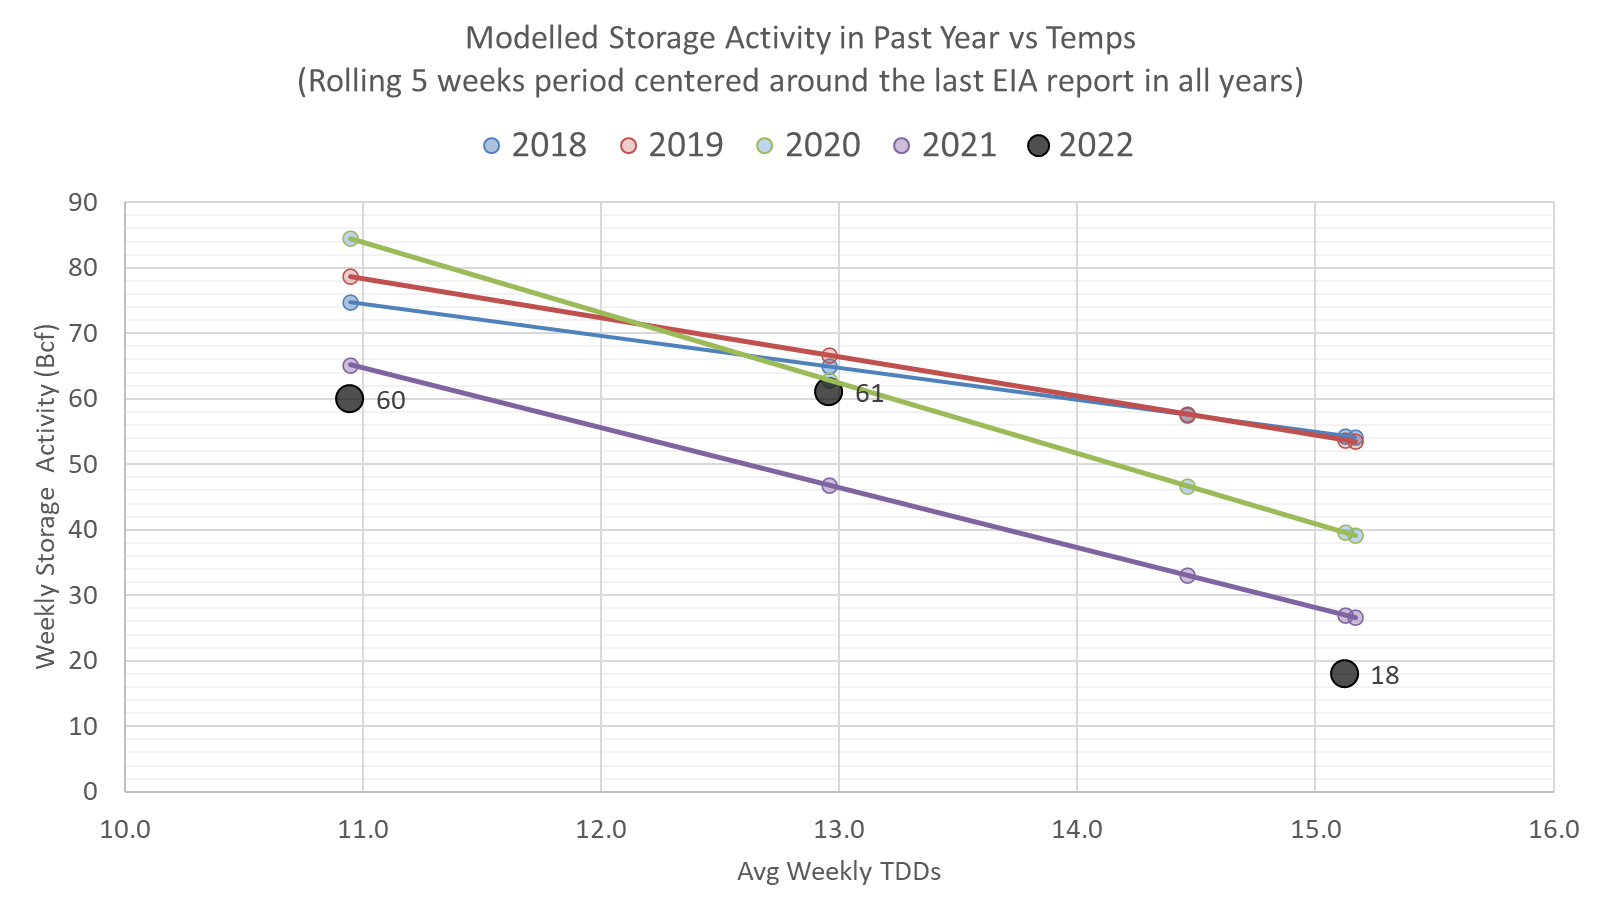
We calculate the +61 Bcf injection being +2.0 Bcf/d loose YoY wx adjusted. [We compare this report to LY’s rolling 5-week regression centered around week #35]
The image below shows the same data in chart format. The lines for 2018-2021 essentially show the resulting injection in those years (during week 33 through 37) if they experienced the same temps as this current summer (historicals + the 15-day forecast).
For this reporting period, the wind generation level once again came in much below expected levels for this time of the year and at this level of installed capacity. The middle two weeks of August are typically the lowest wind weeks and this year we are seeing wind gen levels follow that same pattern closely. For week ending Aug 26th, wind gen produced 23.6 GWh of power while we should have expected 38+ GWh according to our math; hence the low wind generation added approximately 0.9 Bcf/d or 6.3 Bcf/week of power burns.
With this loose storage number, total August storage injections are looking to come in slightly over LY. This August is roughly 1.0 Bcf/d looser YoY (total injection of 185-190 Bcf vs 160 Bcf LY).
For the week ending Sept 2nd, our early view is +62 Bcf. This reporting period will take L48 storage level to 2,702 Bcf (-214 vs LY, -341 vs. 5Yr). This upcoming report once again helps reduce the YoY deficit. Last year we injected +48 Bcf during the same week.
Here is the fundamental picture leading to this week’s storage estimate:
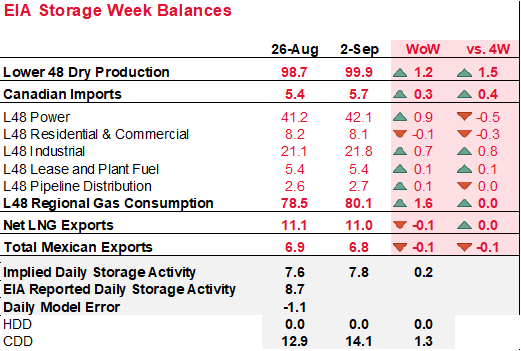
At the high level, we have an increase in production offsetting the increasing demand.
- Total supply grew by +1.5 Bcf/d (+1.2 production out of the Midcon and West TX/NM, and net higher CAD imports with 0.3 Bcf/d less flowing back into Dawn).
- Power burns jumped by 0.9 Bcf/d to offset the increase in supply with +1.3F more CDDs but wind returning to somewhat normal levels. The increase in CDDs was a result of the Midwest and East coast heating up as seen in the map below.
- Industrial consumption was also much higher.
This email, any information contained herein and any files transmitted with it (collectively, the Material) are the sole property of OTC Global Holdings LP and its affiliates (OTCGH); are confidential, may be legally privileged and are intended solely for the use of the individual or entity to whom they are addressed. Unauthorized disclosure, copying or distribution of the Material, is strictly prohibited and the recipient shall not redistribute the Material in any form to a third party. Please notify the sender immediately by email if you have received this email by mistake, delete this email from your system and destroy any hard copies. OTCGH waives no privilege or confidentiality due to any mistaken transmission of this email.