This week, we begin by examining the status of Europe right now. Almost two months earlier than expected, domestic storage volumes have managed to reach the target levels on the European continent despite:
1) A mainland summer that was warmer than usual
2) Unpredictable Russian supply
3) Lower than anticipated US LNG export quantities due to the Freeport outage
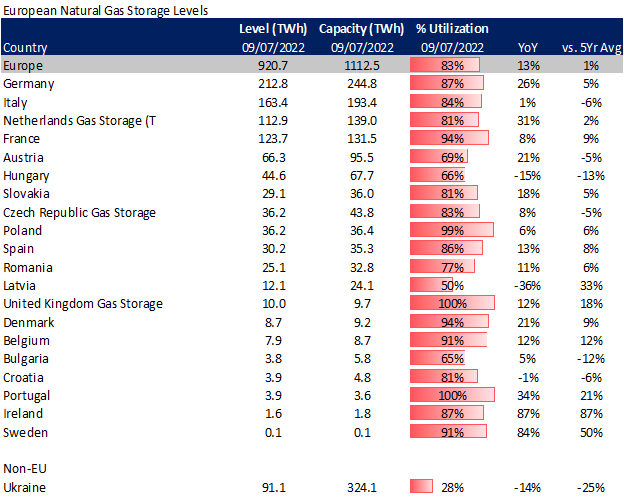
The majority of European nations have succeeded in raising storage levels above those of last year, as seen in the table below.
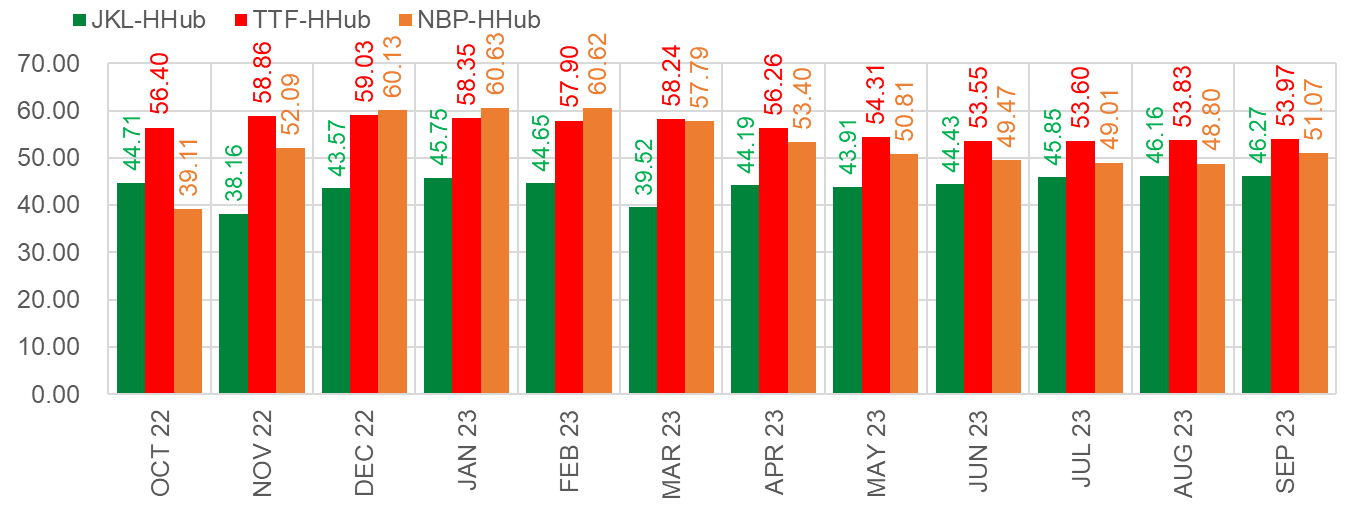
The natural gas prices in Europe hit a record level this summer in order to draw in every last LNG molecule while also discouraging industrial and power burns for cooling loads. Prior to NordStream 1’s extended shutdown in August, the front month TTF contract traded at above $100/MMBtu. It eventually settled at $64.52/Btu on Friday. Through next summer, TTF and NBP are trading at a significant premium, which should position the US for strong LNG terminal utilization.
On Friday at closing, these were the forward worldwide spreads.
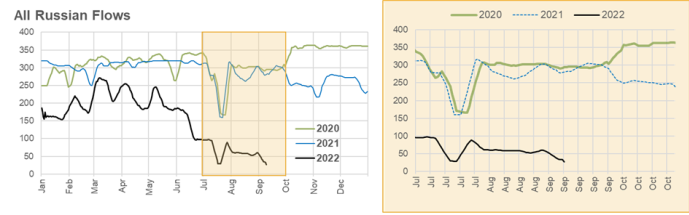
Storage appears to be in good form, but one of the problems Europe is currently experiencing is the lack of assurance surrounding Russian flows over the winter. The lack of reliable supplies could have severe effects on gas balances, even with current healthy storage levels. The Russian flow rate is currently less than 15% of what we would consider normal, and the future is bleak because there is no clear timetable for the restart of Nordstream 1 after Gazprom attributed the lower flow rate to technical maintenance problems.
Europe will probably need to continue operating with lower levels of gas consumption because of supply uncertainties. ICIS published a solid article on this topic last month, and now that NS1 is probably out of the picture, the narrative is even more crucial. Here is one of the main takeaways:
Our modelling shows that if European gas demand were not forced lower – either by market forces or by policy interventions – European storage would totally deplete by the end of March, even if Russian pipe flows remained, albeit at a low level. While stocks will have been able to climb to 80% capacity by 1 November, an aggressive draw-down through the first quarter of 2023 would have knock-on effects for spring and the rest of 2023.
The clear risk this would also pose if Russian gas flows were cut below 115mcm/day would also be significantly detrimental to the market and highlight a ‘do-nothing’ response in terms of demand curtailment as clearly unacceptable.
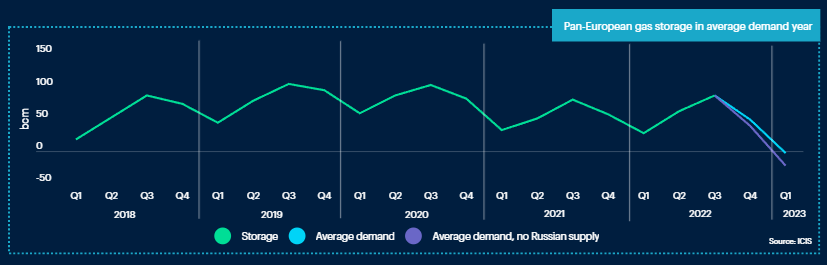
Source: ICIS (See the full report here)
Additionally, Europe is rushing to put new LNG infrastructure online to make up for the declining Russian flows while also restarting coal power units to preserve gas. The first of two floating terminals that will begin operation this year looks to have gone online last week. The first LNG terminal since the invasion of Ukraine will be at the Gasunie’s Eemshaven terminal in the Netherlands. The Exmar S188 and the Golar Igloo are the two floating storage and regasification units (FSRUs) that will make up this new terminal in the port of Eemshaven. Last week, the Golar Igloo arrived. Together, the two units will enable imports of up to 8 Bcm/year, with the Czech Republic, which depends heavily on Russian gas, contracting for a third of this capacity.
One tanker from Sabine has already arrived (Sept 8th), and another is on its way (Sept 19th). There is no red tape in today’s climate, so things are moving quickly!

Overall, with over 25 additional FSRUs anticipated to be installed over the next several years, it appears that the EU will be able to end its reliance on Russian natural gas.
NatGas Storage Fundamentals:
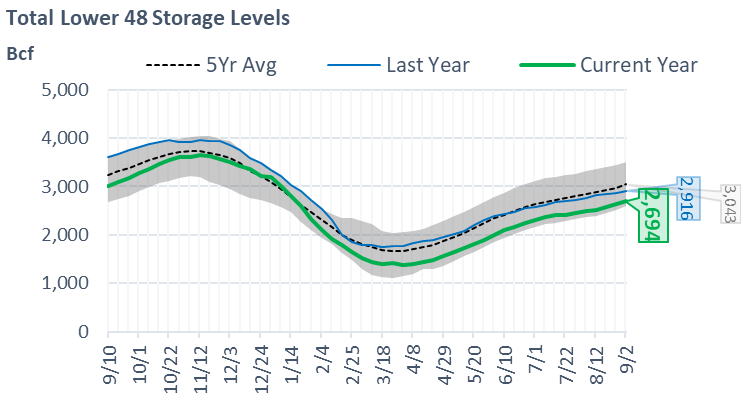
The EIA reported a +54 Bcf injection for the week ending Sept 2nd, which fell below our estimate of +61, but close to the market consensus. This storage report takes the total level to 2694 Bcf, which is 222 Bcf less than last year at this time and 349 Bcf below the five-year average of 3,043 Bcf.
Here are a couple of WoW-related changes that caused the storage injection to be marginally lower than it was the week before:
1) The weather was generally warmer throughout the week, which increased electricity demand by 2.8% and industrial usage.
2) The growth in total supply was +1.2 Bcf/d (+1.1 output from the Midcon and TX, and +0.3 Bcf/d more from WestCan).
3) As wind generation increased from 23.6 aGWh in the week ending August 26 to 36 aGWh in the week ending September 2, power burns decreased dramatically. This means that, if the additional wind pushed out a 7.8HR gas generator, PB would decrease by 2+ Bcf/d.
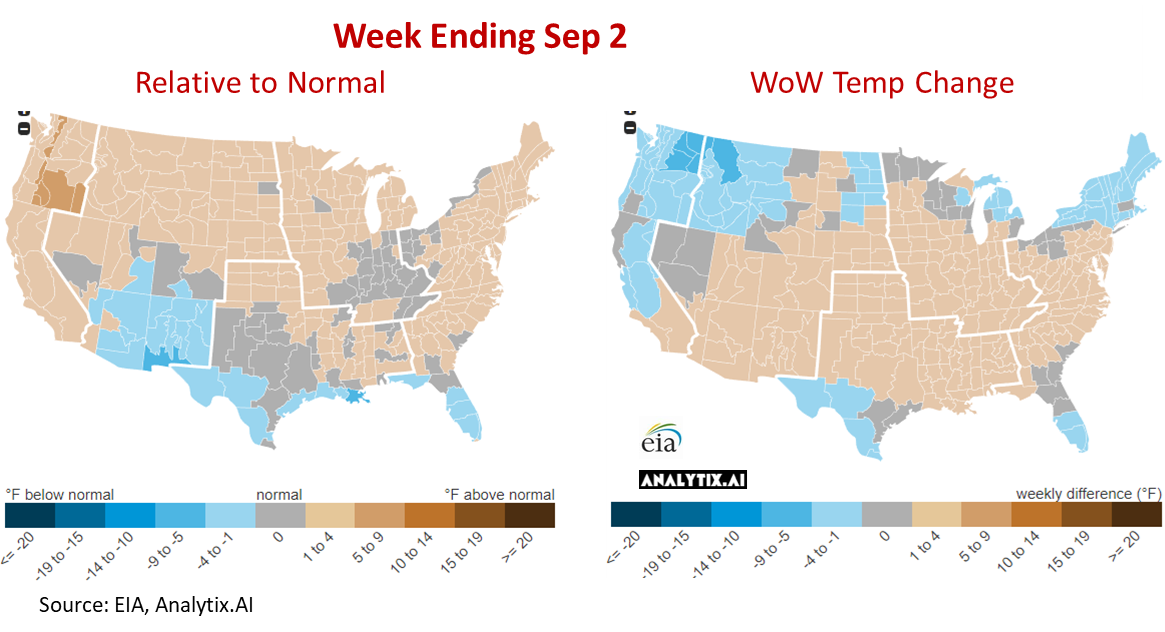
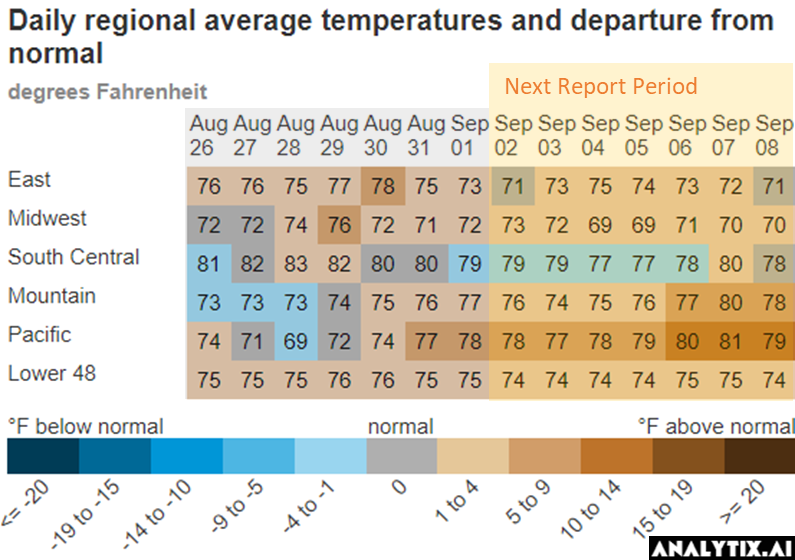
Here is a look at how the weather looked last week relative normal and the previous week:
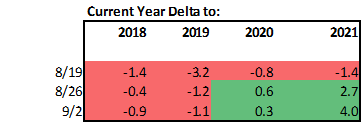
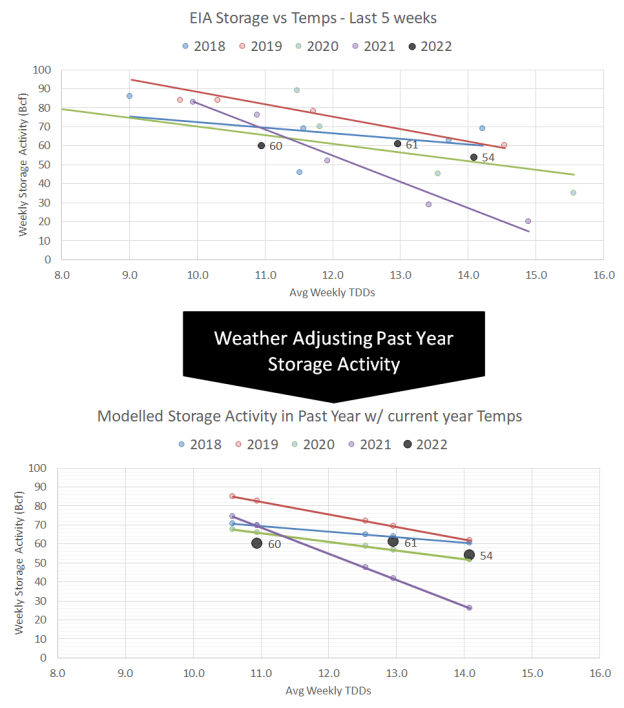
We calculate the +54 Bcf injection being +4.0 Bcf/d loose YoY wx adjusted. [We compare this report to LY’s rolling 5-week regression centered around week #35]
The image below shows the same data in chart format. The lines for 2018-2021 essentially show the resulting injection in those years (during week 34 through 38) if they experienced the same temps as this current summer (historicals + the 15-day forecast).
The level of wind generation for this reporting period increased in comparison to the previous week and ended in line with anticipated levels for this time of year and at this installed capacity level. According to our calculations, wind generation should have produced 38+ aGWh of power and came in close with 36.1 aGWh through the week.
With this storage statistic, it is confirmed that August’s storage injections overall were greater than LY. The total injection is projected to be 190 Bcf as opposed to 160 Bcf LY, putting this August at roughly 1.0 Bcf/d loose YoY.
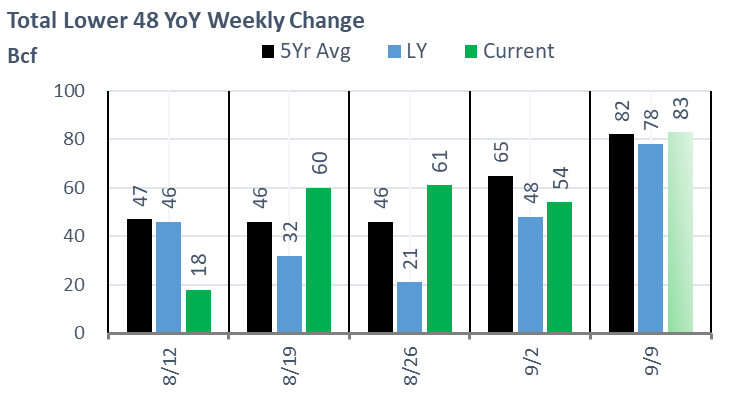
For week ending Sept 9th, our early view is +83 Bcf. This reporting period will take L48 storage level to 2,777 Bcf (-217 vs LY, -348 vs. 5Yr). This upcoming report slightly increases the YoY deficit. Last year we injected +78 Bcf during the same week.
During the past week, we saw weather warm up across much of the country. This kept the L48 population wt. CDDs are higher than normal for most of the country except the deep south.
The amount of wind energy produced decreased week over week, and like most weeks in August, it was significantly lower than what was anticipated at this point in the year and with the installed capacity. According to our calculations, we should have expected 38–39 GWh of electricity from wind generation for the week ending September 9th; as a result, the low wind output added roughly 1.9 Bcf/d or 13 Bcf/week of power burns.
Here is the full fundamental picture compared to last week and the same week last year:
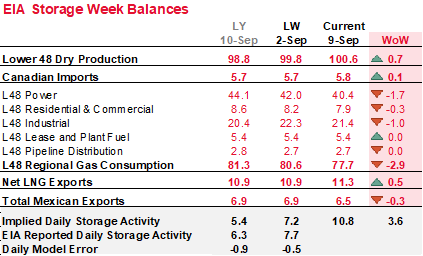
We have solid injection week over week, with record-breaking production levels more than offsetting the rising demand.
1) The Northeast led a +0.7 Bcf/d increase in overall supply. (Other regions showed little variation, while CAD imports generally remained flat.) According to a tweet from Synmax on Friday, frac crews in the Northeast region increased in late August, so as winter approaches, we should keep an eye out for rising production from the area.
2) National power consumption decreased by 5%, and power burns decreased by 1.7 Bcf/d, with overall CDDs down at the national level. If the wind had persisted during the week, we could have seen even lower power burns.
3) LNG feedgas increased as Sabine and other terminals as the pace of Southern subsided. We anticipate the feedgas levels to continue to rise into winter with summer temps now behind us.
This email, any information contained herein and any files transmitted with it (collectively, the Material) are the sole property of OTC Global Holdings LP and its affiliates (OTCGH); are confidential, may be legally privileged and are intended solely for the use of the individual or entity to whom they are addressed. Unauthorized disclosure, copying or distribution of the Material, is strictly prohibited and the recipient shall not redistribute the Material in any form to a third party. Please notify the sender immediately by email if you have received this email by mistake, delete this email from your system and destroy any hard copies. OTCGH waives no privilege or confidentiality due to any mistaken transmission of this email.