No PDF this morning (crop year for corn and soybeans rolled)
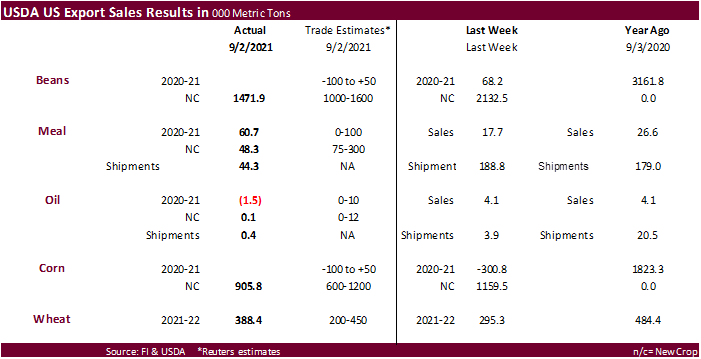
U.S. EXPORT SALES FOR WEEK ENDING 09/02/21
|
|
CURRENT MARKETING YEAR |
NEXT MARKETING YEAR |
||||||
|
COMMODITY |
NET SALES |
OUTSTANDING SALES |
WEEKLY EXPORTS |
ACCUMULATED EXPORTS |
NET SALES |
OUTSTANDING SALES |
||
|
CURRENT YEAR |
YEAR |
CURRENT YEAR |
YEAR |
|||||
|
WHEAT |
THOUSAND METRIC TONS |
|||||||
|
HRW |
227.4 |
1,507.4 |
1,856.1 |
214.0 |
2,118.3 |
3,000.5 |
0.0 |
0.0 |
|
SRW |
34.1 |
760.3 |
517.5 |
12.0 |
885.9 |
568.1 |
0.0 |
0.0 |
|
HRS |
77.7 |
1,049.3 |
1,831.7 |
101.1 |
1,675.8 |
1,973.7 |
0.0 |
0.0 |
|
WHITE |
49.2 |
668.8 |
1,226.0 |
62.9 |
1,095.2 |
1,334.9 |
0.0 |
0.0 |
|
DURUM |
0.0 |
7.4 |
256.8 |
0.0 |
43.2 |
231.6 |
0.0 |
0.0 |
|
TOTAL |
388.4 |
3,993.3 |
5,688.2 |
390.1 |
5,818.4 |
7,108.7 |
0.0 |
0.0 |
|
BARLEY |
-0.1 |
21.3 |
30.8 |
0.0 |
3.9 |
8.4 |
0.0 |
0.0 |
|
CORN |
905.8 |
24,158.2 |
18,601.2 |
167.9 |
167.9 |
245.7 |
0.0 |
331.0 |
|
SORGHUM |
126.4 |
1,944.9 |
2,415.0 |
0.0 |
0.0 |
33.0 |
0.0 |
0.0 |
|
SOYBEANS |
1,471.9 |
21,011.4 |
29,359.7 |
13.8 |
13.8 |
468.7 |
0.0 |
0.0 |
|
SOY MEAL |
60.7 |
1,252.1 |
1,086.2 |
44.3 |
10,888.5 |
11,099.3 |
48.3 |
2,106.4 |
|
SOY OIL |
-1.6 |
18.3 |
121.8 |
0.4 |
670.7 |
1,155.1 |
0.1 |
1.5 |
|
RICE |
|
|
|
|
|
|
|
|
|
L G RGH |
27.5 |
241.9 |
186.9 |
6.9 |
97.5 |
50.8 |
0.0 |
0.0 |
|
M S RGH |
0.0 |
8.1 |
27.4 |
0.5 |
1.0 |
1.5 |
0.0 |
0.0 |
|
L G BRN |
0.2 |
1.1 |
8.3 |
0.5 |
12.0 |
2.7 |
0.0 |
0.0 |
|
M&S BR |
0.0 |
22.3 |
19.1 |
0.0 |
13.7 |
13.9 |
0.0 |
0.0 |
|
L G MLD |
4.0 |
167.1 |
68.5 |
5.5 |
77.0 |
20.2 |
0.0 |
0.0 |
|
M S MLD |
2.2 |
42.0 |
42.6 |
15.5 |
44.8 |
52.8 |
0.0 |
0.0 |
|
TOTAL |
34.0 |
482.6 |
352.9 |
28.9 |
246.0 |
141.7 |
0.0 |
0.0 |
|
COTTON |
|
THOUSAND RUNNING BALES |
|
|||||
|
UPLAND |
453.0 |
5,084.8 |
5,627.9 |
155.3 |
937.3 |
1,482.1 |
19.5 |
686.8 |
|
PIMA |
12.1 |
129.1 |
195.5 |
12.0 |
36.0 |
47.1 |
0.0 |
0.0 |
|
FINAL 2020/21 MARKETING YEAR |
||||
|
COMMODITY |
NET SALES |
CARRYOVER SALES 1/ |
08/31/2021 EXPORTS |
ACCUMULATED EXPORTS |
|
CORN |
-87.4 |
2,978.1 |
256.0 |
66,957.9 |
|
SORGHUM |
0.0 |
223.6 |
2.5 |
6,913.4 |
|
SOYBEANS |
148.2 |
1,805.8 |
283.1 |
60,570.5 |
|
|
|
|
|
|
This summary is based on reports from exporters for the period August 27-September 2, 2021.
Wheat: Net sales of 388,400 metric tons (MT) for 2021/2022 were up 32 percent from the previous week and 54 percent from the prior 4-week average. Increases primarily for Mexico (128,100 MT, including decreases of 12,500 MT), the Philippines (63,000 MT), Japan (54,800 MT), Thailand (50,000 MT), and Venezuela (30,100 MT, including 29,300 MT switched from unknown destinations), were offset by reductions primarily for unknown destinations (20,800 MT). Exports of 390,100 MT were down 7 percent from the previous week and 33 percent from the prior 4-week average. The destinations were primarily to Mexico (106,600 MT), the Philippines (63,000 MT), Taiwan (57,200 MT), Guatemala (33,500 MT), and South Korea (33,300 MT).
Corn: Net sales for the 2021/2022 marketing year, which began September 1, totaled 905,800 MT. Increases were primarily for Mexico (334,100 MT, including decreases of 1,800 MT), unknown destinations (234,900 MT), Canada (176,200 MT, including decreases of 2,500 MT), Colombia (63,500 MT), and Japan (60,300 MT, including decreases of 10,200 MT), were offset by reductions for Costa Rica (1,000 MT). A total of 2,978,100 MT in sales were carried over from the 2020/2021 marketing year, which ended August 31. Exports for the period ending August 31 of 256,000 MT brought accumulated exports to 66,957,900 MT, up 55 percent from the prior year’s total of 43,273,800 MT. The primary destinations were to Mexico (117,000 MT), Japan (90,200 MT), Venezuela (19,100 MT), Canada (17,100 MT), and Guyana (8,000 MT). Exports for September 1-2 totaled 167,900 MT, with Mexico (140,100 MT), Canada (27,500 MT), and Hong Kong (200 MT) being the primary destinations.
Optional Origin Sales: For 2021/2022, options were exercised to export 30,500 MT to unknown destinations from other than the United States. The current outstanding balance of 110,000 MT is for unknown destinations.
Barley: Total net sales reductions for 2021/2022 of 100 MT were for Canada. No exports were reported for the week.
Sorghum: Net sales for the 2021/2022 marketing year, which began September 1, totaled 126,400 MT. Increases were reported for China (68,600 MT), unknown destinations (55,000 MT), and Mexico (2,800 MT). A total of 223,600 MT in sales were carried over from the 2020/2021 marketing year, which ended August 31. Exports for the period ending August 31 of 2,500 MT brought accumulated exports to 6,913,400 MT, up 53 percent from the prior year’s total of 4,529,300 MT. The destination was Mexico. There were no exports for September 1-2.
Rice: Net sales of 34,000 MT for 2021/2022 were primarily for Costa Rica (22,000 MT), Honduras (5,500 MT), Saudi Arabia (2,800 MT), Canada (2,200 MT), and Hong Kong (900 MT). Exports of 28,900 MT were primarily to Japan (12,000 MT), Mexico (7,700 MT), Saudi Arabia (3,900 MT), Canada (2,400 MT), and the Dominican Republic (1,900 MT).
Soybeans: Net sales for the 2021/2022 marketing year, which began September 1, totaled 1,471,900 MT. Increases were primarily for China (764,000 MT), unknown destinations (453,600 MT), Mexico (79,100 MT, including decreases of 400 MT), Turkey (55,000 MT), and Egypt (55,000 MT). A total of 1,805,800 MT in sales were carried over from the 2020/2021 marketing year, which ended August 31. Exports for the period ending August 31 of 283,100 MT brought accumulated exports to 60,570,500 MT, up 35 percent from the prior year’s total of 44,934,500 MT. The primary destinations were Germany (152,200 MT), Japan (58,100 MT), Mexico (42,700 MT), Indonesia (9,200 MT), and Taiwan (8,100 MT). Exports for September 1-2 totaled 13,800 MT, with Mexico (10,500 MT), Malaysia (2,200 MT), the Philippines (600 MT), Japan (300 MT), and Indonesia (200 MT) being the destinations.
Export for Own Account: For 2021/2022, new exports for own account totaling 5,800 MT were carried over from the 2020/2021 marketing year, which ended August 31. The current exports for own account outstanding balance is 5,800 MT, all Canada.
Export Adjustments: Accumulated export of soybeans to the Netherlands were adjusted down 65,966 MT for week ending August 19th, and 86,200 MT for week ending August 26th. The correct destination for these shipments is Germany.
Soybean Cake and Meal: Net sales of 60,700 MT for 2020/2021 were up noticeably from the previous week, but down 9 percent from the prior 4-week average. Increases primarily for Mexico (24,100 MT, including decreases of 200 MT), Malaysia (8,500 MT), Canada (6,100 MT, including decreases of 200 MT), Taiwan (5,800 MT), and the Philippines (5,200 MT), were offset by reductions primarily for unknown destinations (8,300 MT). For 2021/2022, net sales of 48,300 MT primarily for Japan (20,500 MT), the Dominican Republic (15,000 MT), Canada (9,100 MT), Colombia (8,600 MT), and Jamaica (8,000 MT), were offset by reductions primarily for unknown destinations (19,000 MT). Exports of 44,300 MT were down 77 percent from the previous week and 80 percent from the prior 4-week average. The destinations were primarily to Canada (16,700 MT), Mexico (13,100 MT), Guyana (4,200 MT), Venezuela (3,100 MT), and Burma (2,400 MT).
Soybean Oil: Total net sales reductions for 2020/2021 of 1,600 MT, down noticeably from the previous week and from the prior 4-week average, were for Canada (including decreases of 1,800 MT). Total net sales for 2021/2022 of 100 MT were for Canada. Exports of 400 MT were down 91 percent from the previous week and 73 percent from the prior 4-week average. The destination was primarily to Canada (300 MT).
Cotton: Net sales of 453,000 RB for 2021/2022 primarily for China (261,500 RB, including decreases of 100 RB), Pakistan (36,500 RB), Indonesia (30,500 RB, including decreases of 100 RB), Guatemala (28,400 RB), and Turkey (25,400 RB, including decreases of 300 RB), were offset by reductions for Japan (1,100 RB) and Bangladesh (200 RB). Total net sales for 2022/2023 of 19,500 RB were for Guatemala. Exports of 155,300 RB were primarily to Vietnam (48,600 RB), China (29,100 RB), Pakistan (16,600 RB), Mexico (16,000 RB), and Turkey (14,300 RB). Net sales of Pima totaling 12,100 RB were primarily for India (5,500 RB, including decreases of 100 RB), Austria (2,600 RB), Honduras (2,200 RB), Pakistan (900 RB) and South Korea (700 RB). Exports of 12,000 RB were primarily to India (7,700 RB), Pakistan (2,200 RB), China (1,000 RB), Peru (400 RB), and Thailand (400 RB).
Optional Origin Sales: For 2021/2022, the current outstanding balance of 8,800 RB is for Pakistan.
Exports for Own Account: For 2021/2022, the current exports for own account outstanding balance of 4,800 RB is for China (4,700 RB) and Vietnam (100 RB).
Hides and Skins: Net sales of 398,900 pieces for 2021 were up 23 percent from the previous week and 49 percent from the prior 4-week average. Increases primarily for China (285,600 whole cattle hides, including decreases of 28,400 pieces), South Korea (38,400 whole cattle hides, including decreases of 1,200 pieces), Thailand (24,000 whole cattle hides, including decreases of 1,100 pieces), Mexico (19,300 whole cattle hides, including decreases of 600 pieces), and Italy (16,200 whole cattle hides), were offset by reductions for Ethiopia (100 pieces). Exports of 350,000 pieces were down 18 percent from the previous week and 20 percent from the prior 4-week average. Whole cattle hides exports were primarily to China (226,400 pieces), South Korea (43,100 pieces), Mexico (30,600 pieces), Thailand (15,800 pieces), and Taiwan (14,500 pieces).
Net sales of 2,100 wet blues for 2021 were down 99 percent from the previous week and from the prior 4-week average. Increases primarily for Brazil (6,000 unsplit), India (2,000 unsplit), Thailand (1,400 unsplit, including decreases of 400 unsplit), and Mexico (900 unsplit), were offset by reductions primarily for Italy (8,200 pieces). Total net sales for 2022 of 8,000 wet blues were for Italy. Exports of 64,500 wet blues were down 49 percent from the previous week and 60 percent from the prior 4-week average. The destinations were to Italy (23,300 unsplit), Vietnam (16,200 unsplit), Thailand (9,100 unsplit), China (6,600 unsplit), and Mexico (1,900 unsplit and 2,100 grain splits). Total net sales reductions of 2,100 splits were for China. Exports of 160,000 pounds were to Vietnam.
Beef: Net sales of 12,400 MT reported for 2021 were down 20 percent from the previous week and 2 percent from the prior 4-week average. Increases were primarily for Japan (4,600 MT, including decreases of 500 MT), China (2,700 MT, including decreases of 100 MT), South Korea (900 MT, including decreases 500 MT), Canada (800 MT), and Taiwan (700 MT, including 100 MT switched from the Philippines and decreases of 100 MT). Total net sales for 2022 of 400 MT were for South Korea. Exports of 18,800 MT were up 4 percent from the previous week, but unchanged from the prior 4-week average. The destinations were primarily to Japan (4,900 MT), South Korea (4,700 MT), China (4,000 MT), Taiwan (1,100 MT), and Mexico (1,000 MT).
Pork: Net sales of 33,800 MT reported for 2021 were up 1 percent from the previous week and 47 percent from the prior 4-week average. Increases were primarily for China (15,000 MT, including decreases of 200 MT), Mexico (8,200 MT, including decreases of 700 MT), South Korea (3,600 MT, including decreases of 200 MT), Colombia (3,100 MT, including decreases of 100 MT), and Japan (1,600 MT, including decreases of 300 MT). Exports of 29,100 MT were up 3 percent from the previous week and 2 percent from the prior 4-week average. The destinations were primarily to Mexico (13,800 MT), China (5,000 MT), Japan (3,700 MT), South Korea (1,400 MT), and Canada (1,400 MT).
September 10, 2021 1 FOREIGN AGRICULTURAL SERVICE/USDA
SUMMARY OF EXPORT TRANSACTIONS
Reported Under the Daily Reporting System
For Period Ending September 2, 2021
Commodity Destination Quantity (MT) Marketing
SOYBEANS CHINA 512,000 MT 1/ 2021/2022
1/ Export sales.
Terry Reilly
Senior Commodity Analyst – Grain and Oilseeds
Futures International
One Lincoln Center
18 W 140 Butterfield Rd.
Oakbrook Terrace, Il. 60181
W: 312.604.1366
ICE IM: treilly1
Skype: fi.treilly

Trading of futures, options, swaps and other derivatives is risky and is not suitable for all persons. All of these investment products are leveraged, and you can lose more than your initial deposit. Each investment product is offered only to and from jurisdictions where solicitation and sale are lawful, and in accordance with applicable laws and regulations in such jurisdiction. The information provided here should not be relied upon as a substitute for independent research before making your investment decisions. Futures International, LLC is merely providing this information for your general information and the information does not take into account any particular individual’s investment objectives, financial situation, or needs. All investors should obtain advice based on their unique situation before making any investment decision. The contents of this communication and any attachments are for informational purposes only and under no circumstances should they be construed as an offer to buy or sell, or a solicitation to buy or sell any future, option, swap or other derivative. The sources for the information and any opinions in this communication are believed to be reliable, but Futures International, LLC does not warrant or guarantee the accuracy of such information or opinions. Futures International, LLC and its principals and employees may take positions different from any positions described in this communication. Past results are not necessarily indicative of future results.