This week was probably one of the most interesting of the winter season. We saw massive swings in price as weather runs flipped from the previous week’s mild February outlook.
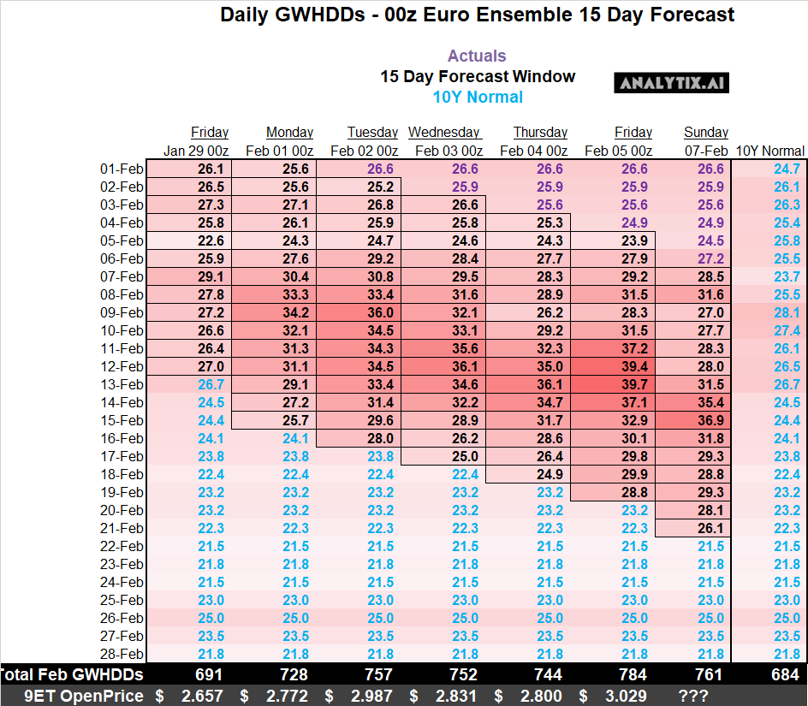
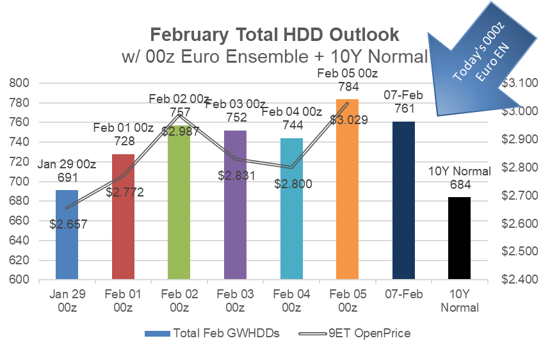
I wanted to start with this table so you did not miss it, as it includes today’s 00z Euro Ensemble run as well. Today’s run shows reduced intensity from Friday run, but the cooler weather does continue into the last third of February.
So let’s go through the week using the same data seen in the table above. The market opened higher on Sunday as traders digested the massive cooler conditions across the Midwest and Northeast. Adding to the cold was a blanket of snow that has not been seen this season – up to 36” in some locations in Pennsylvania.
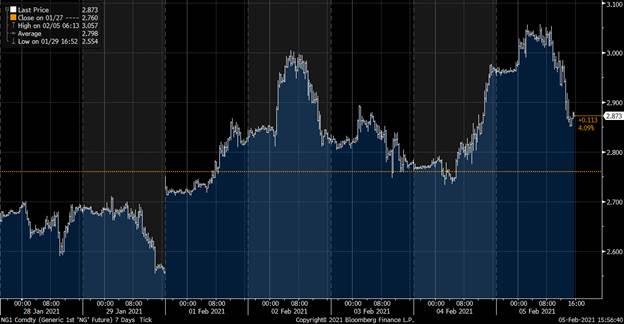
On January 29th, the March contract closed at 2.55 and by open on Sunday the market was trading at 2.72. A massive change in weather sentiment pushed the market higher on open.
Every weather run throughout the week swung prices.
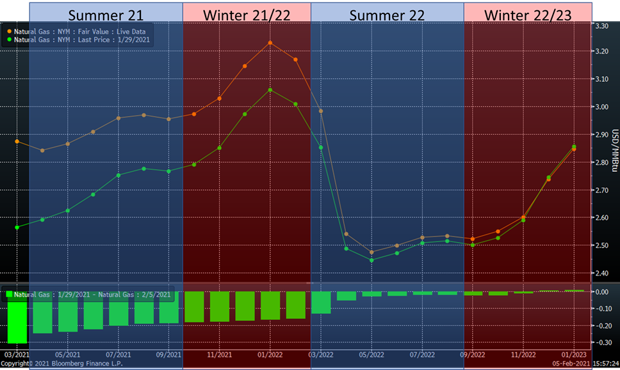
Overall, this cold shot sent prices soaring through the term structure. Here are the week on week price changes:
|
March +0.32 Summer 21 +0.22 Winter 21/22 +0.16 Summer 22 +0.02 |
|
|
|
|
|
|
|
|
|
|
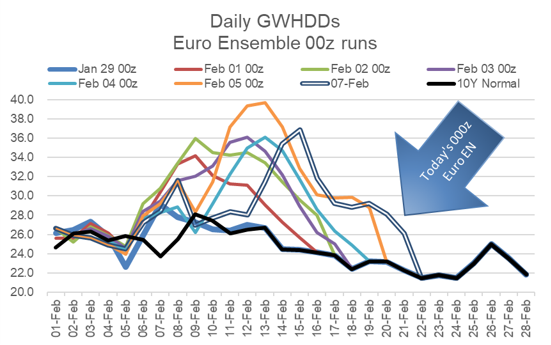
Now let’s look at the big weather changes observed this week, ie going back to the data from the table in the beginning. Last weekend the weather models introduced a massive cold front that extended down over the Midwest and Northeast bringing extreme cold weather and snow over the 15-day forecast window. Throughout the week, the cold weather pattern continuously changed. It got pushed out throughout the week and then intensified on Friday morning. This can be seen in the heat chart and the line chart below. Ultimately, the 12z run on Friday turned warmer and moved the market net lower on Friday. Today’s run once again pushed the cooler temps out and immensely reduced the intensity that was expected towards the end of this week.
Bradly Harvey from Maxar put this best on enelyst – “This has been one of the more challenging weeks of forecasting in some time, and the details of the forecast remain of lower than usual confidence. The lower confidence is attributed to larger than usual spreads among members of the ensemble models, which has been the case all week. It would not surprise to see models remaining volatile in upcoming runs as a result.”
On Jan 29th, the expectation for February was right at the 10Y normal level – 691 GWHDDs vs 684 GWHDD 10Y Normal – but that shifted cooler throughout last week. With each overnight run, we saw a price reaction.
The chart below shows the daily 00z Euro Ensemble runs + 10Y normal for Feb. You can see how the HDD outlook for Feb changes throughout the week.
The chart below shows the cumulative Feb projected GWDD vs. the price on market open each day.
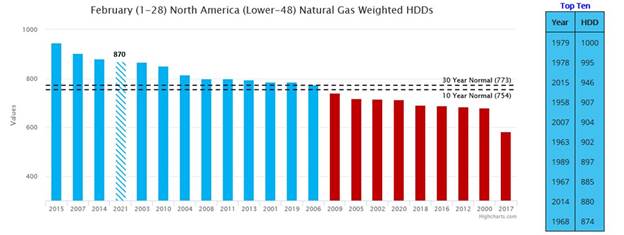
From CWG on Thursday afternoon. This Feb is shaping up to be up there with 2014 & 2015.
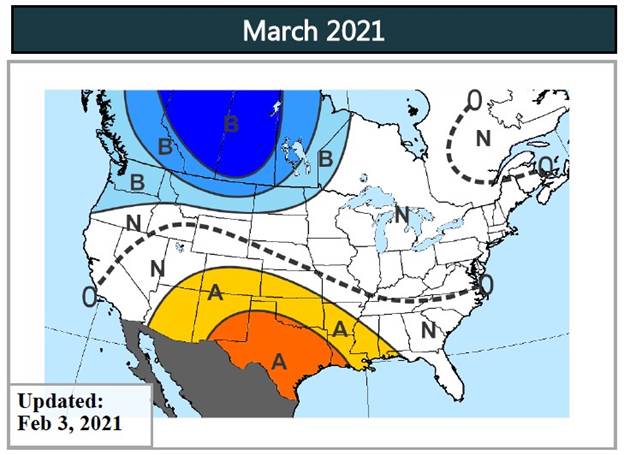
Let’s end with the March outlook from Maxar Weather. Some cold up in Western Canada, but the rest of the US looks seasonal to warm.
![]()
Fundamentals for the week ending Feb 05: Our early view for the upcoming storage report is a -177 Bcf withdrawal for the lower 48. This would take storage levels to 2512 Bcf (-15 YoY, +146 vs 5Yr). This past week it appears that we will finally dip below last year’s levels. The industry estimates for this report range between -192 to -165 according to The Desk.
For this past week, supply has continues to remain flat. We observed production in the Northeast drop once again with cooler temps and snow potentially impacting Marcellus and Utica field production. This lower levels in the Northeast were offset by an increase in from the Midcontinent. Dry gas production during January averaged 91.8 Bcf/d.
Temps were marginally warmer week-on-week. We recorded L48 GWHDD dropping by an average of 0.8 to 27.2. Overall, total gas consumption decreased by an average of 2.6 Bcf/d. Power was essentially flat, but RC and Industrial were both lower by 1.3 Bcf/d each. Deliveries to LNG facilities averaged 10.7 Bcf/d, up 0.7 Bcf/d WoW. LNG feedgas flows were higher at both Sabine and Cameron this week. Last week, Sabine which was facing issues with tanker arrival due to thick fog and maintenance on an incoming pipeline compressor stations.
Net the balance were looser by 2.0 Bcf/d week-on-week.
Expiration and rolls: UNG ETF roll starts on Feb 10th and ends on Feb 16th.
Mar futures expire on Feb 24th, and Feb options expire on Feb 23th.
This email, any information contained herein and any files transmitted with it (collectively, the Material) are the sole property of OTC Global Holdings LP and its affiliates (OTCGH); are confidential, may be legally privileged and are intended solely for the use of the individual or entity to whom they are addressed. Unauthorized disclosure, copying or distribution of the Material, is strictly prohibited and the recipient shall not redistribute the Material in any form to a third party. Please notify the sender immediately by email if you have received this email by mistake, delete this email from your system and destroy any hard copies. OTCGH waives no privilege or confidentiality due to any mistaken transmission of this email.