This week, we review some key takeaways from the Q1 2022 Dallas Fed Energy Survey. The Dallas Fed conducts quarterly surveys with executives in manufacturing, services, energy, and lending across Texas and the broader Eleventh Federal Reserve District. The latest report was released on March 23rd.
Here is a link to the full report: https://www.dallasfed.org/research/surveys/des/2022/2201.aspx
According to energy executives, oil and gas sector activity jumped considerably in Q1 along with costs. Oil production increased at a faster pace, according to executives at exploration and production (E&P) firms. The oil production index rose sharply from 19.1 in the fourth quarter to 45.0 in the first quarter. Similarly, the natural gas production index advanced 14.0 points to 40.0.
Costs across the board increased. The survey included finding and development costs, lease operating expenses, and labor were all higher. One comment summarized this well:
“A significant part of E&P capital spending growth this year (2022 versus 2021) will be consumed by cost inflation as the cost for all inputs continues to increase against a backdrop of supply-chain challenges and limited incremental equipment being reactivated (due to fiscal constraints and manpower challenges within oilfield services and related suppliers).”
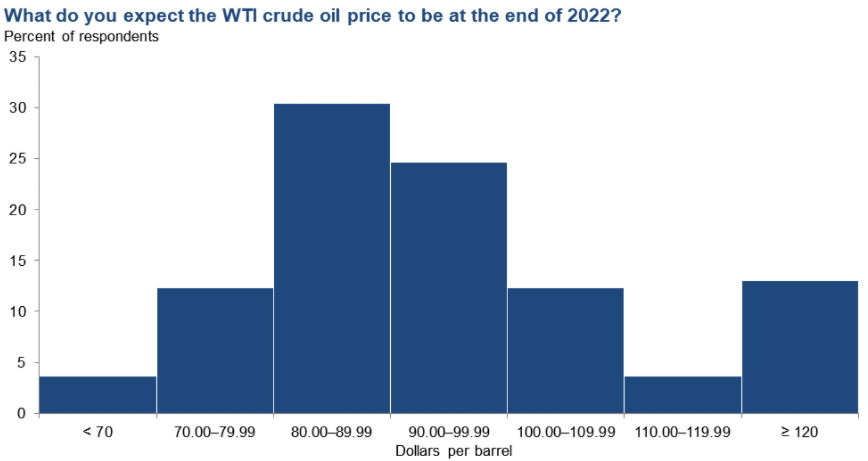
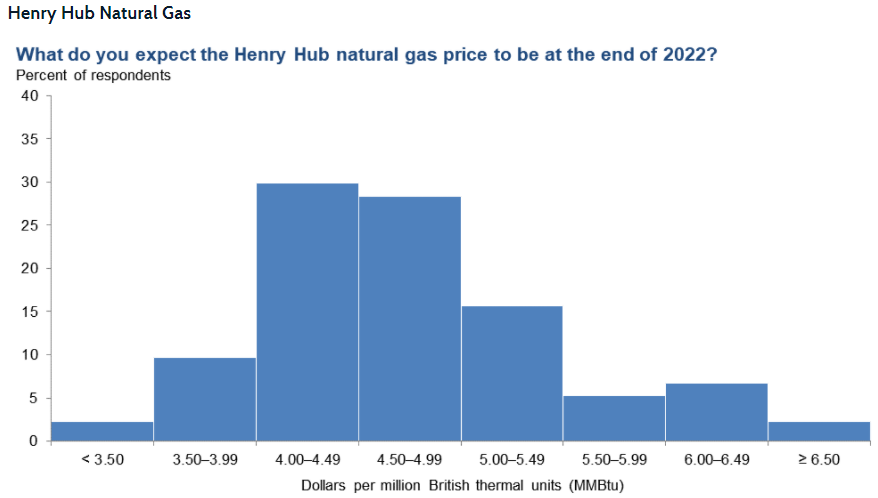
Executives from 130+ oil and gas firms gave their expectations on price levels at the end of 2022. On average, they expect WTI oil prices to be $93/bbl by year-end 2022 and Henry Hub to be $4.57/MMBtu by year-end 2022. For reference, last quarter the expectation was for $74.69 and $4.06.
Another few interesting questions asked to executives around current and new wells were the following:
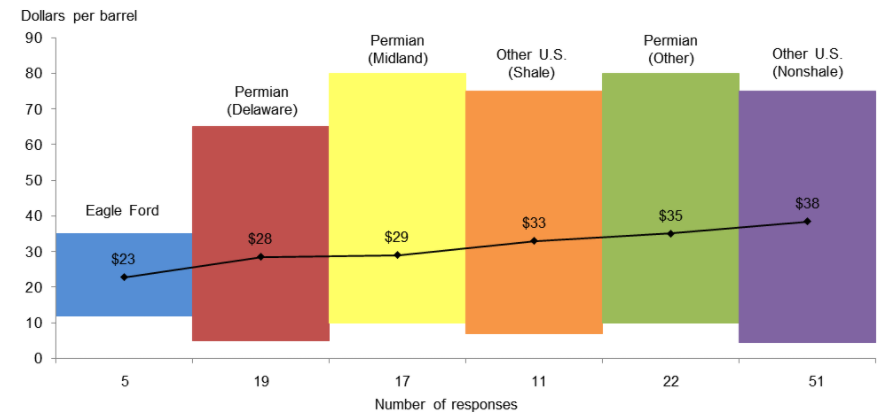
In the top two areas in which your firm is active: What West Texas Intermediate (WTI) oil price does your firm need to cover operating expenses for existing wells?
Simply put: What’s your oil break-even price for existing wells.
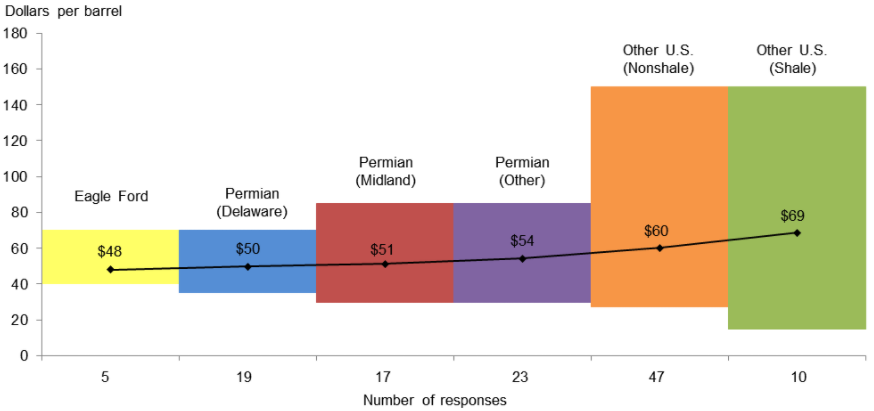
In the top two areas in which your firm is active: What WTI oil price does your firm need to profitably drill a new well?
Simply put: What’s your oil break-even price for new wells.
Based on these break-evens and where the current price strip is, we would expect boundless drilling activity. This would lead to a considerable pick up this year, but there are major constraints in the industry stalling this rise.
The major issues highlighted were:
1) “supply issues for the materials needed to grow production” – “the delivery and cost of pipe, frac sand, cement, etc., are all concerns for our business.”
2) “workforce issues because a meaningful portion of the labor force left the industry during the downturn”
3) “Traditional lending and capital markets access for exploration and production companies are down across”
4) ” Private-equity capital for oil and gas is down 70 to 80 percent over the last several years”
5) “The U.S. needs to fast track infrastructure, such as the Keystone pipeline, Mountain Valley pipeline, Constitution pipeline and liquefied natural gas export facilities and eliminate the Jones Act”
6) “investor pressure, ESG issues, government regulation and lack of growth capital”
7) Capital “Discipline continues to dominate the industry. Shareholders and lenders continue to demand a return on capital”
Fundamentals for the week ending Apr 01:
The EIA reported a +26 Bcf injection for the week ending Mar 25th, which came in right at market estimates. Storage levels were reported to be 1415 Bcf.
For the reported week, total consumption dropped as both coasts and the Midwest experienced temps above normal. The net result was L48 GWHDD dropping by -6.1F relative to the previous week; resulting in an 11.8 Bcf/d drop in natural gas consumption. 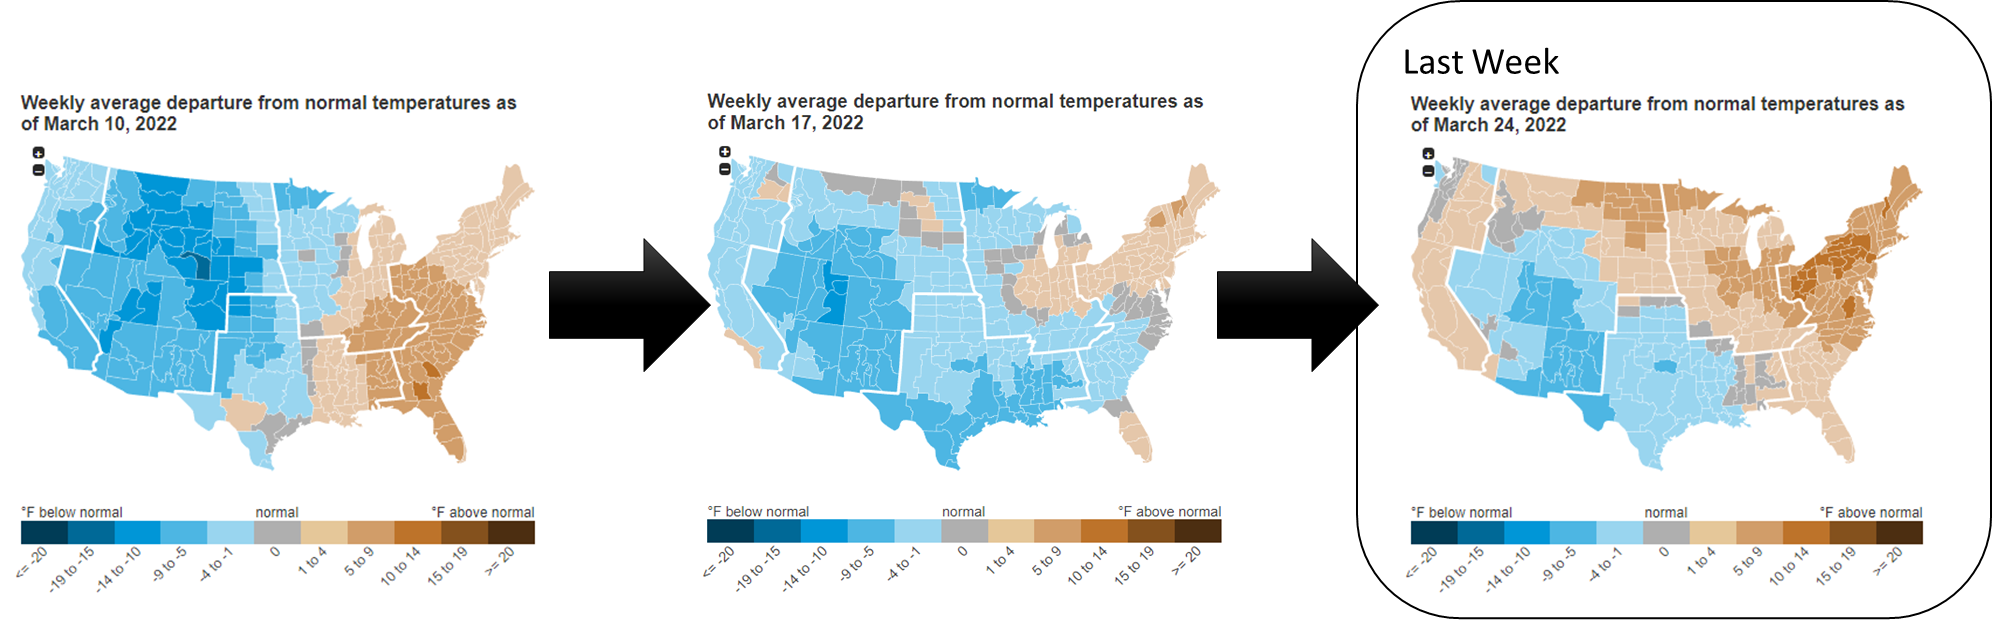
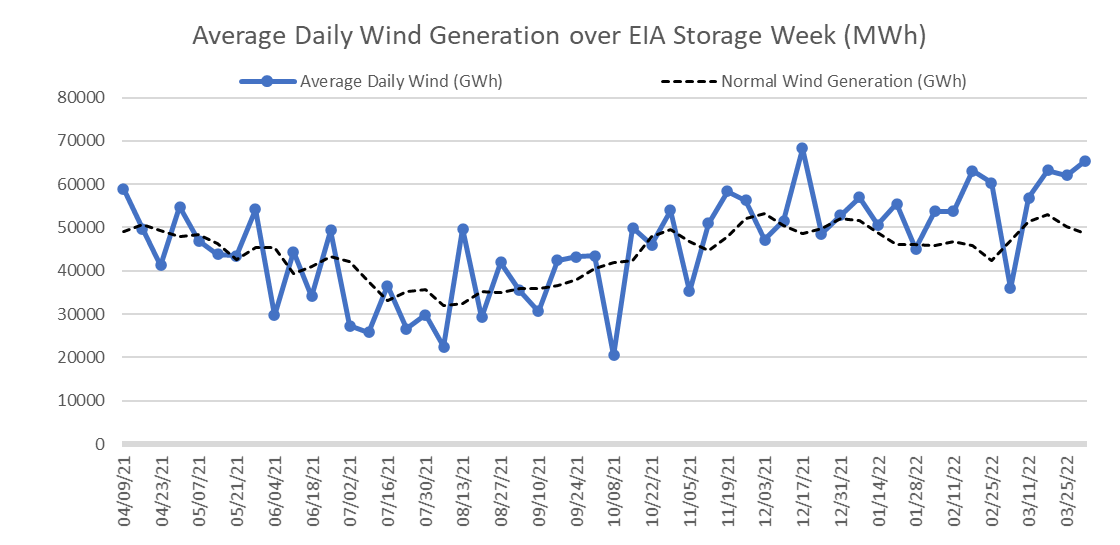
Wind generation held steady at above normal levels for the reference week. Wind generation averaged 62 GWh during the week from 63 GWh the week prior. We calculate ~52 GWh to be the expected norm for this time of the year.
This past week’s report was loose YoY. We estimate this report was ~3.2 Bcf/d loose vs LY (wx adjusted) as production returned and heightened levels of wind and solar kept power burns much lower than expected. With wind and solar at normal levels, this report would have been closer to 1.2 Bcf/d tight vs LY (wx adjusted).
For the week ending Apr 1st, our early view is -19 Bcf. This reporting period will take L48 storage level to 1,396 Bcf (-347 vs LY, -244 vs. 5Yr)
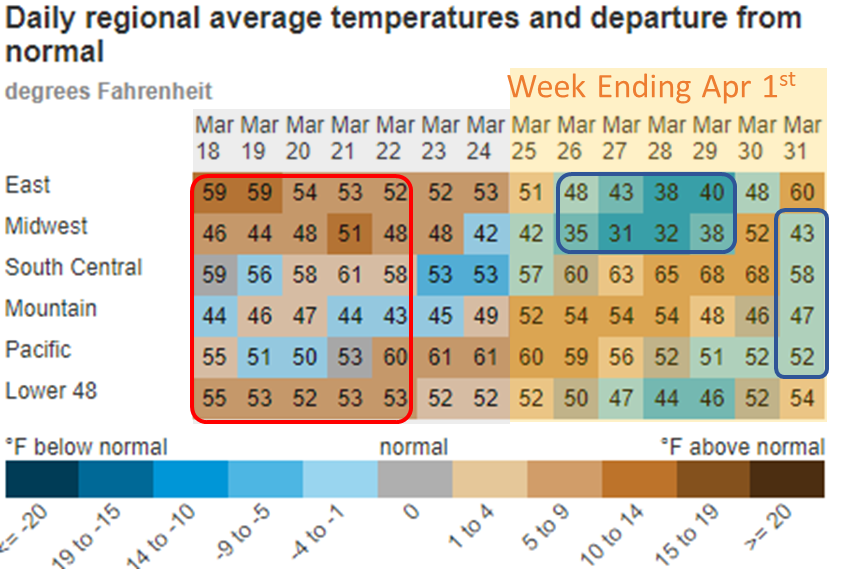
We are back to one final net withdrawal week for the year with cooling temps. Temps across the East Coast and Midwest turned cooler this past week. The net result was L48 GWHDD increasing by +5.5F relative to the previous week; resulting in a 6.3 Bcf/d increase in natural gas consumption for space heating (rescomm only). The Rockies to the West coast did remain warm for most of the week but average the low-density population has less impact on gas consumption.
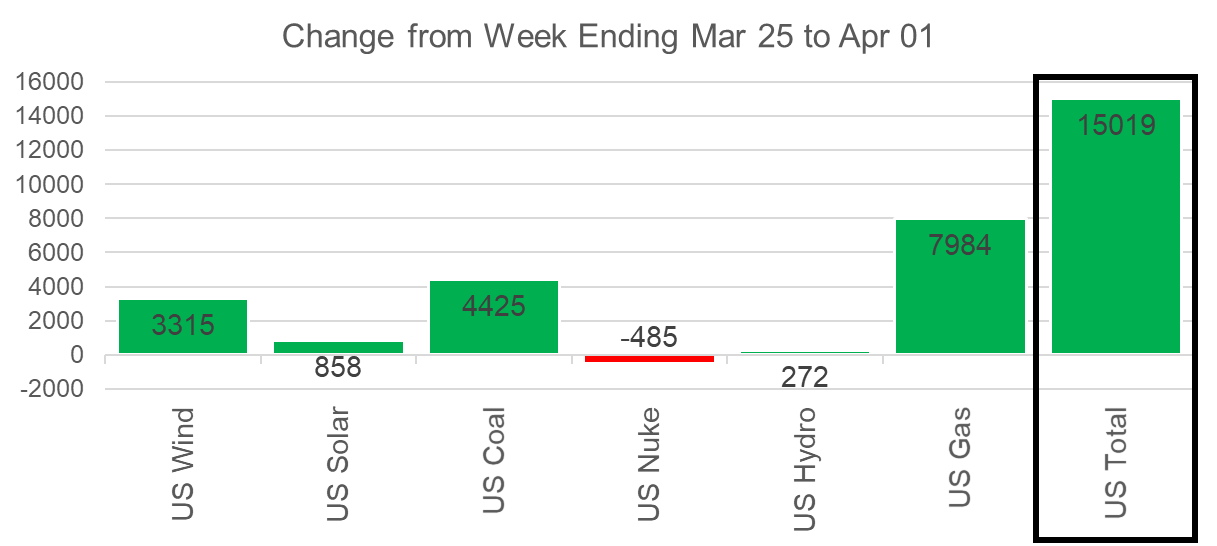
Overall, power burns were higher by 4% relative to the previous week. Natural gas generation was called upon to meet the rising load. Nat gas generation grew by an average of 8 GWh this past week resulting in approximately 1.0-1.5 Bcf/d of stronger power burns.
Domestic dry gas production also grew with the Texas and Midcon production returning. The higher output out of these regions offset the drop from the Northeast which looks to have suffered one last shot of freeze-offs. The average production for the week was higher by 0.5 Bcf/d to an average of 95.9 Bcf/d. This is the first week this year that overall production has regained to early December levels. That being said, the Northeast is still considerably off from its highs as seen in the chart below.
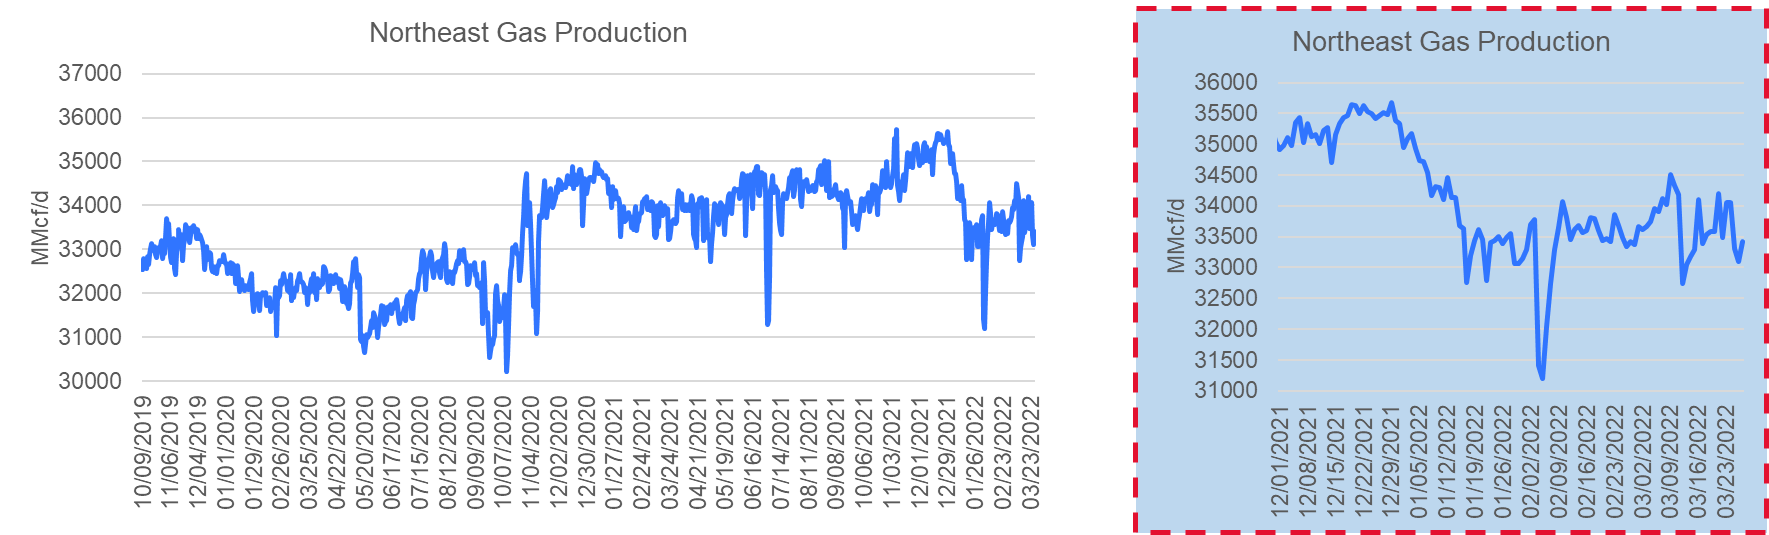
It’s difficult to attribute the lower NE production to freeze-offs this late in the season and therefore the common belief for the drop falls in one of the two camps outlined here:
1) During the winter new well production had been competing with storage draws for pipe space. With the turn to injection season, we could see new production come online to get us back to the 34 Bcf/d levels (+1.0 Bcf/d from current levels)
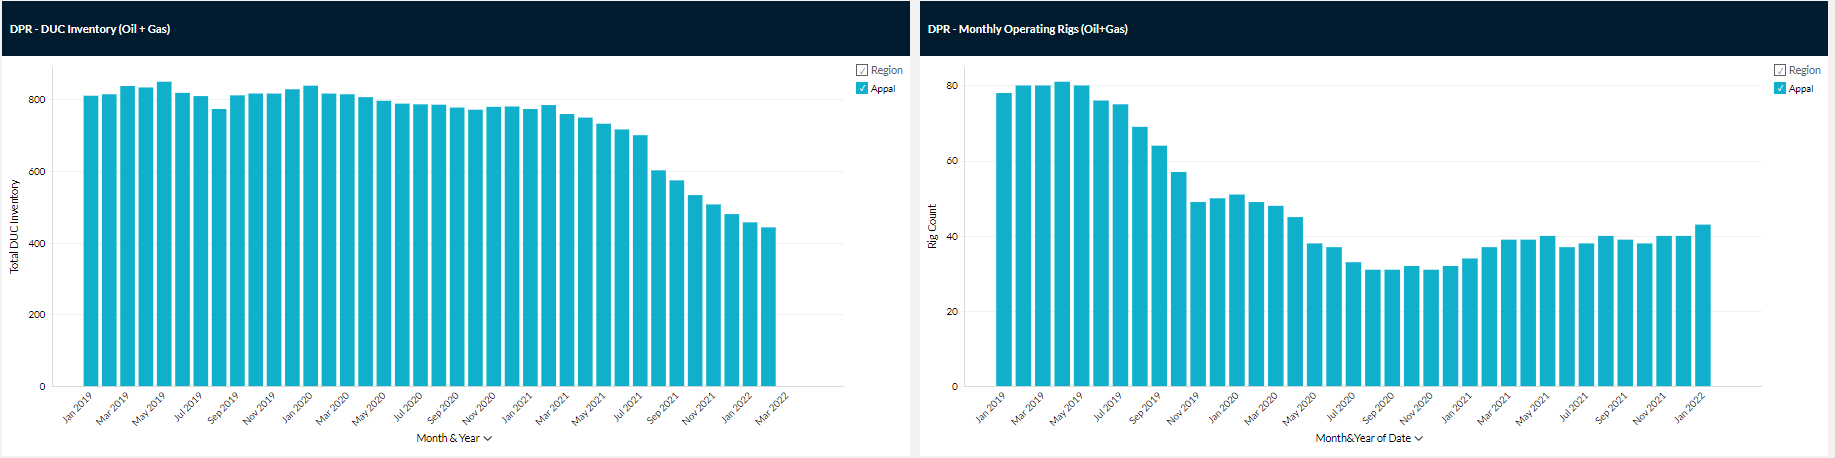
2) declining volumes from existing wells are outpacing volumes from new wells (due to low rig activity & low DUC)
#AppBasinDUCs&RigCount
Deliveries to LNG facilities averaged 13.1 Bcf/d, which was 0.1 Bcf/d higher than the previous week. Operations at Freeport, Sabine, and Calcasieu Pass were volatile as seen in the chart below.
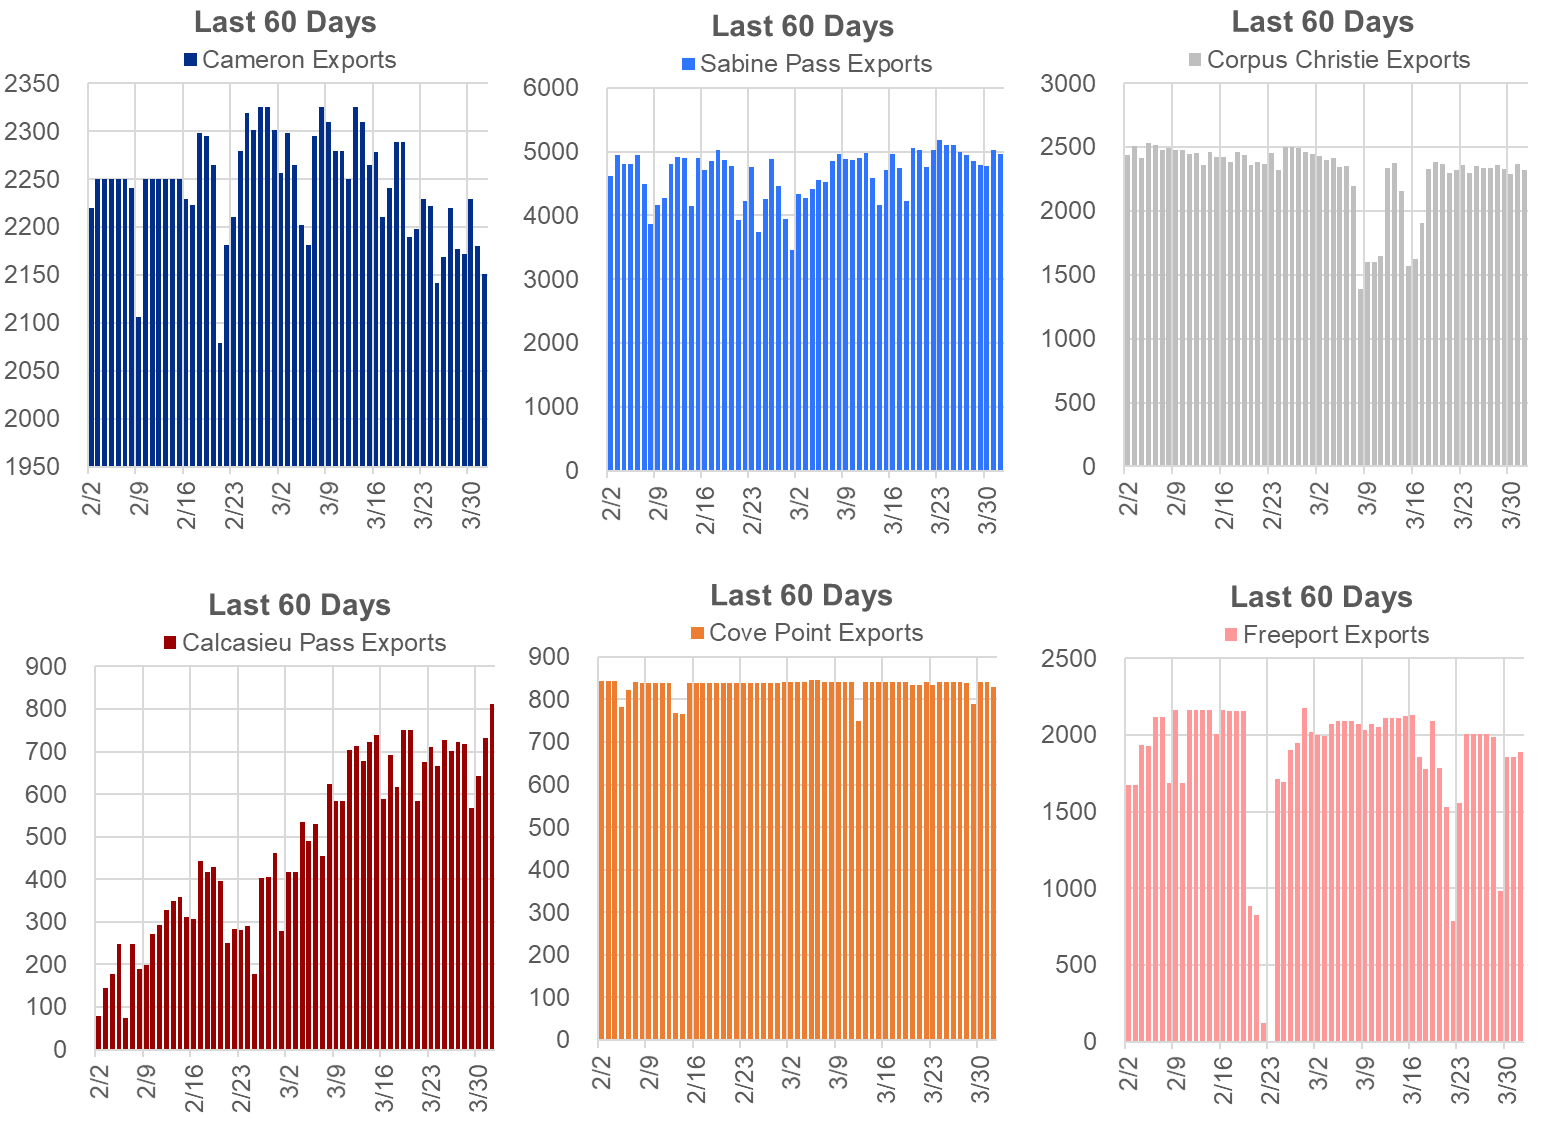
The net balance was 6.5 Bcf/d tighter week-on-week.
This email, any information contained herein and any files transmitted with it (collectively, the Material) are the sole property of OTC Global Holdings LP and its affiliates (OTCGH); are confidential, may be legally privileged and are intended solely for the use of the individual or entity to whom they are addressed. Unauthorized disclosure, copying or distribution of the Material, is strictly prohibited and the recipient shall not redistribute the Material in any form to a third party. Please notify the sender immediately by email if you have received this email by mistake, delete this email from your system and destroy any hard copies. OTCGH waives no privilege or confidentiality due to any mistaken transmission of this email.