We are going to focus on just 4 regions for this report – ERCOT, MISO, SPP & California. More regions are available through the BNEF platform.
To start, here is the number of new MWs that have come online and are expected to come online in the next few years.
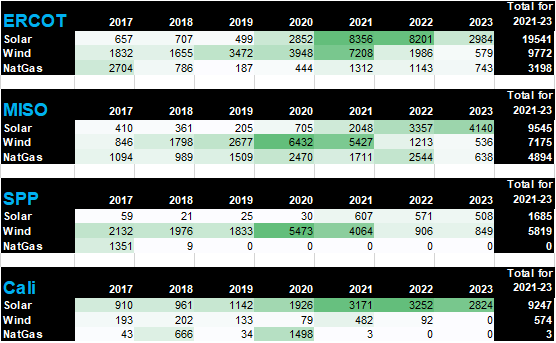
Source: BNEF
Here is the same data overlayed on a map to see visually where the new generation is located. The maps show all types of new generation, but it’s very apparent that wind and solar dominate.
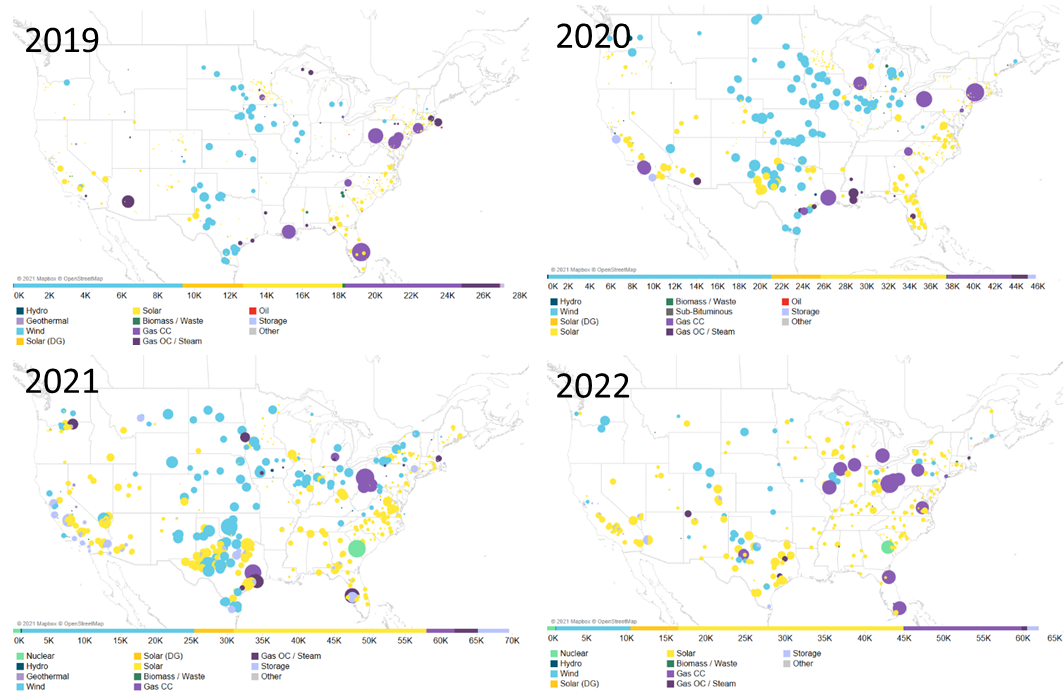
Source: BNEF
To see how the power stack has changed, this next visual shows the growth of wind and solar as it offsets coal and natural gas usage.
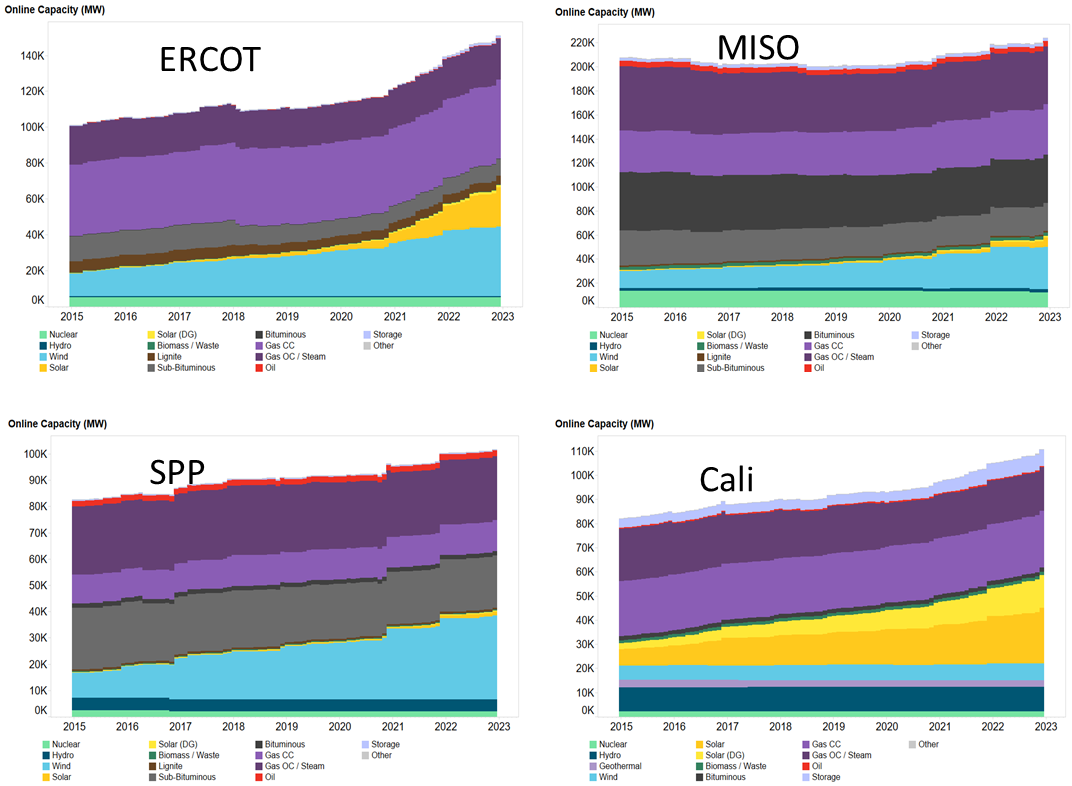
Source: BNEF
Finally, we want to get back to the analysis of how the new renewable energy could impact gas burns this summer. We estimated the impact of the YoY change in the power stack at the national level. This a very rough estimate, but should serve as a good estimate on the change to power burns purely from the change in the power generation mix.
Last time we estimated the new wind and solar capacity is utilized 30%, but the data from BNEF sheds some more light on the capacity factor of this generation type. The charts below show the capacity factor of wind and solar by age of the plant. As can be seen, the capacity factor of the new wind assets greatly exceeded our estimate.
The chart below shows the capacity factor (y-axis) of wind and solar assets against the year they commenced operations (x-axis). As can be seen, the news wind plants have become very efficient with some achieving a capacity factor above 50%.
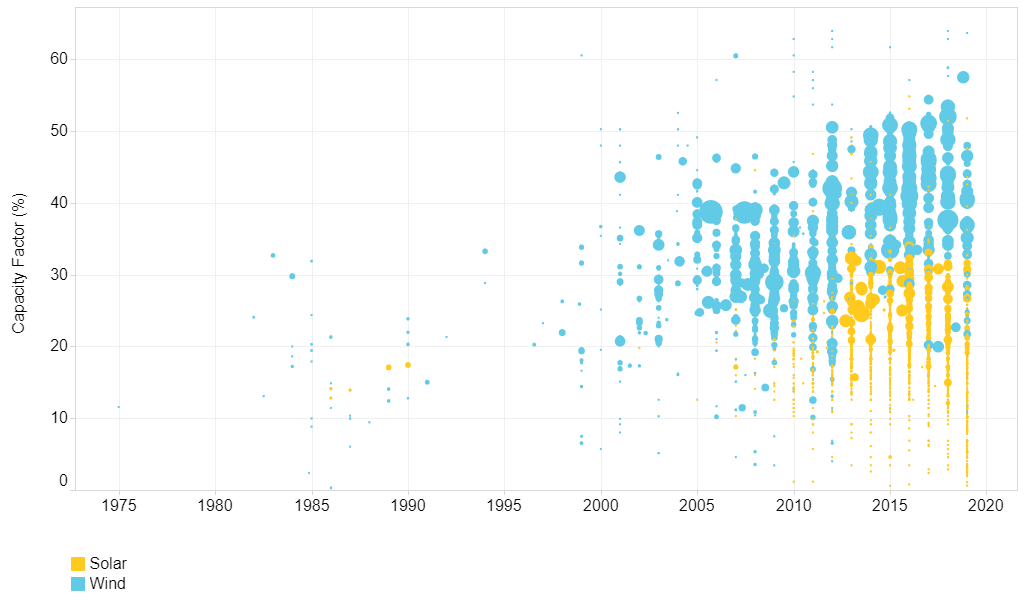
Source: BNEF
Here is the same data for the 4 regions.
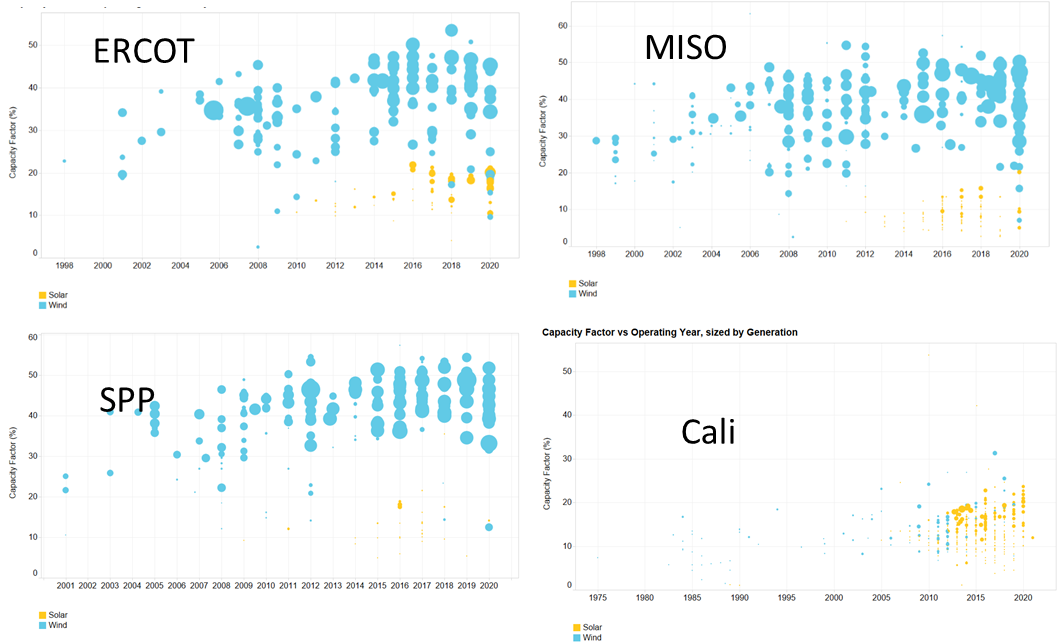
Source: BNEF
In reviewing this data, we have modified the capacity factor in our calculations to 40% for new wind assets, and 20% for the news solar projects. Using these assumptions, we estimate the gas burns (pushing out 7.5 HR natgas gens) will be on average 1.5 Bcf/d lower this summer and 0.8 Bcf/d lower this winter from the net generation change.
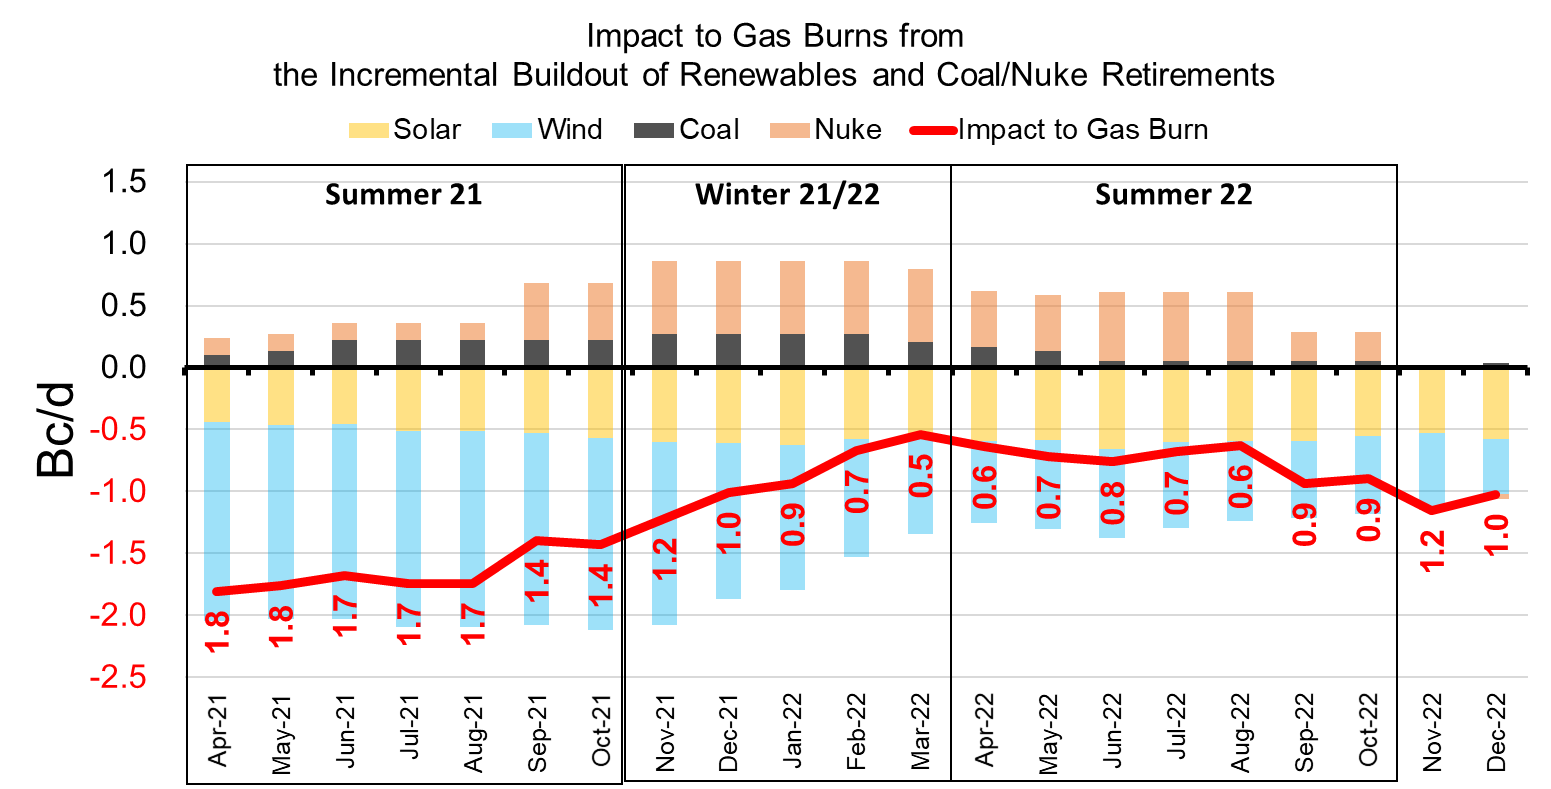
Source: Analytix.ai
Fundamentals for the week ending April 23: This past week the EIA reported a +38 Bcf storage injection for week ending April 16. This past week’s storage report came in out lower than the market consensus of +47 and sent natural gas prices higher on the release of the report. This was the 3rd bullish report in a row suggesting the balances are tighter than market estimates. Most analyst seemed to miss the South Central which came in at only +12.
For the week ending April 23th, our early view is +9 Bcf. The 5Yr average is a +67 Bcf injection. Our projected injection would take the L48 storage level to 1892 Bcf (-308 vs LY, -46 vs. 5Yr).
Domestic production continues to shift lower week-on-week. The drops came in from the Northeast and Rockies regions (total L48 -0.9 Bcf/d WoW). An array of pipeline maintenance projects look to be constraining production.
We recorded L48 TDDs increasing by an average of 2.4 degrees to 10.1 TDDs. The gains are mostly a result of the cooler temps (along with snow and heavy rain) that blanked much of the Central portion of the country. The overall weather led to ResComm consumption increasing by +5.3 Bcf/d WoW, and Power consumption increasing by +1.2 Bcf/d WoW.
Deliveries to LNG facilities averaged 11.6 Bcf/d, which was +0.2 Bcf/d higher than the previous week. The Cheniere plants were operating very close to their peak levels. Mexican exports decreased by 0.5 Bcf/d to 6.8 Bcf/d this past week, after posting a record flow the previous week.
Net the balance is tighter by 4.0 Bcf/d week-on-week.
Expiration and rolls: UNG ETF roll starts on May 12th and ends on May 17th.
May futures expire on Apr 28th, and May options expire on Apr 27th.
This email, any information contained herein and any files transmitted with it (collectively, the Material) are the sole property of OTC Global Holdings LP and its affiliates (OTCGH); are confidential, may be legally privileged and are intended solely for the use of the individual or entity to whom they are addressed. Unauthorized disclosure, copying or distribution of the Material, is strictly prohibited and the recipient shall not redistribute the Material in any form to a third party. Please notify the sender immediately by email if you have received this email by mistake, delete this email from your system and destroy any hard copies. OTCGH waives no privilege or confidentiality due to any mistaken transmission of this email.