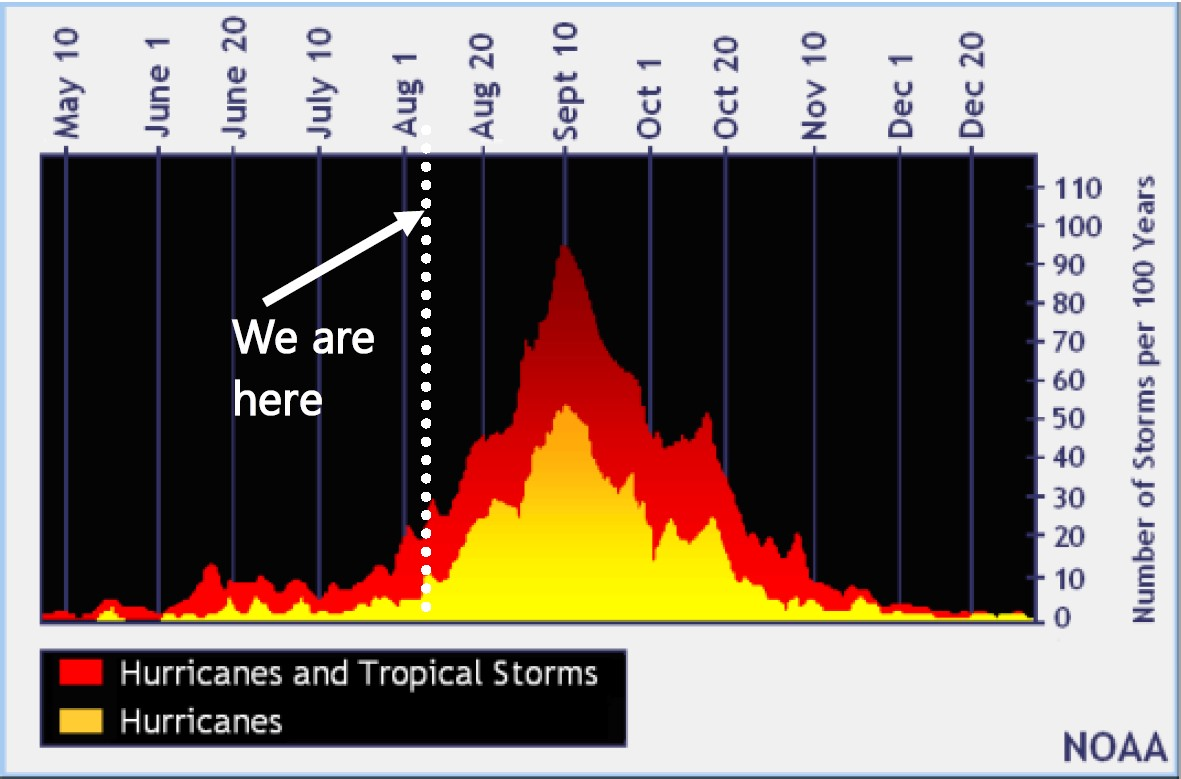
With the start of August, we are now quickly ramping up to the peak of hurricane season. Maxar reported on enelyst that “The season got off to a fast start with 5 named storms, peaking with Hurricane Elsa in early July, the earliest “E” storm on record.” However, there has been no notable tropical activity since Elsa dissipated on July 9th. This prolonged lull in activity does not mean that the season as a whole will be less active moving forward, as we are just now entering the peak hurricane season climatologically. A good stat to remember is that mid-August through mid-October accounts for 87% of Cat 1/2 hurricane days and 96% of major hurricane days.
Hurricanes are now typically net bearish for gas markets with:
1) GoM supply being less of a concern as offshore rigs are more hurricane-resistant
2) GoM offshore production dropping in recent years
3) onshore heavy rain, flooding, and wind damaging power and LNG infrastructure leading to demand destruction
4) onshore cloud cover limited power consumption
5) LNG tanker traffic disruption.
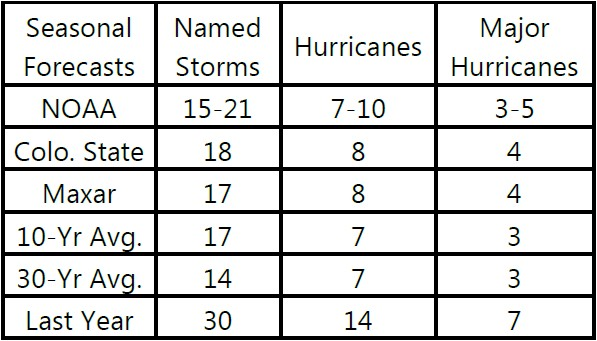
Earlier this week, the NOAA and Colorado State University issued minor updates to their Atlantic hurricane seasonal forecasts this week. Here is a summary:
NOAA’s forecast can be found here:
https://www.noaa.gov/news-release/atlantic-hurricane-season-shows-no-signs-of-slowing
Colorado State University’s forecast can be found here:
https://tropical.colostate.edu/Forecast/2021-08.pdf
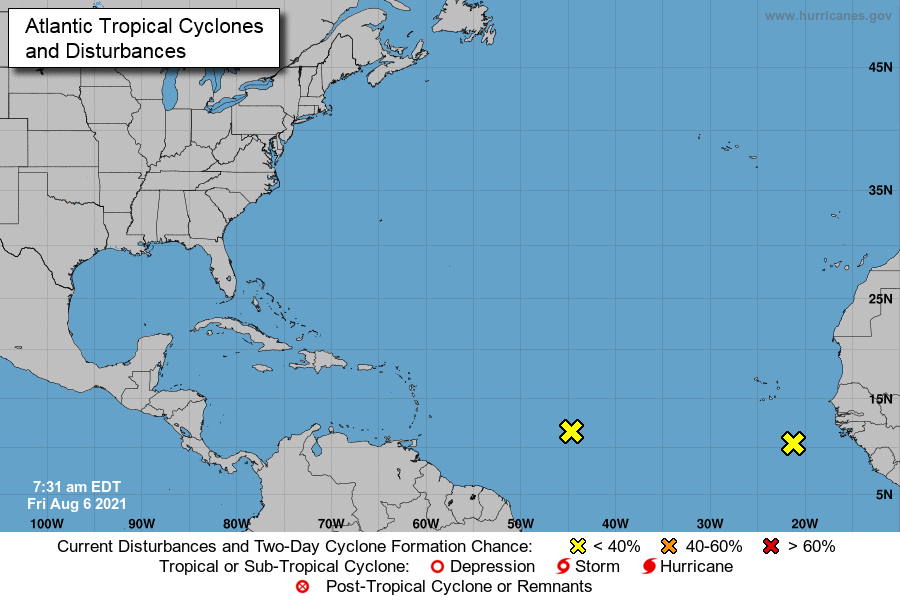
There are currently two disturbances in the central and eastern Atlantic, for which there is a low probability of developing into a tropical depression in the next week.
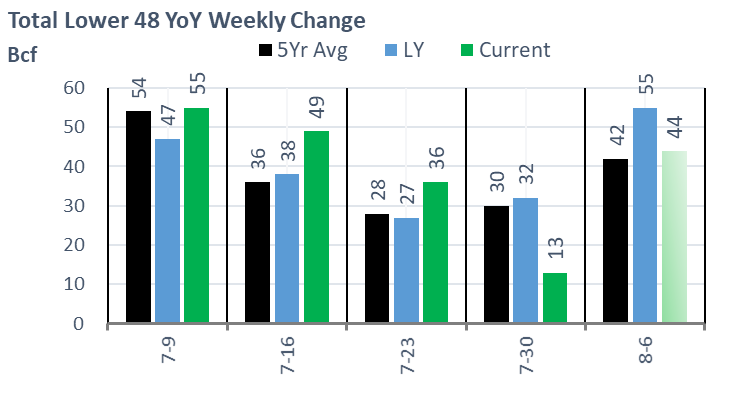
Fundamentals for the week ending Aug 6: This past week the EIA reported a +13 Bcf storage injection for week ending July 30. This report came in 5 Bcf below market consensus and 6 Bcf/d below above our estimate. It is difficult to nail down the exact reason for this week’s miss by it’s likely related to the lower wind output. Salt had the largest weekly summer draw on record at -19 Bcf. So far in Q3, we have had salt caverns pull a total of 46 Bcf taking overall levels to 250 Bcf.
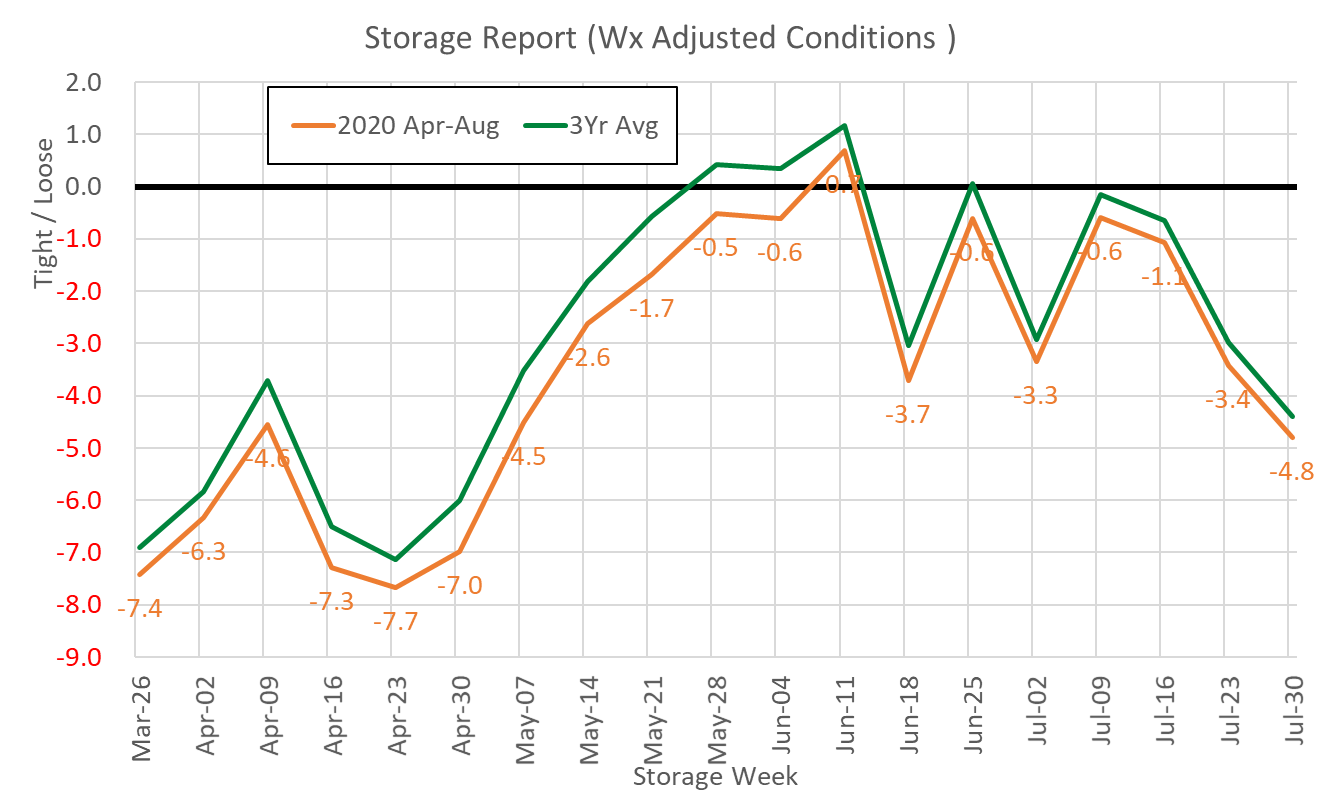
Since the start of summer, the storage numbers have painted tight S/D versus the past few years. This past report showed balances being nearly 5 Bcf/d tighter wx adjusted versus the storage injections from April through August of last year. This storage number was the tightest number since early June, but that would not have been the case if we had more normal wind conditions. The renewables output has been playing a big role in daily storage activity.
For the week ending Aug 6th, our early view is +44 Bcf. The 5Yr average is a +42 Bcf injection. Our projected injection would take the L48 storage level to 2771 Bcf (-553 vs LY, -183 vs. 5Yr).
Domestic production was lower last week by 0.6 Bcf/d to 91.9 Bcf/d. There were small drops across multiple basins. In the Northeast, there are some pipeline maintenance events impacting production receipts on TGP and TCO.
This week we finally got confirmation on the startup of the Whistler pipeline. This pipeline is owned by Kinder Morgan and can carry 2 Bcf/d from the West Texas to East Texas. Since this is an intrastate pipeline, we have no visibility into exact flows. The current storage reports do not suggest that this pipeline is flowing at a strong level or has unlocked some trapped production.

Total consumption was lower this week, primarily driven by fewer pwCDDs and power burns. Total national temps were lower by 2.9 F week-on-week. Total national power generation was lower by 7.8%, of which natgas gen made up half. We approximate natgas generation was lower by 3.7 Bcf/d. Wind gen was also lower by 26% to a daily average of 22 GWh nationwide. The wind picks up next week as most of the northern part of the US experiences above-normal temps.
Deliveries to LNG facilities averaged 10.6 Bcf/d, which was -0.3 Bcf/d lower than the previous week. The drop comes primarily from Cameron feedgas volumes dropping by 30%. There are rumors of a maintenance event at the facility, but the operator has not confirmed it.
The net balance is looser by 4.1 Bcf/d week-on-week.
Expiration and rolls: UNG ETF roll starts on Aug 13th and ends on Aug 18th.
Sept futures expire on Aug 27th, and August options expire on Aug 26th.
This email, any information contained herein and any files transmitted with it (collectively, the Material) are the sole property of OTC Global Holdings LP and its affiliates (OTCGH); are confidential, may be legally privileged and are intended solely for the use of the individual or entity to whom they are addressed. Unauthorized disclosure, copying or distribution of the Material, is strictly prohibited and the recipient shall not redistribute the Material in any form to a third party. Please notify the sender immediately by email if you have received this email by mistake, delete this email from your system and destroy any hard copies. OTCGH waives no privilege or confidentiality due to any mistaken transmission of this email.