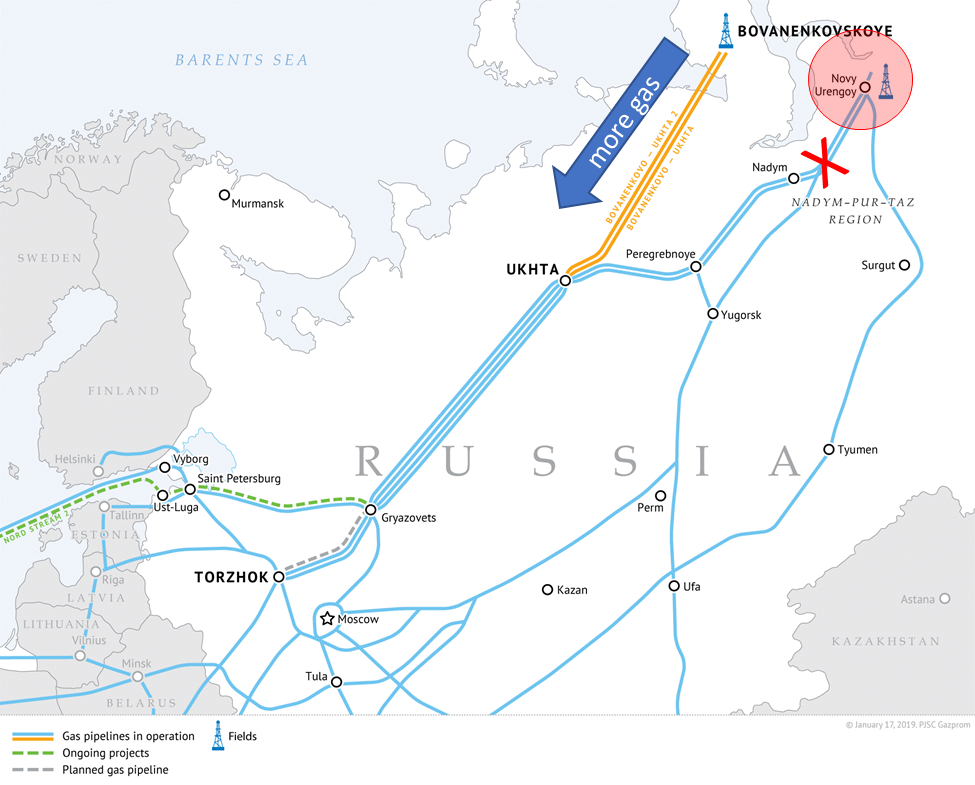
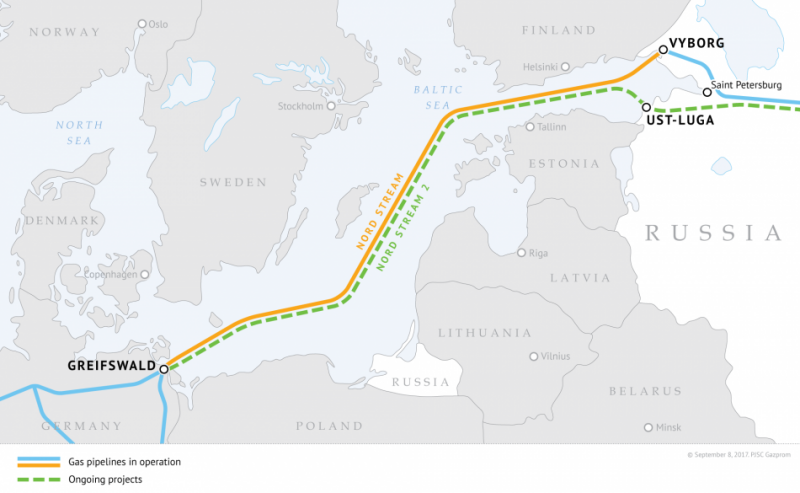
The price spike due to the treatment plant incident quickly turned around by a dramatic sell-off following an announcement on Thursday from Gazprom regarding Nordstream 2 (NS2). They said that NS2 pipeline may carry 5.6 billion cubic meters (bcm) this year or 10% of the design capacity [55bcm]. This announcement sent both TTF and NBP prices lower, even though Gazprom did not give a start-up date though.
We should note that NS1 (which has an identical route and size to NS2) has been flowing for over a decade. According to Gazprom, it carried over 57.5bcm in 2018 and 2019 and over 58bcm in 2020. Between January-July 2021 it carried 33.7bcm, more than in the same period in 2020 and 2019.
NS2’s design capacity is enough to carry around 12% of all the gas consumed in the EU and the UK in 2020, according to ICIS.
Gazprom owns both the pipeline and the gas that will flow in it- hence giving Gazprom too much control. The EU mandates a separation between the pipeline owner and gas supplier and therefore it remains uncertain how the pipeline will comply with these rules.
Here are some charts from Platts that show the week-on-week change in the forward TTF and JKM forward curve with all this market news.
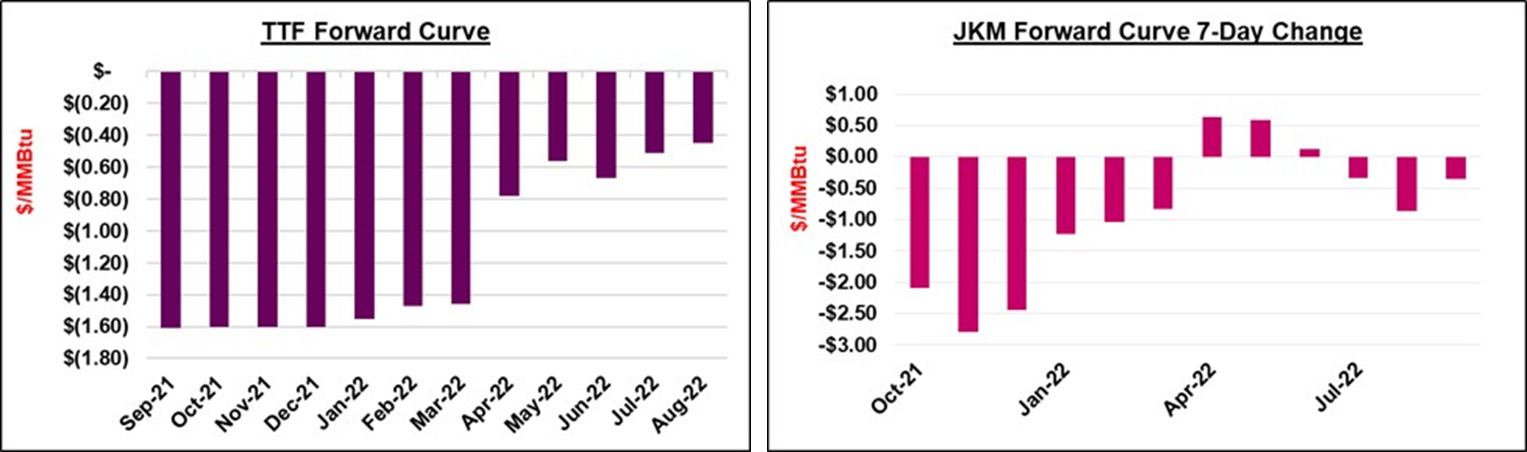
Source: Platts
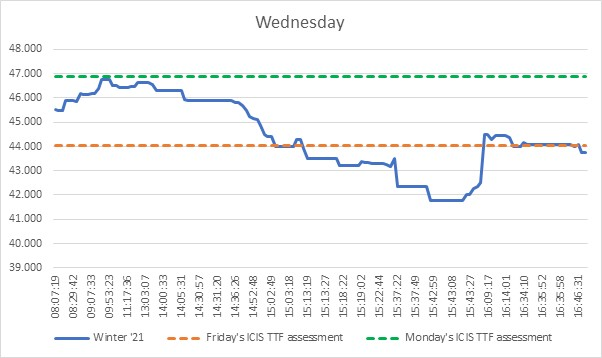
We should also mention the extremely volatile trading session on August 18th. For a brief period, a data glitch on GASCADE showed NS2 flowing into Germany. This sent TTF prices diving intraday before slightly correcting itself after the bug was fixed.
Source: ICIS
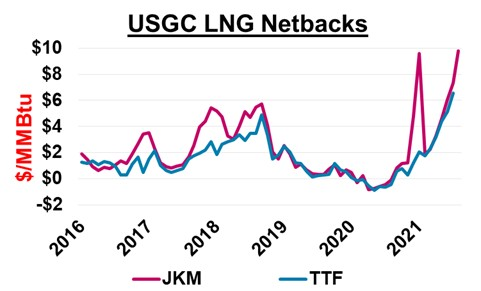
The JKM netback is maintaining a strong premium to the TTF through the balance of the year, which suggests that few cargoes will be delivered to Europe. This was the case in June and July.
Source: Platts
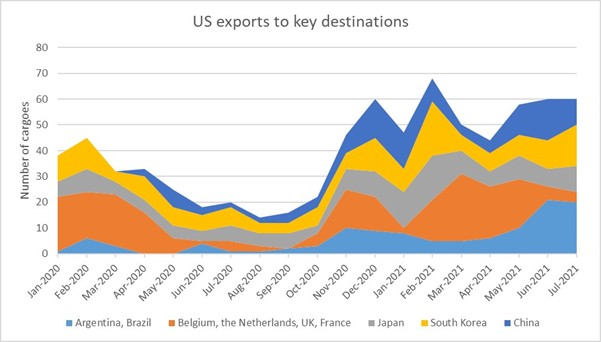
Aside from Asia, Brazil has boosted its LNG imports this year with depleted hydro stocks due to a historic drought. Brazil was the second-largest importer of US LNG in July, behind South Korea, for the second month in a row with 900,000 tonnes, 17% of the total. This translated into the country’s largest percentage share of US LNG since October 2017 at almost 21%.
Source: ICIS
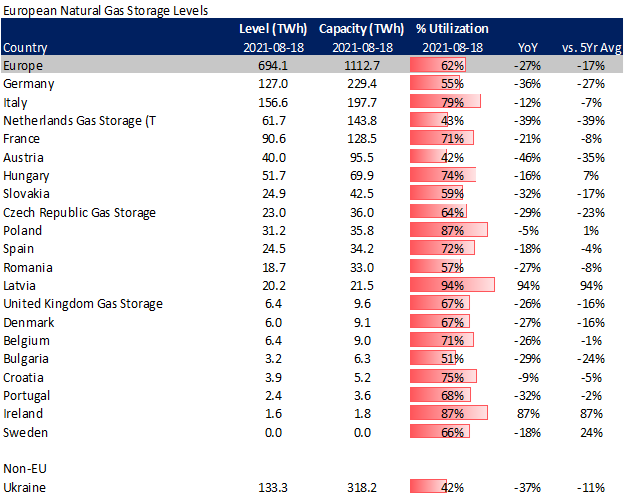
The increased competition for flexible LNG cargoes has left Europe in a bad position as it enters the winter season. Current storage levels are 62% utilized, which is 27% behind last year and 17% behind the 5Yr average.
Source: Analytix.ai
Fundamentals for the week ending Aug 20: This past week the EIA reported a +46 Bcf storage injection for week ending Aug 13, but this included a reclassification. There was +4 Bcf of base gas capacity converted to working gas at a non-salt SC facility. Taking the implied flow of +42 Bcf, this report still came in 5 Bcf above the market consensus and 6 Bcf/d above our estimate. This report period was one of the warmest on record, but the wind was strong allowing for lower gas burns. To put into context how much wind changes the storage equation each week we had two weeks this summer where CDDs totaled 91, but one got us a +13 Bcf and the other a +42. The renewables output has been playing a big role in daily storage activity.
This week’s number with the strong wind showed balances being 0.3 Bcfd looser (wx adjusted) versus the storage injections from April through August of last year, +0.8 Bcfd looser than the 3Yr average injection rate. This storage number was the loosest number since late June, but that would not have been the case if we had more normal wind conditions.
For the week ending Aug 13th, our early view is +44 Bcf. The 5Yr average is also a +44 Bcf injection. Our projected injection would take the L48 storage level to 2866 Bcf (-548 vs LY, -174 vs. 5Yr).
Domestic production was slightly lower last week by 0.1 Bcf/d to average 92.4 Bcf/d. There were minor drops across multiple basins, with nothing notable to cause them.
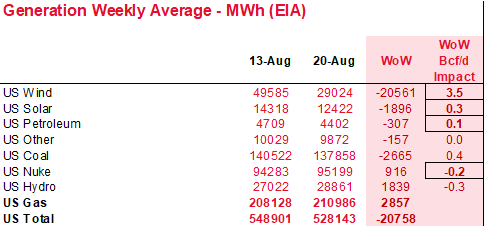
Total consumption was lower this week, primarily driven by fewer pwCDDs and power burns. Total national temps were lower by 1.5F week-on-week. Total national power generation was lower by 3.6%, but wind generation was off considerably. Wind generation fell by 42% to levels we saw in late-July. We approximate natgas generation was higher by 3.5 Bcf/d just due to the drastic change in wind generation. The wind is expected to pick up next week again as national temperatures move back up above-normal temps.
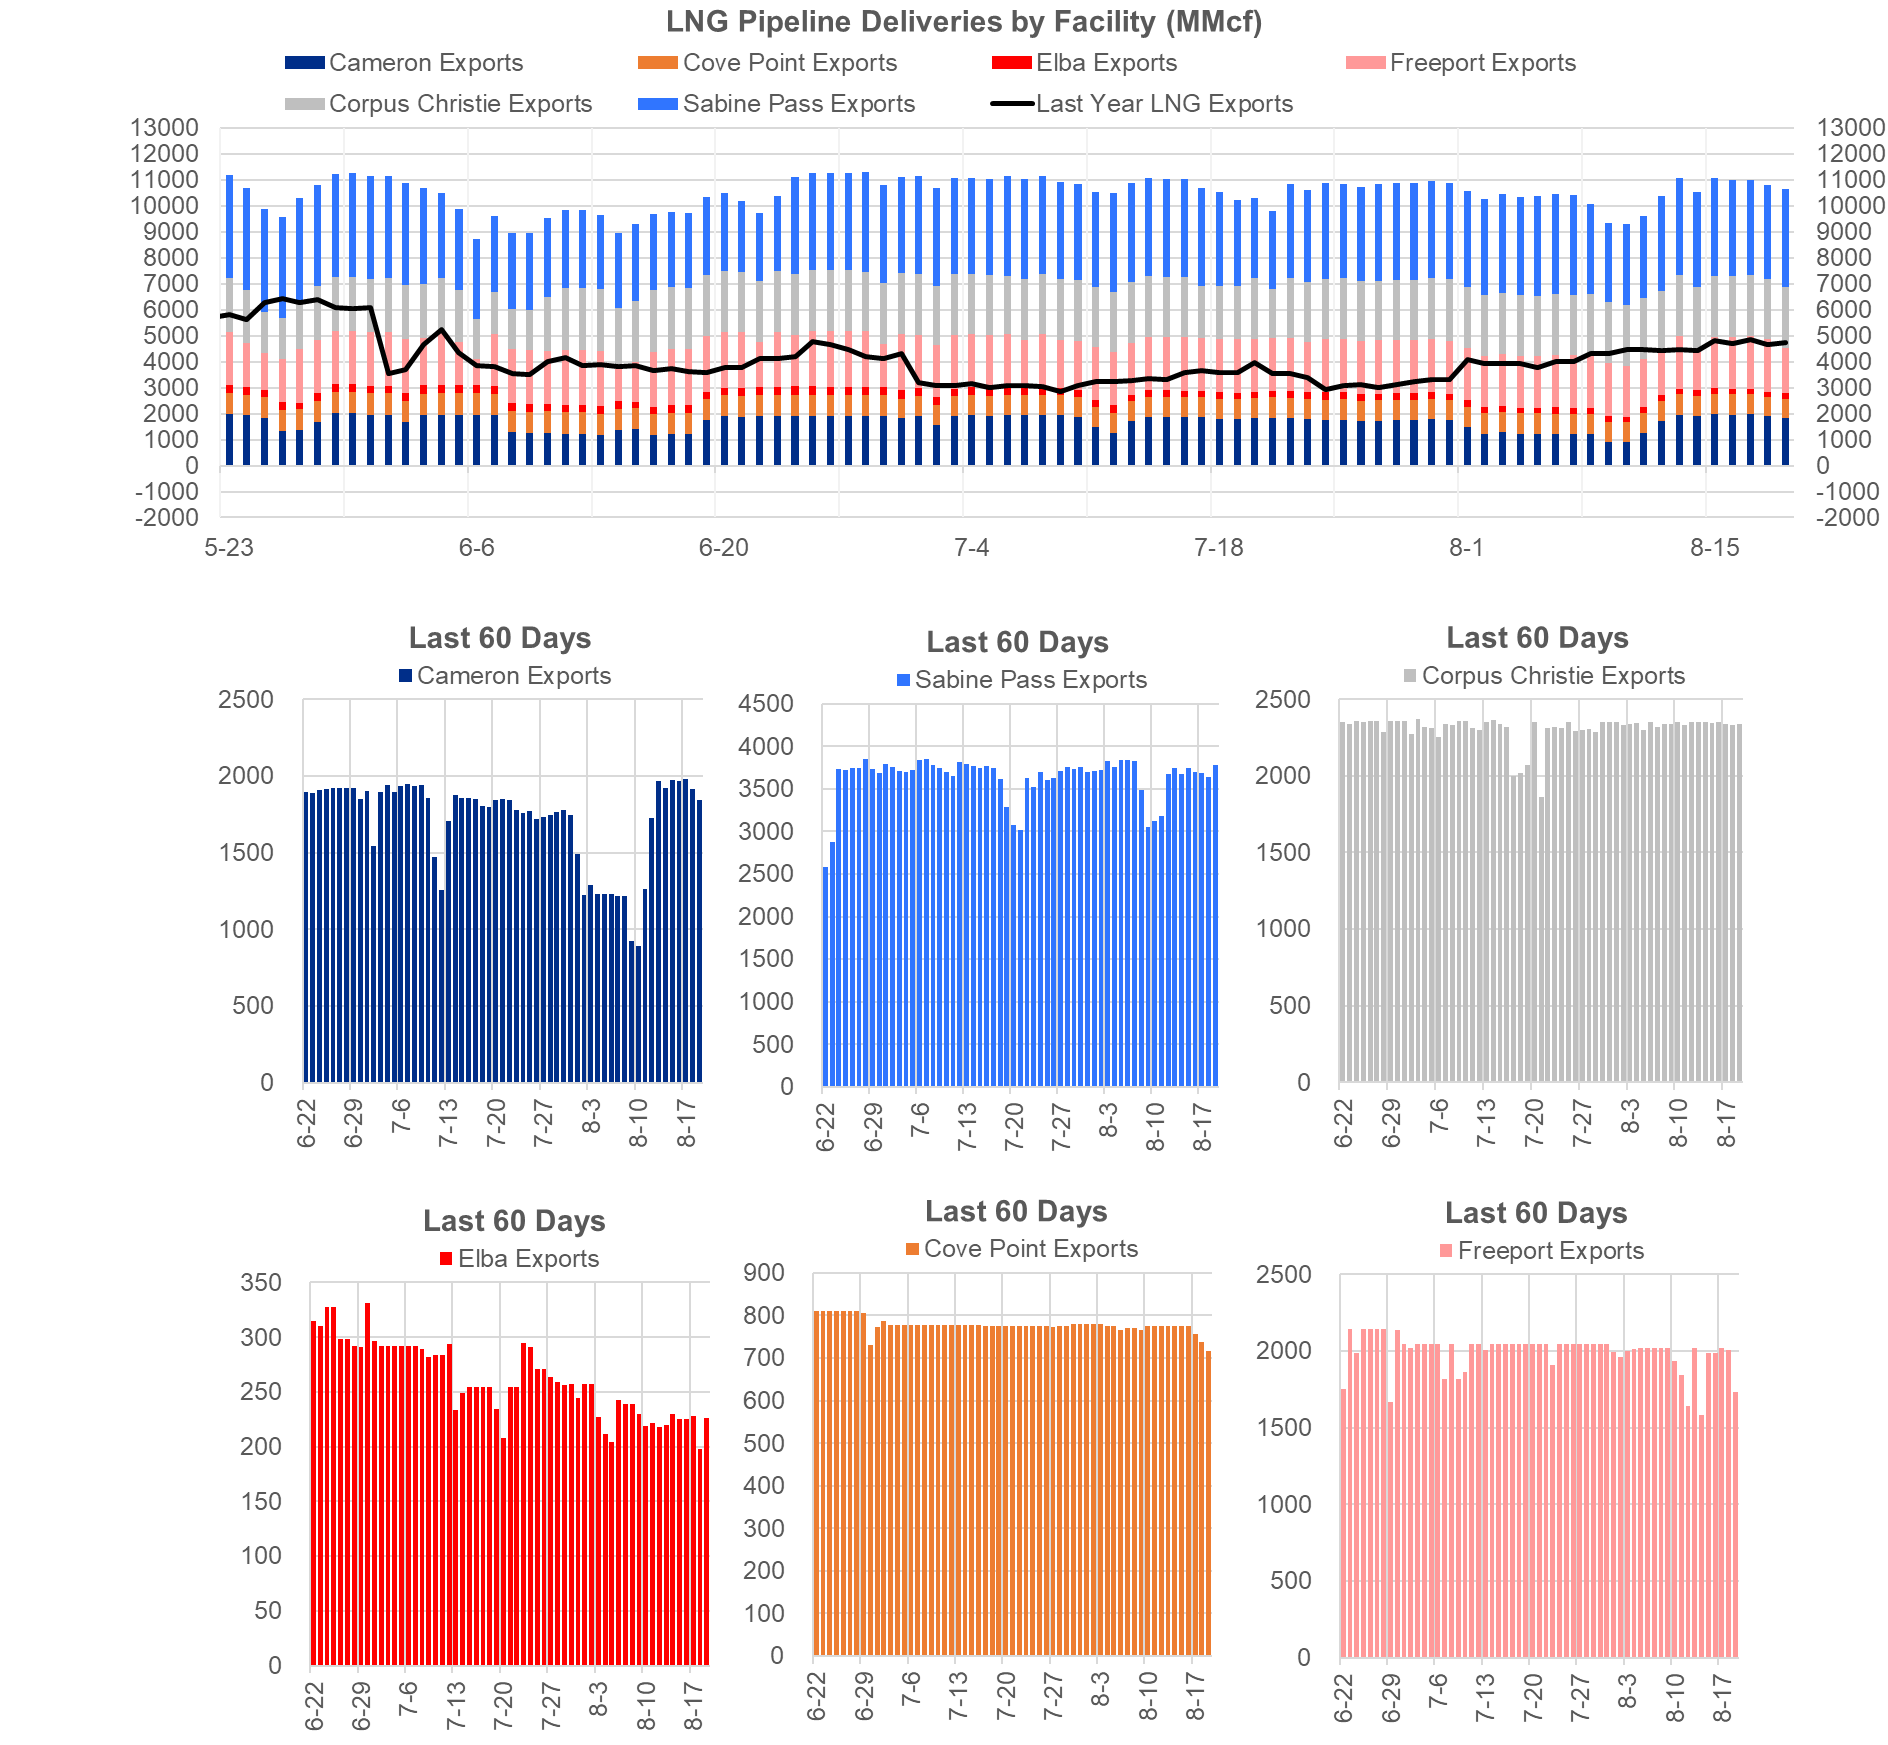
Deliveries to LNG facilities averaged 10.9 Bcf/d, which was +0.9 Bcf/d higher than the previous week. The increase comes with Cameron feedgas volumes increase back to normal levels after train 1 going on maintenance, Sabine volumes increasing after the completion of some upstream pipeline maintenance.
The net balance is looser by 0.4 Bcf/d week-on-week.
Expiration and rolls: UNG ETF roll starts on Sept 14th and ends on Sept 17th.
Sept futures expire on Aug 27th, and August options expire on Aug 26th.
This email, any information contained herein and any files transmitted with it (collectively, the Material) are the sole property of OTC Global Holdings LP and its affiliates (OTCGH); are confidential, may be legally privileged and are intended solely for the use of the individual or entity to whom they are addressed. Unauthorized disclosure, copying or distribution of the Material, is strictly prohibited and the recipient shall not redistribute the Material in any form to a third party. Please notify the sender immediately by email if you have received this email by mistake, delete this email from your system and destroy any hard copies. OTCGH waives no privilege or confidentiality due to any mistaken transmission of this email.