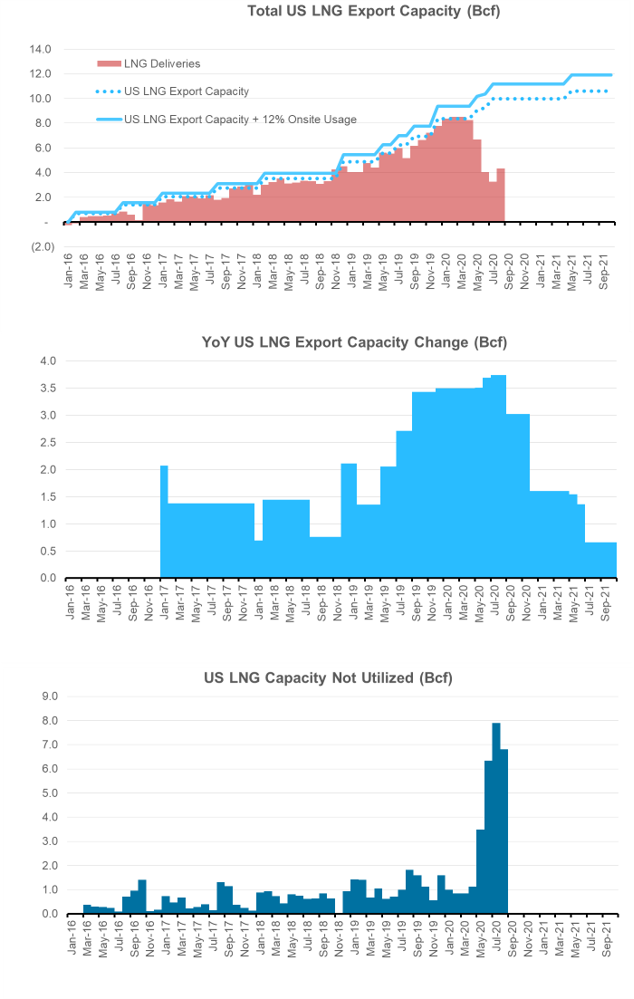
LNG continues to be an important part of the balances this summer. After experiencing a steady drop in US gas deliveries with cargo cancellation, it appears we are on the upswing. The lowest total was recorded on July 9th with only 2.8 Bcf delivered to all US LNG. This month so far we have been heading higher, with 5.1 Bcf/d recorded the past 2 days.
Where do we head from here?
On August 20th, Kaleem Asghar from ClipperData noted on enelyst.com that there are 16 cargo ships currently sailing towards the US with an ETA over the next 7 days.
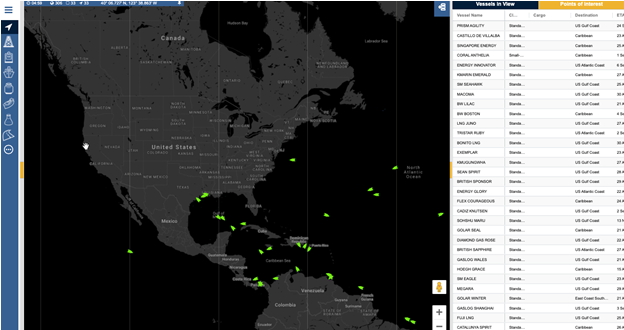
Source: ClipperData
Rough math on that tell us that LNG needs to shoot up to fulfill that requirement. He did say that 16 ships leaving in one week might be on the high side, but the US has the capability to load 20 cargoes a week.
If 16 tankers were to arrive, than here is how the math works out.
[16 cargos x 3.3 Bcf/cargo] + 12% onsite usage = 59 Bcf or 8.45 Bcf/d over 7 days.
And if 10 tankers were to arrive, than here is how it looks.
[10 cargos x 3.3 Bcf/cargo] + 12% onsite usage = 40 Bcf or 5.3 Bcf/d over 7 days.
So we could see LNG deliveries ramp up in the short-term, but there are some risks to the above numbers. First, some of the LNG could be loaded from already liquefied natgas siting in onsite above ground storage. Second, there are two major storms headed into the Atlantic that could delay some of the tanker arrivals.
Here is a map of the storm trajectories from 8/20 from Maxar Weather. The green dots represent all the offshore structures.
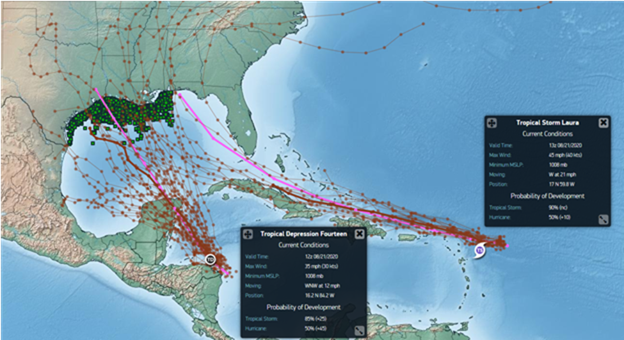
Source: Maxar Weather (8/21)
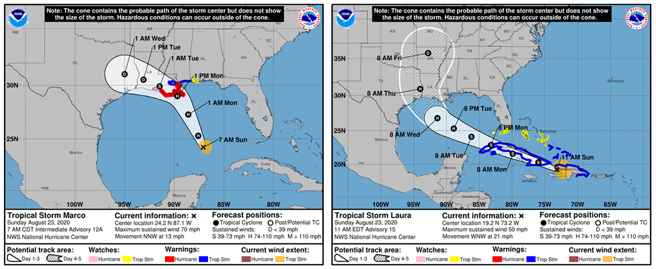
Here is the latest look on the direction of the tropics activity. Both not look to be headed towards LA and East Texas.
Next we take a look at upcoming cargo cancellations. Most US cargoes that have been cancelled are from long-term offtakers. This summer LNG delivered prices across the world fell below the cost of feedgas at US facilities, resulting in cargo cancellations. Europe storage is stabilizing and global spreads are once again opening up as we head towards winter.
Cheniere — which operates around half of the US’ total liquefaction capacity — exported 78 cargoes from April through the end of June, down from 104 cargoes a year earlier and as many as 128 cargoes in the first quarter of this year. Around the 20th day of each month, offtakers notify Cheniere about the status of their cargo 2 months out. There is no public announcement, but market analyst and journalist usually uncover a good estimate. This past week, ClipperData said they expect up to 10 cancellations, but there was the potential of an uplift from deferred cargoes in October. A Reuters article did a good job of summarizing the past and forward cancellations.
“The exact number of cancellations was not immediately clear but several trade sources estimated a range of three to 10, much lower than the 25 cargoes likely cancelled for loading in September and the 40 to 45 likely cancelled in July and August”
Article Link: https://www.reuters.com/article/us-usa-lng-exports-idUSKBN25H0QT
And just if you were wondering about winter. The spreads look wide enough to support all contractual volumes to flow. Cheniere stated they expect a recovery in global LNG demand, particularly in Asia, to continue throughout the rest of the year.
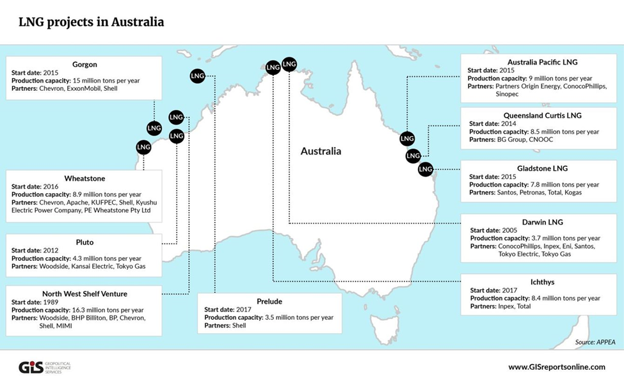
Australian Gorgon update
Following the planned restart of Train 2 in September, Chevron has proposed a new staggered maintenance schedule for Gorgon LNG to Australia’s safety regulators that will see Train 1 shutdown for inspection in early October and Train 3 in January 2021.
To make up lost volumes, offtakers have received requests from Chevron to instead supply cargoes from either the North West Shelf (NWS) LNG project or the Wheatstone LNG to meet its contractual commitments for scheduled deliveries in October and November. Originally this event had been seen as bullish for North American gas, but this is no longer the case if LNG is supplied by another nearby project.
Fundamentals for week ending Aug 21: Our early view for the upcoming storage report is a +50 Bcf injection for the lower 48. This would take storage levels to 3425 Bcf.
US natural gas dry production slight lower week on week with domestic production averaging 86.5 Bcf/d for the week. Total natural gas demand was much lower than the previous week, with power burns lower by 2.8 Bcf/d week-on-week. Cooler weather in the Northeast and Midwest offset the record heat in the Pacific regions.
Canadian imports were higher last week averaging 4.7 Bcf/d. Mexican exports averaged of 6.2 Bcf/d, the highest weekly average on record.
Deliveries to LNG facilities averaged 4.7 Bcf/d, up another 0.4 Bcf/d week on week.
Expiration and rolls: UNG ETF roll starts on Sept 12th and ends on Sept 17th.
September futures expire on August 27th, and September options expire on August 26th
This email, any information contained herein and any files transmitted with it (collectively, the Material) are the sole property of OTC Global Holdings LP and its affiliates (OTCGH); are confidential, may be legally privileged and are intended solely for the use of the individual or entity to whom they are addressed. Unauthorized disclosure, copying or distribution of the Material, is strictly prohibited and the recipient shall not redistribute the Material in any form to a third party. Please notify the sender immediately by email if you have received this email by mistake, delete this email from your system and destroy any hard copies. OTCGH waives no privilege or confidentiality due to any mistaken transmission of this email.