It’s been quite a week. On Monday the Midwest experienced one of the hottest days of the year, while heat continued across many other parts of the country. Overall, the week ending August 27 showed record-high PWCDDs. The main weather event was the two hurricanes in the Gulf of Mexico. Marco fizzled into a non-event, while Laura made landfall over Cameron, Louisiana at 1 AM CT on Thursday. At landfall, it was a Cat 4 hurricane, with maximum sustained winds of 150 mph. Numerous LNG export plant and refinery operations were disrupted, and the true extent of the damage is still unknown.
At Calcasieu Pass, the tide height peaked at greater than 11 feet, which is 5 feet higher than what is considered to be the major flood stage. At Sabine Pass, the tide height peaked at 5.2 feet, which is at the moderate flood stage. Wind gusts peaked at 133 mph in Lake Charles just before 2 AM as the station went offline.
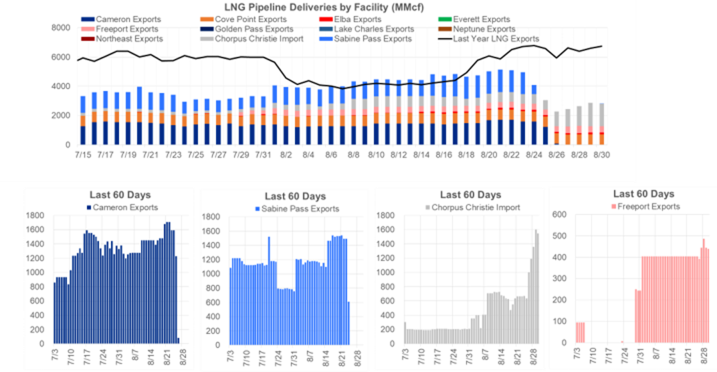
Marine traffic in the Gulf of Mexico started moving on Friday morning. Five LNG tankers were in the GoM, but it’s unclear where they were all headed. ICIS noted that Sohshu Maru arrived at Corpus Christe on Friday, and some other vessels that were originally due to load at Sabine Pass were heading there as well (The 155,000cbm Gaslog Shanghai and the 139,000cbm Golar Arctic). As of this morning’s nomination data, Sabine and Cameron are still not taking and feedgas. Corpus Christie on the other hand is operating at full capacity.
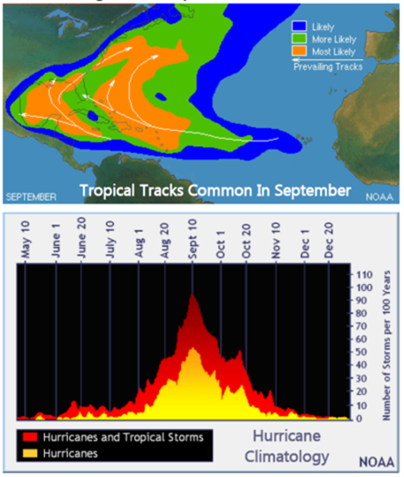
The peak of the Atlantic hurricane season occurs around September 10, but the month as a whole is often the most active of the season. In the past 10 years, September has averaged 6 named storms and 4 hurricanes, including 2 major hurricanes.
This continues to be a very hot summer in the West and nationally. The June to August period is forecast at 1032 PWCDDs, ranking 3rd hottest back to 1950.
Here are some regional rankings from Maxar Weather:
Pacific at #7, Mountain at #1, South Central at #11, Midwest at #8 and East at #3. For RTO/ISO, summer is forecast to rank #7 in CAISO, #7 in ERCOT, #9 in MISO, #1 in NEISO, #1 in NYISO, #2 in PJM and #15 in SPP.
Natural gas markets moved higher throughout the week, but looking at the fundamentals the event seems to point to looser balances. Marco and Laura knocked offshore production, but the demand destruction looks to be greater as of now. In the image below, we simply overlaid the reported drop in offshore production from BSEE.org, increased Canadian imports, and the drop in LNG utilization. As seen from Aug 22nd to Aug 30th, the net impact of these three factors is +2.8 Bcf looser.
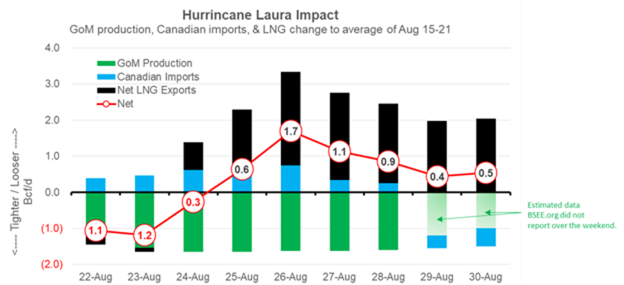
We recognize that this is quite simplistic, so here are some things to keep in mind:
1) Will the offshore production return quickly, or is there some long-term structural damage? (Bullish)
2) Was there any onshore production impacted, specifically in the Haynesville? (Bullish)
3) More 700,000 people lost power along the TX/LA border at the peak. The current number is 420,000 people. What was the impact of power outages on power burns, and how long until normal operations resume? (Bearish)
4) What was the power generation impacts as Laura travels North and then East? (Bearish)
5) Is there long-term damage to Sabine and Cameron? (Bearish)
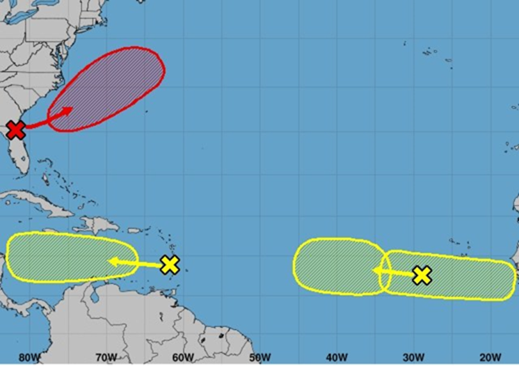
Lastly, NOAA is monitoring two tropical waves moving west in the Atlantic, both of which have chances of becoming the next tropical depression or tropical storm. First, a wave about 550 miles east of the Windward Islands is gradually developing and moving at 15 mph. It has a 20% chance of developing over the next two days and a 30% chance of doing so in the next five, according to the NHC’s 8 AM Sunday update. Second, a wave southwest of the Cabo Verde Islands is moving through unfavorable conditions but has a 30% chance of developing over the next five days.
Fundamentals for week ending Aug 28: Our early view for the upcoming storage report is a +38 Bcf injection for the lower 48. This would take storage levels to 3458 Bcf. We anticipate this next storage report to be tricky with big changes to both supply and demand as a result of Marco and Laura. The industry estimates for this report range between 26-45 according to The Desk.
US natural gas dry production was lower week on week with domestic production averaging 85.3 Bcf/d for the week. Total natural gas demand was much higher lower than the previous week, with power burns higher by 1.5 Bcf/d week-on-week. Warmer weather in the Northeast added 1.2 Bcf/d of power generation.
Canadian imports were higher last week averaging 5.2 Bcf/d. This was in response to higher prices resulting from Marco and Laura. Mexican exports averaged of 6.6 Bcf/d, the highest weekly average on record.
Deliveries to LNG facilities averaged 3.9 Bcf/d, down 0.9 Bcf/d week on week.
Expiration and rolls: UNG ETF roll starts on Sept 12th and ends on Sept 17th.
October futures expire on September 28th, and September options expire on September 25th
This email, any information contained herein and any files transmitted with it (collectively, the Material) are the sole property of OTC Global Holdings LP and its affiliates (OTCGH); are confidential, may be legally privileged and are intended solely for the use of the individual or entity to whom they are addressed. Unauthorized disclosure, copying or distribution of the Material, is strictly prohibited and the recipient shall not redistribute the Material in any form to a third party. Please notify the sender immediately by email if you have received this email by mistake, delete this email from your system and destroy any hard copies. OTCGH waives no privilege or confidentiality due to any mistaken transmission of this email.