Throughout the summer, European and Asian benchmarks have been trading at an immense premium to Henry Hub to attract every last cargo from sources like the US. JKM followed TTF prices which kept rising with concerns of low storage levels ahead of winter. At the moment, Europe is in a massive storage deficit and the cool weather is exacerbating the situation. Current levels are at 68% full or the level typically seen in late December.
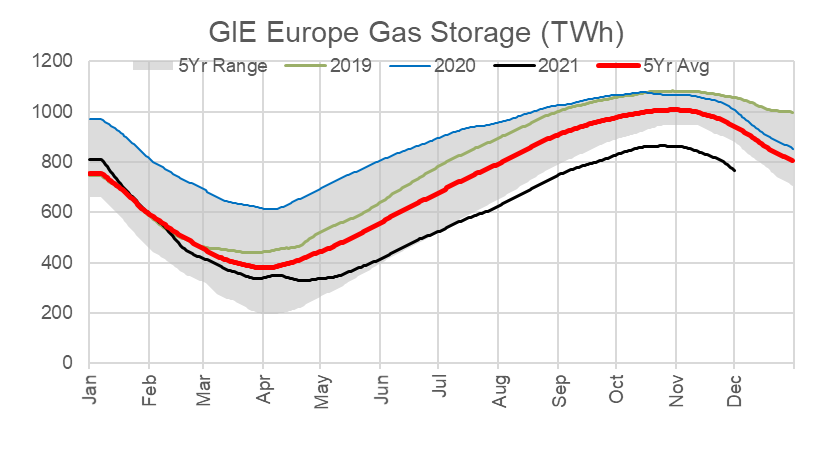
The strong power burns in Europe due to rising carbon prices and geopolitical tension with Russia led to the lowest end of Oct European storage levels. As traders started seeing the tight nature of the market, TTF and NBP started to rise to reduce gas demand and any spot LNG cargos. There was a bit of hope towards the end of summer that Nord Stream 2 commenced by the end of this year, but that faded quickly when Germany’s regulator announced a temporary suspension of the certification process of the pipeline in November and the US government imposed new sanctions on linked companies. Some more details on that:
- The Federal Network Agency is the German regulatory office for electricity, gas, telecommunications (BNetzA) concluded that the certification of an operator of the Nord Stream 2 pipeline would only be possible if the operator is organized legally under German law. NS2 is currently organized out of Switzerland. Timing-wise, the regulator currently has four months from Sept 8th to make a draft decision and then submit it to the European Commission, who then has up to four months to send BNetzA its opinion, after which BNetzA has another two months to make a final decision. So it looks like we are far from seeing any flows on this pipe. [info from the ICIS team on enelyst.com]
- The US looks to be concerned with Russia’s potential influence over the European region by using its energy supplies to pressurize countries within the area. Europe has become a major destination for US LNG, and new flows from Russia could reduce US-to-Europe flows.
Historical US Export to Region
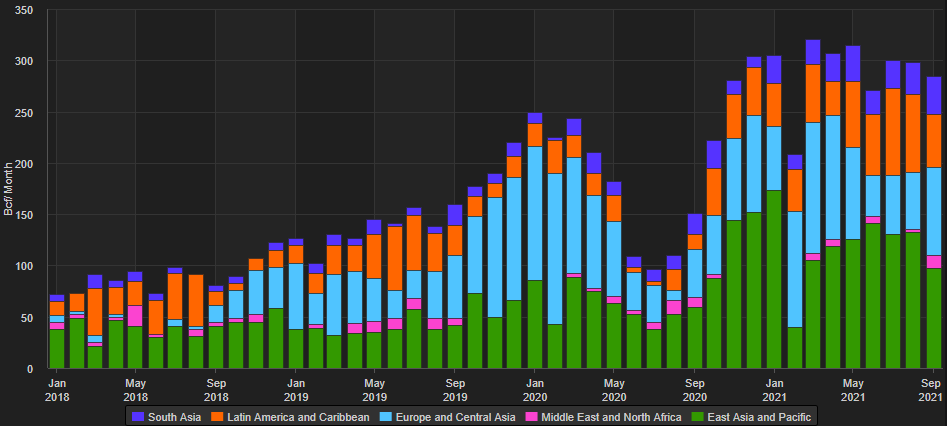
Source: Refinitiv, EIA
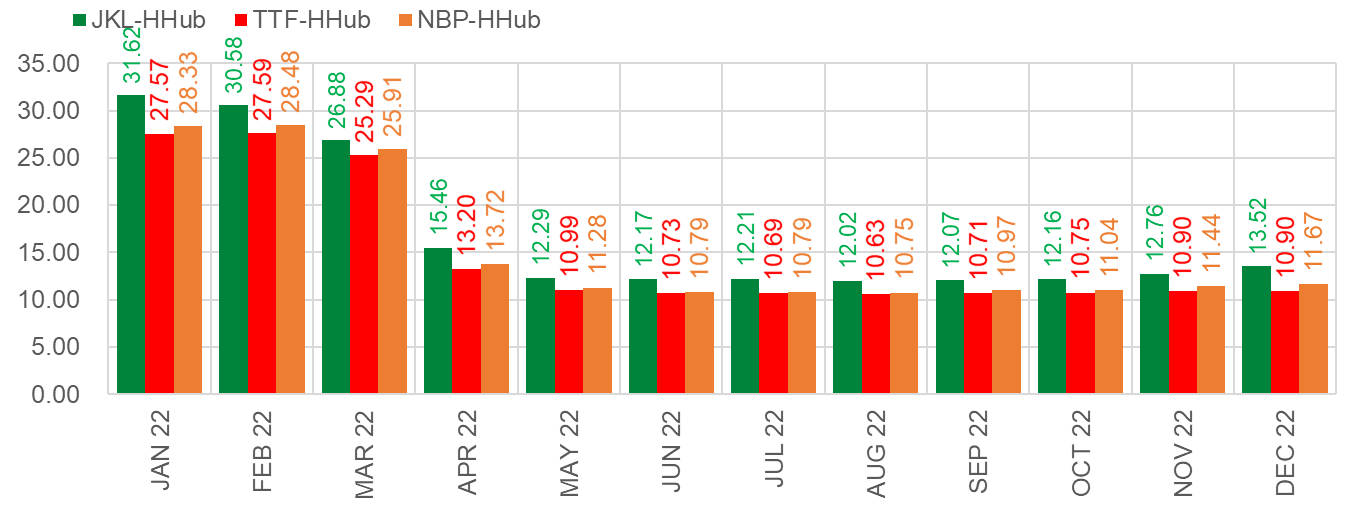
Global LNG prices continue to stay elevated even as Henry Hub retreats with warm weather and robust domestic supply. As seen below, the price spread indicates strong US LNG exports even past this winter.
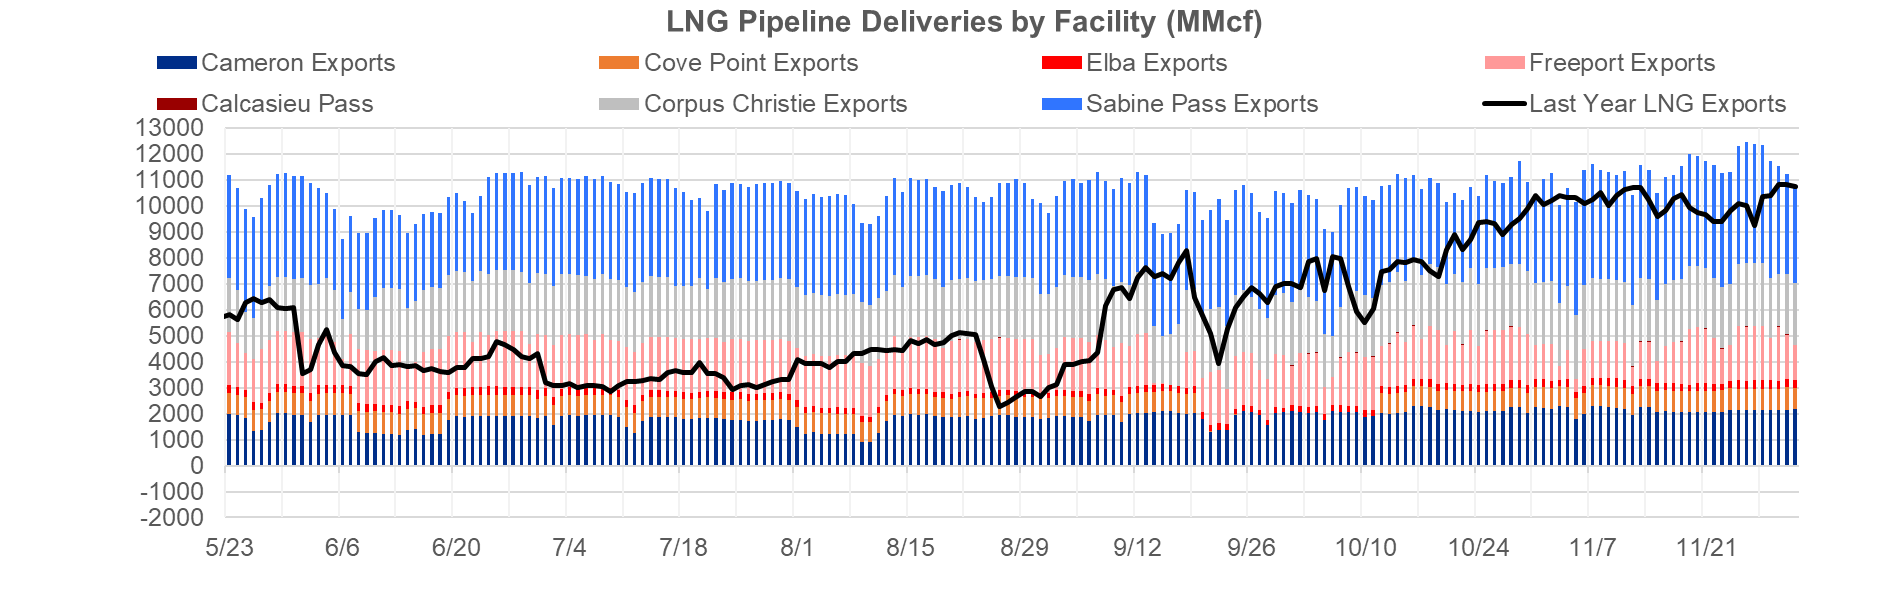
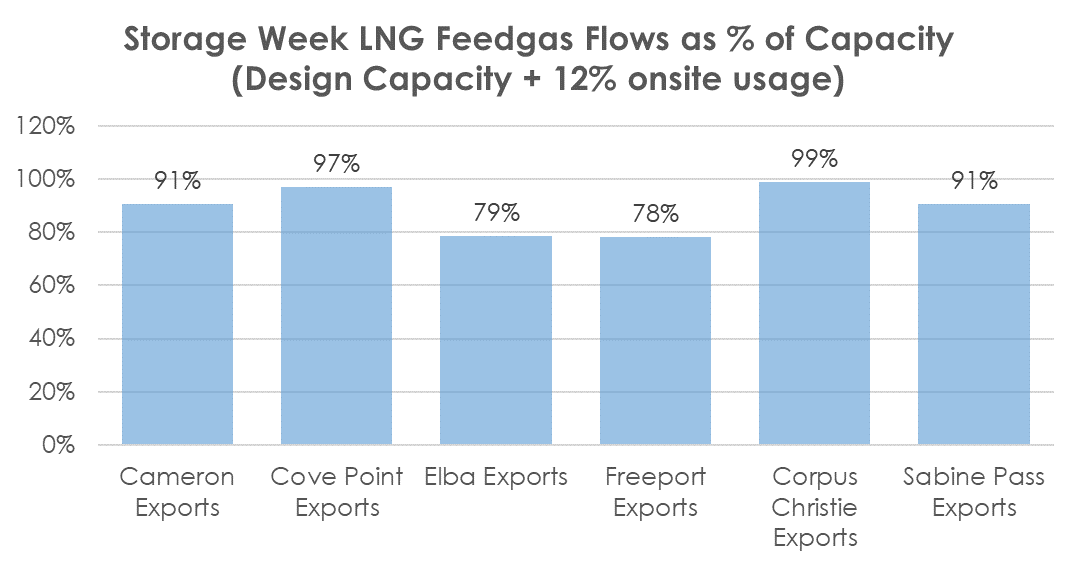
Now back to the US. With the existing terminals and two that are in the start-up phase, we hit a new LNG feedgas delivery record this past week. On November 26th, total feedgas levels hit 12.47 Bcf/d. This day marked Freeport being up and fulling functional and Sabine’s Train 6 starting up. Additionally, we see Calcasieu Pass LNG’s first 2 modules taking 20-25 MMcf/d.
With US Spot prices coming off their highs and European/Asian prices remaining strong, we anticipate high utilization of the US LNG fleet. The average historical plant utilization during the winter is roughly 87%, but with the strong global LNG price spreads, we are factoring in a 90% plant utilization.
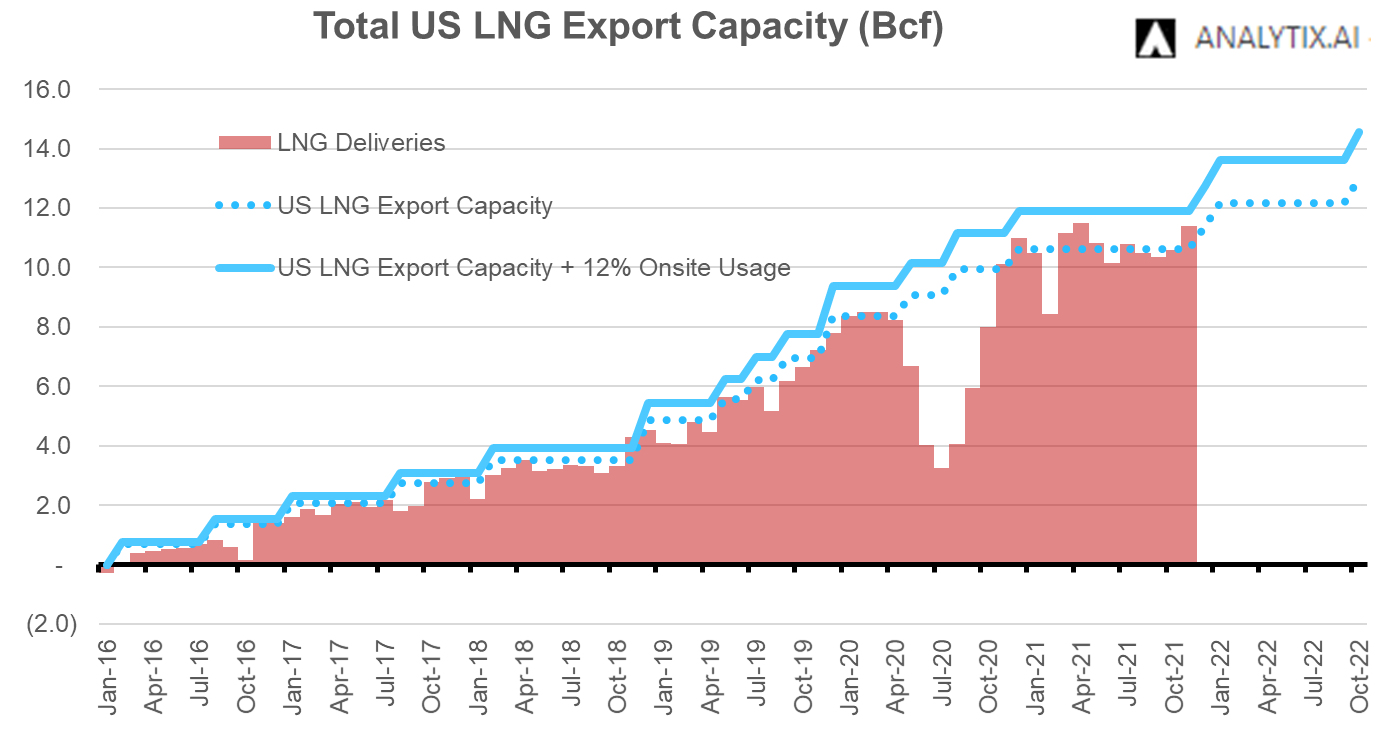
Our average net LNG feedgas forecast for the winter after adding plant use and netting the small level of imports is 12.1 Bcf/d (Nov = 11.3 to Mar = 12.5).
In other news:
Pembina Pipeline is canceling plans to build its Jordan Cove LNG export project and related pipeline in Oregon, after 8 years of ongoing regulatory setbacks. On Wednesday, Pembina asked FERC to drop its 2020 authorizations for the export terminal and the Pacific Connector pipeline that would have supplied the facility from WestCan and the Rockies. Jordan Cove was aiming to be the first natural gas export facility on the US West Coast, which is closer to key demand centers in Asia. The terminal was designed to liquefy and export up to 1.04 Bcf/d. So for the time being, LNG tankers are going to have to traverse the Panama Canal.
Fundamentals for the week ending Dec 03:
The EIA reported a +59 Bcf injection for week ending Nov 26th, which was close to the market consensus. The range of estimates was quite tight despite the reporting period including the Thanksgiving holiday. The draw was quite strong relative to the same week in past years, but we recognize that it could have been much larger if we did not see the big jump in domestic production and a strong level of Canadian imports during the reporting week.
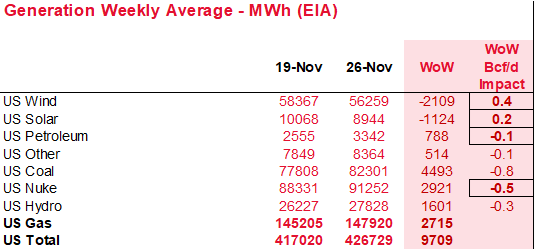
Power generation consumption is not as volatile during this time of the year, but those dynamics are changing with the entrance of more renewables and low coal stocks. As the weather cools and days get shorter, we do see a moderate increase in power load. Last week, the total power load was higher by 2.3% or 9.7 GWh on average. Wind and Solar were both lower adding to the pressure on the thermal generation. Thankfully was coal, nuke, and hydro provided the necessary support to keep the power market balanced. For the week, power burns are estimated to be only 0.5 Bcf/d stronger in response to the increasing load.
For the week ending Dec 3rd, our early view is -52 Bcf. This reporting period will take L48 storage level to 3512 Bcf (-349 vs LY, -83 vs. 5Yr).
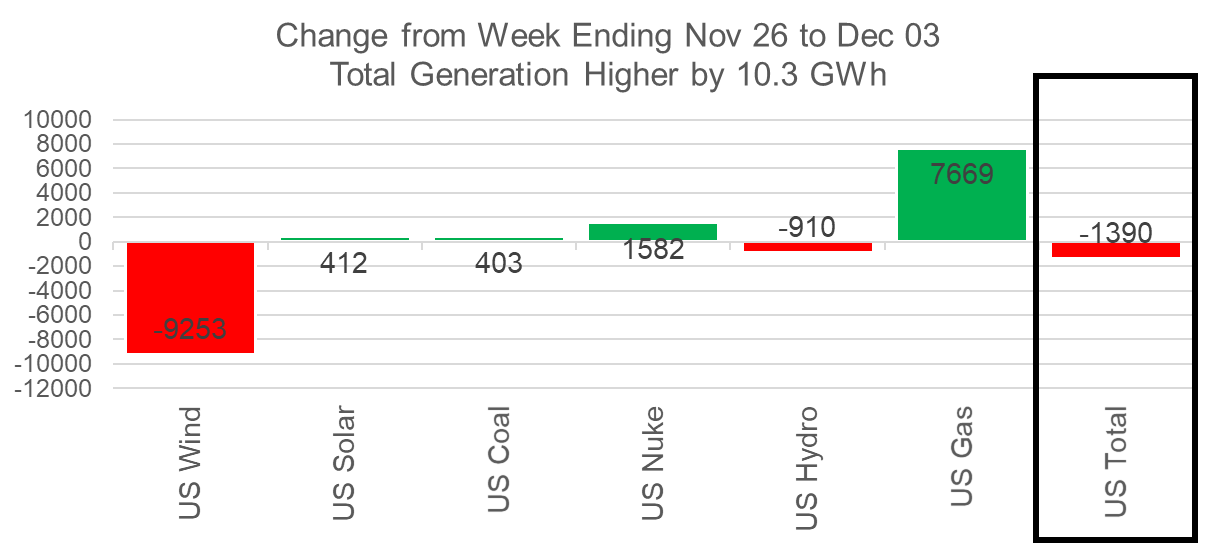
This past week we see total consumption drop slightly with the warm start to December and some continued Thanksgiving holiday impacts. Total HDDs decreased by 1.3F WoW leading to both ResComm and Industrial demand staying relatively flat. Total power stayed flat as we bottom out on the seasonal pattern, but natural gas generation still did increase by an average of 7.8 GWh with wind generation falling off by 9.2 GWH WoW.
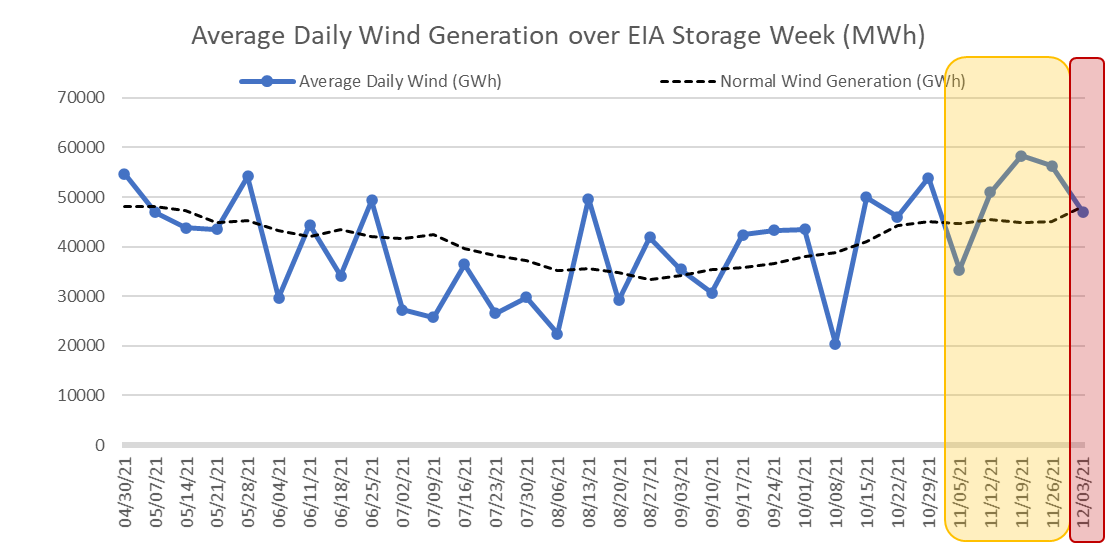
Wind generation had been performing well over normal for most of November, and this past week’s drop now takes it back to our expected normal level.
Domestic dry gas production was higher by 0.7 Bcf/d to 96.9 Bcf/d. The late November push did not pull through into December. The last few days of November averaged above 97.5 Bcf/d, after which we saw a 0.5-1.5 Bcf/d drop off to start December. The general increase in production has been seen predominantly in the Northeast and Haynesville. Vast parts of these shale regions produce dry gas; hence the economics with the strong prices seem to be appealing to producers especially during the winter months. It will be interesting to see if we can hold these strong production levels for the rest of winter and next summer with the recent price drop.
Deliveries to LNG facilities averaged 11.8 Bcf/d, which was +0.1 Bcf/d higher than last week. LNG deliveries started the week strong (>12.3 Bcf/d with Nov 26th setting a new record) as Freeport service was stable and Sabine feedgas levels indicated commissioning activities for Train 6. On Thursday we saw low feedgas levels with Freeport’s scheduled 12 hour Train 1 maintenance and likely commissioning volatility at Sabine. Both plants were back to normal levels on Friday heading back to their highs.
The net balance was 1.1 Bcf looser week-on-week.
Expiration and rolls: UNG ETF roll starts on Dec 15th and ends on Dec 20th.
Jan futures expire on Dec 29th, and Jan options expire on Dec 28th.
This email, any information contained herein and any files transmitted with it (collectively, the Material) are the sole property of OTC Global Holdings LP and its affiliates (OTCGH); are confidential, may be legally privileged and are intended solely for the use of the individual or entity to whom they are addressed. Unauthorized disclosure, copying or distribution of the Material, is strictly prohibited and the recipient shall not redistribute the Material in any form to a third party. Please notify the sender immediately by email if you have received this email by mistake, delete this email from your system and destroy any hard copies. OTCGH waives no privilege or confidentiality due to any mistaken transmission of this email.